An(other) introduction to R
2022-02-07
Chapter 1 Prologue
Dear student,
in the following, you will receive a gentle introduction to R and how you can use it to work with data. This tutorial was heavily inspired by Richard Cotton’s “Learning R” (Cotton 2013) and Hadley Wickham’s and Garrett Grolemund’s “R for Data Science” (abbreviated with R4DS). The latter can be found online (Wickham and Grolemund 2016). We will not immediately start out with the packages from the tidyverse (although some strong points have been made in favor of doing so right from the start). I will rather try to build some sort of foundation from where we can proceed to the tidy packages in the following lessons. Hence, one can also understand this tutorial as an introduction to the tidyverse (Wickham, Averick, et al. 2019) (or hadleyverse, as it was named originally), even though I will not introduce it in this very first part.
When it comes to what I would refer to as the “daily workflow” with R and RStudio, Jennifer Bryan’s blog articles have been a big inspiration for me. When looking at RMarkdown, I will mainly build on “R Markdown: The Definitive Guide” – which is also freely available online (Xie, Allaire, and Grolemund 2018).
Note that you will find all of the chapters as executable RMarkdown documents (on which you will learn more in the following chapter) in the dedicated GitHub repository. Moreover, I will record videos for each chapter and embed them in this online script, just like this:
1.1 Course outline
The coming course will be structured as follows: In the beginning, Chapter 2, I will introduce you to R and the Integrated Developer Environment (IDE) RStudio. Thereafter, in Chapter 3, the basic principles of R (such as underlying principles and data types) are taught.
The process of performing data science looks like this:
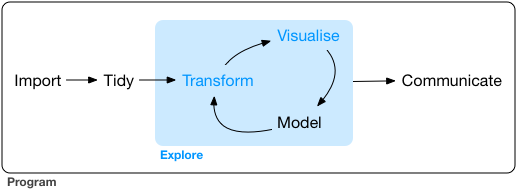
Data science as a process, taken from Wickham and Grolemund (2016)
Chapter 4 will be when you do your first steps with data. In order to analyze them, data need to be read in. Then, more often than not, they need to be reshaped properly to become tidy. Therefore, first, the theoretical principles of tidy data need to be clarified. Those data sets need to be prepared for subsequent analyses – they need to become tidy. You are introduced to techniques for achieving this. Moreover, certain analyses require transformed variables.
Chapter 5 teaches you how to further manipulate variables and data sets in general. Chapter 6 will demonstrate how you can work with strings. In order to achieve this, a general introduction to regular expressions (regexes) is provided. Chapter 7 will demonstrate how to work with categorical data.
In this course, modeling will not be on the menu. This will, however, be covered in further depth in courses on statistical inference. Hence, the script will proceed with communicating data. Chapter 8 will show you how to properly summarize descriptives. In a similar vein, visualization with ggplot2 is to be covered in Chapter 9. Finally, you need to be able to communicate your results properly. This encompasses exporting tables and visualization. However, you can also write entire papers in R using RMarkdown. This is to be exemplified in Chapter 10.
While data science with R is comparably simple and at least 80 per cent of the tasks you will face can be accomplished by just using the tools introduced in chapters 2–9, you might want to delve a bit deeper into the programming part of R. Initial guidance will be provided in Chapter 11
Some sessions will be longer and are split up into multiple, more digestible chunks. Each chapter will come with exercises that you can do at home. Those are not mandatory, yet it is highly advisable to do them thoroughly. [add link to exercise script]
It is worth noting that this script is by no means exhaustive. There are a multitude of ways (and packages) you can use R. I personally go with the “tidy” way of using it as this family of packages is conclusive and has increasingly taken over the R market. However, if you find other approaches of using R to resonate better with you, then no worries; I am quite agnostic to those paradigms and strongly encourage you to choose the way of using R that floats your own boat best.
1.2 Why R
You may wonder why it makes sense for you to learn R and there are many people with way brighter minds and better ways with words than I who have thought and written about this topic. I will just briefly dwell upon the points that I find most interesting from a research perspective (I consider myself a computational social scientist) and then link to resources which might point out how R can contribute to your research/carreer development/pursuit of happiness/you name it depending on your background and your goals.
1.2.1 Reproducibility
In science, we are facing what has been famously coined the “replication crisis”. One way to overcome it is maximum transparency (Munafò et al. 2017). Here, R can help transparency as researchers can simply publish their code to make it easy for their colleagues to comprehend what sorts of analyses have exactly been performed. Moreover, publishing (R) code decisively facilitates replicating the actual analyses with different data to assess the transportability and generalizability of the results.
1.2.2 It’s free and community-based
While licences for applications such as Stata and IBM SPSS are costly for schools and companies, R comes at no cost1. Moreover, the useRs (how R users call themselves) community is constantly developing further packages to extend Rs functionality for free. Also, you can write your own packages or functions if you want to extend your R’s functionality – and then publish them to contribute to the community. Hence, there will not be any need to pay for an R extension or update ever.
1.2.3 Jobs
Data scientist has been considered the “sexiest job of the 21st century” and one of their sharpest tools in the shed is R. The following graphs stem from a blog entry by the statistician Robert Muenchen.

Moreover, the demand for R has been constantly growing throughout the last couple of years.

Note that stuff such as Tensorflow and Keras are also implemented in R, so R definitely will give you an edge on the job market.
And also if your goal is to stay in academia, the tendency appears to be clear:

1.3 Further links
Each chapter will contain a Further links section, where I include useful online resources which you can consume to delve deeper into the matters discussed in the respective chapter.
- Not convinced yet? If you strive for a career in business analytics, let this article sink in.
- If you worry about R being too complex as you’re no computer scientist, read here.
- From an academia point of view, R is very likely to entirely take over the, at least, social sciences and you will be very likely to encounter it in the future.
- Further material for learning covering basically each section of this script can be found on the RStudio website.
- A more accessible guide to singular tidyverse packages can be found in the
introverseR package. Find instructions for how to install and use it online.
1.4 Last but not least
Learning R – and programming in general – is tough. More often than not, things will not go the way you want them to go. Mostly, this is due to minor typos or the fact that R is case-sensitive. However, don’t fret. Only practice makes perfekt. It is perfectly normal to not comprehend error messages. The following video illustrates this:
If questions arise that a google search cannot answer, I am always only one email away – and will probably just hit google right away, too, to figure something out for you.
References
RStudio charges companies from the private sector yet is free for educational institutions and private users↩︎