5 Create GIF animation
5.1 Create static map
Let’s use the previous script map from NL with zoom on Newfoundland island. Before running this, you need to have created map_nl, see Import background basemap Import background basemap
Add the data on the map
geom_pointfunction to add the data with x (longitude) and y (latitude) axis. The projection of the data needs to be in the same projection than the background map.coord_sfallow here to set manually the zoom on specific area based on x and y axis limits.
ggplot() +
  geom_sf(data = map_nl, colour = "black", fill = "white") +
  geom_sf() +
  # We can add an ENTIRELY new data set inside a geom
  geom_point(data = birdsurvey,
             aes(x = decimalLongitude,
                 y = decimalLatitude),
             alpha = 0.1,
             colour = "blue") +
  labs(
    title = "Bird survey between 2002 and 2021"
  ) +
  xlab("Longitude")+ ylab("Latitude") +
  # Zoom in to a specific view
  coord_sf(xlim = c(-60, -52),
           ylim = c(46, 52))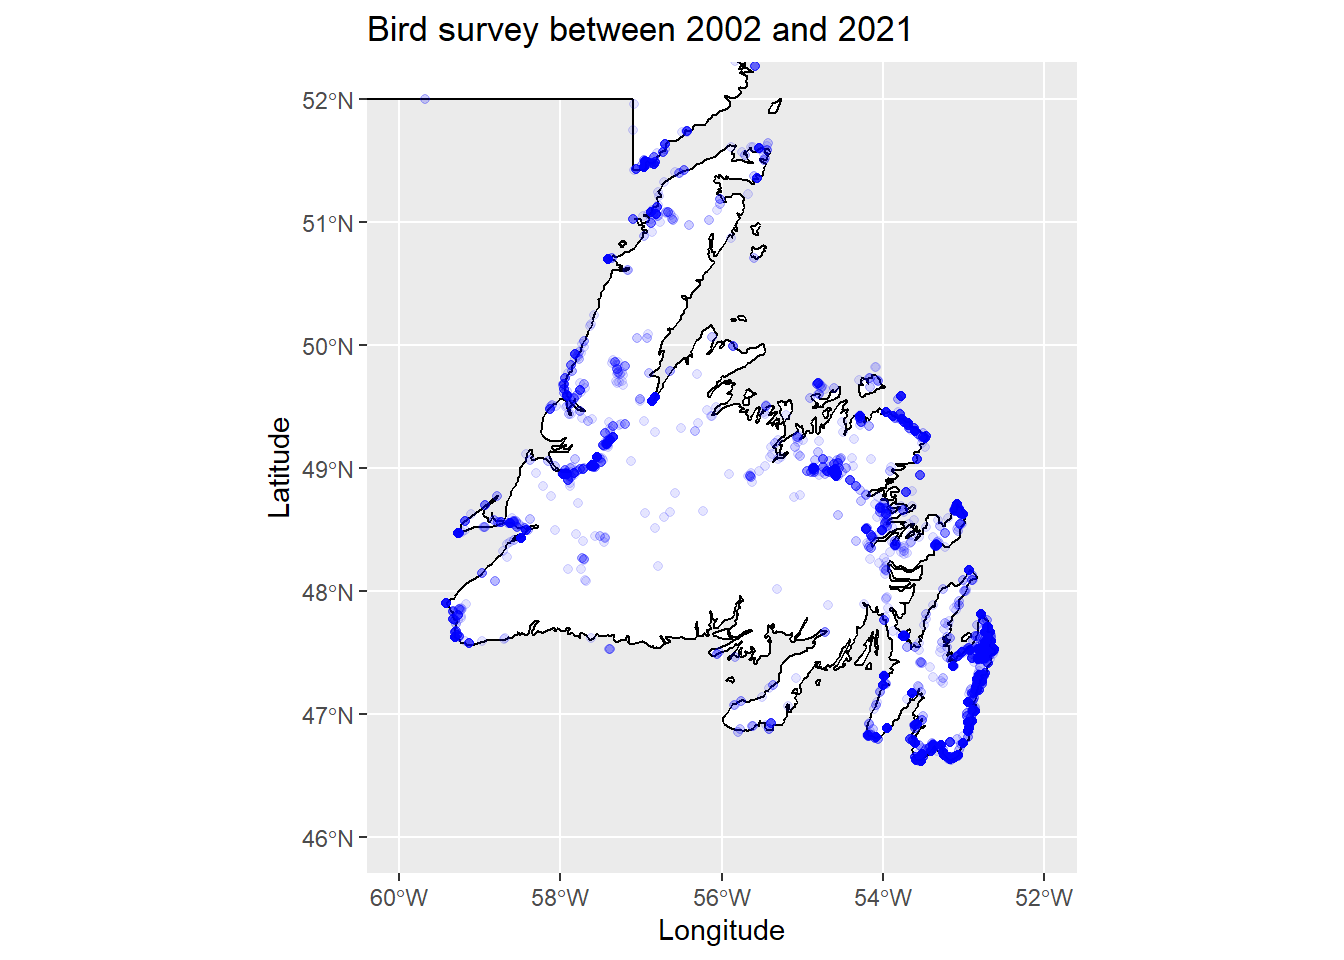
5.2 Subset species and period
Bubo scandiacus
Bubo <- subset(birdsurvey, species == 'Bubo scandiacus')
Bubo_2011_2021 <- subset(Bubo, year >= 2011 & year <= 2021)
### Plot Bubo distribution only
ggplot() +
geom_sf(data = map_nl, colour = "black", fill = "white") +
geom_sf() +
# We can add an ENTIRELY new data set inside a geom
geom_point(data = Bubo_2011_2021,
aes(x = decimalLongitude,
y = decimalLatitude),
alpha = 0.8,
size = 3,
colour = "darkgreen") +
labs(
title = "Snowy owl survey between 2011 and 2021"
) +
xlab("Longitude")+ ylab("Latitude") +
# Zoom in to a specific view
coord_sf(xlim = c(-60, -52),
ylim = c(46, 52))+
theme_bw()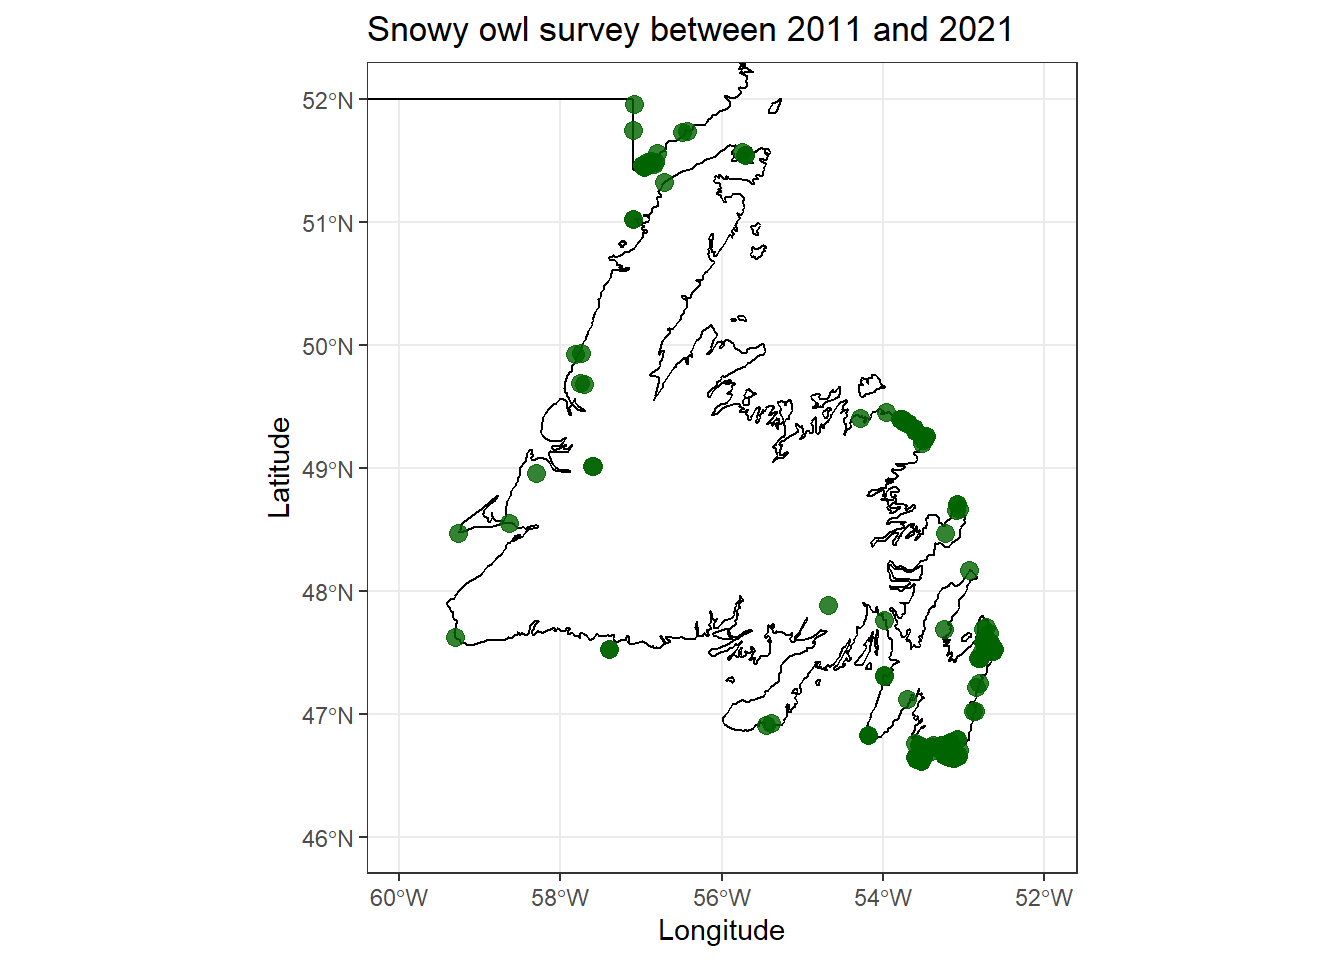
5.3 Create GIF by year
Set the map for the GIF
Here the main difference with a static plot is the function transition_time from the package gganimate. This function allow to set which column we want to use to get one image by period (here, by year).
### Create a ggplot + add specific gganimate function = transition_time
plot1 <- ggplot()  +
  geom_sf(data = map_nl, colour = "black", fill = "white")  +
  # We can add an ENTIRELY new data set inside a geom
  geom_point(data = Bubo,
             aes(x = decimalLongitude,
                 y = decimalLatitude,
                 color = as.factor(year)),
             alpha = 0.8,
             size = 3.5)  +
  transition_time(year) + #### this will allow us to get one image of data by year
  labs(
    title = "Bird survey between 2002 and 2021"
  ) +
  xlab("Longitude")+ ylab("Latitude") +
  # Zoom in to a specific view
  coord_sf(xlim = c(-60, -52),
           ylim = c(46, 52)) +
  labs(title = "Year: {frame_time}")
5.4 Add scale bar and north arrow
A map always needs scale and north arrow. Here we separately set the function to add the two layers to the map previously created before (plot1)
##### Add scale bar and north arrow
plot1 <- plot1 +
  annotation_scale(location = "tl", width_hint = 0.3) +
  annotation_north_arrow(location = "tr", which_north = "true",
                         height = unit(1, "cm"), width = unit(1, "cm"),
                         pad_x = unit(0.25, "cm"), pad_y = unit(0.25, "cm"),
                         style = north_arrow_fancy_orienteering) +
  theme_bw() +
  theme(panel.background = element_rect(fill = "aliceblue"),
        legend.position = "none")
Create the GIF
- The function
animatefrom the packagegganimateis the function use to create the GIF output. There is different options to set. Here we use only the options:nframesanddurationto define the number of frames per second (one frame per year (10 years of survey) for 15 seconds of animation).
######  This part will create the gif
animate(plot1, nframes = 10, duration = 15) ### nframes = is the number of frames/images we want (here, one by year = 10 years) /  duration is the duration of the gif, here 15 secondes