9 Form Survey into Dashboard
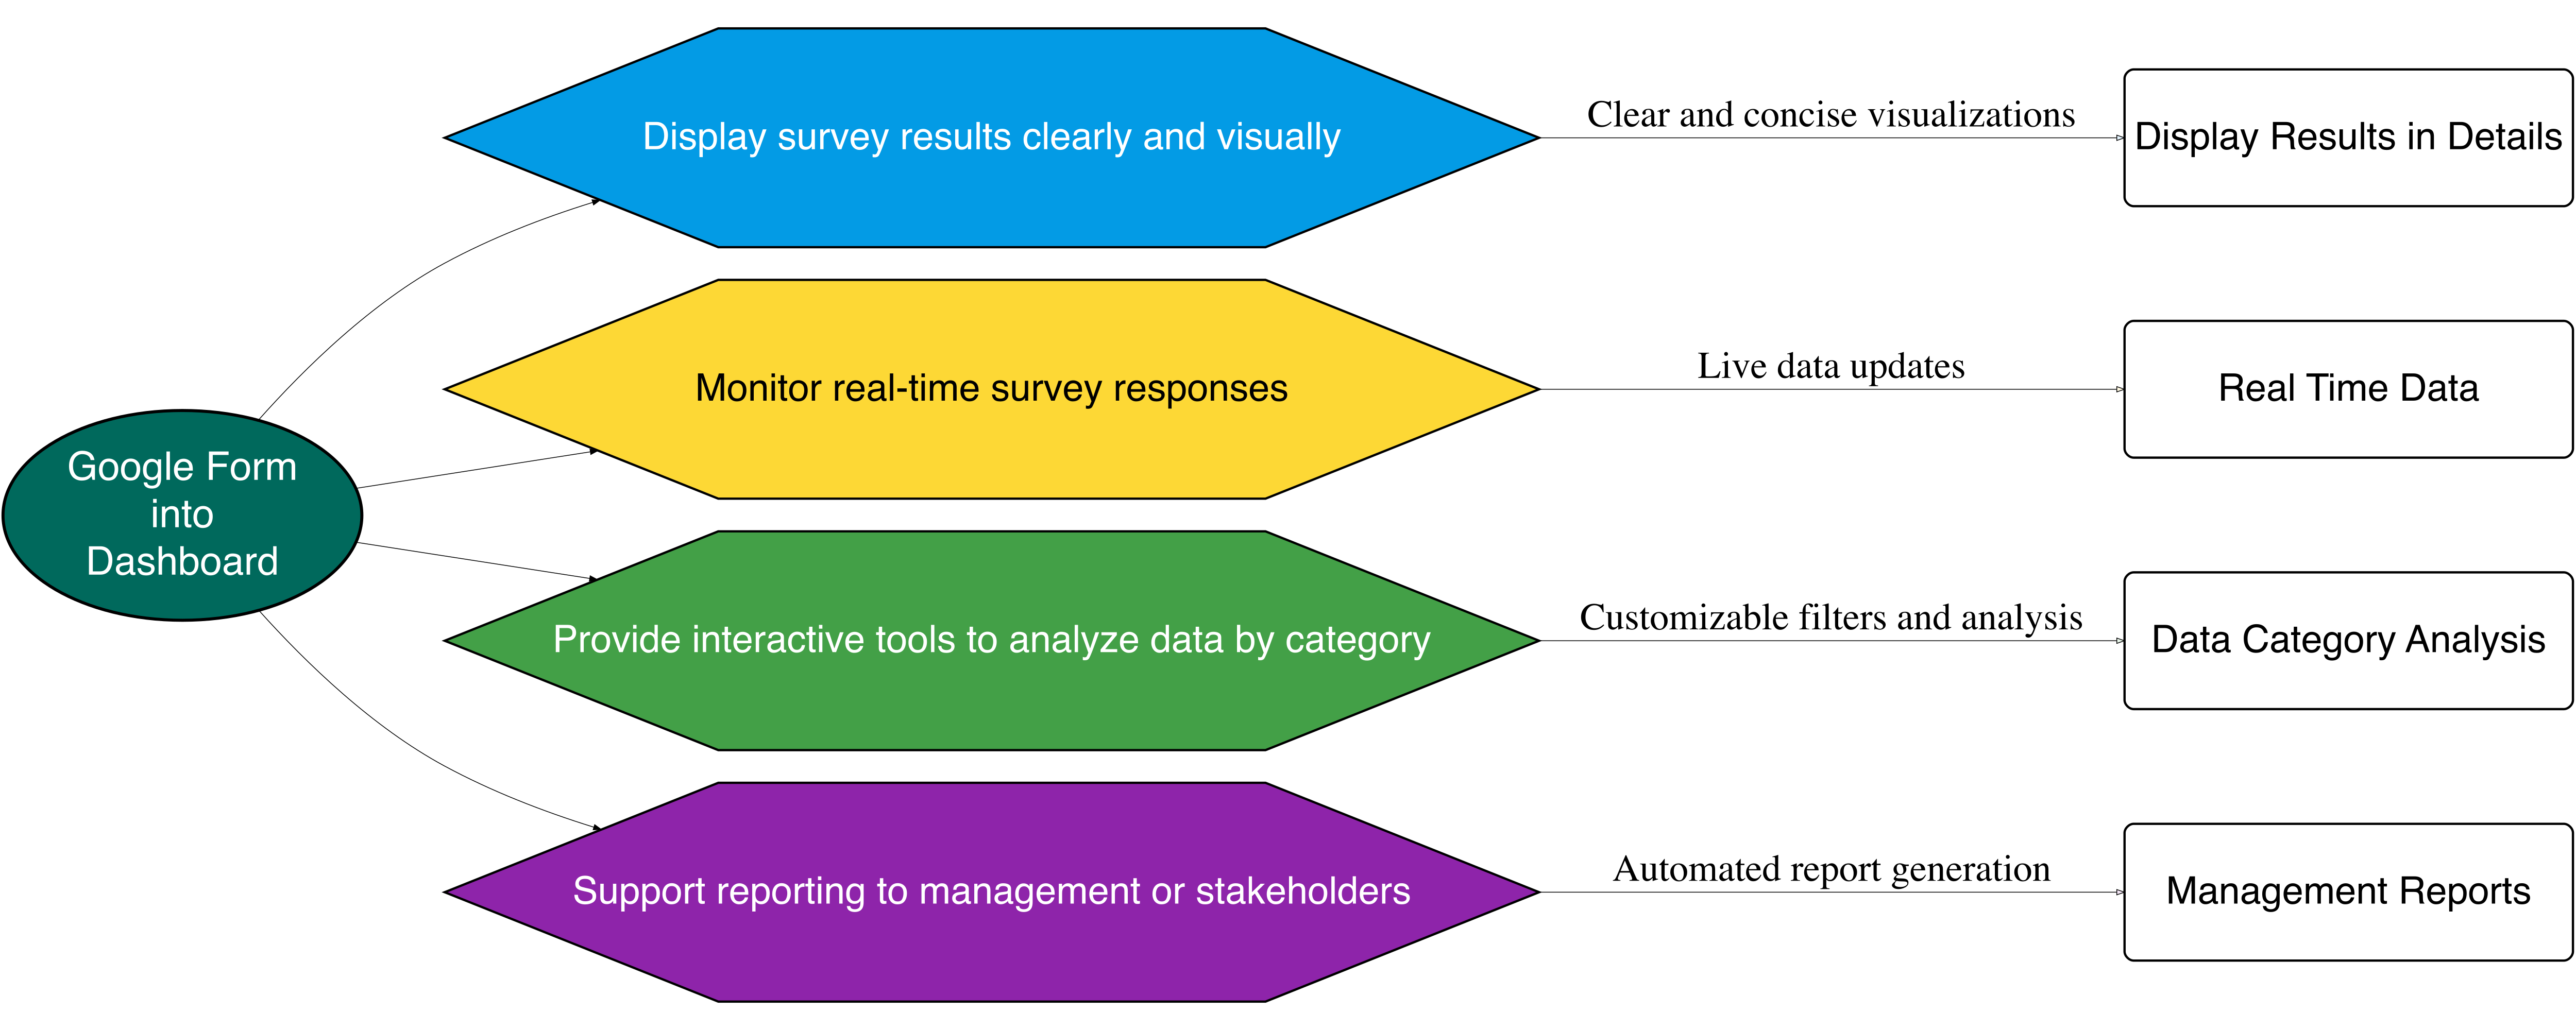
Integrating survey results into dashboards offers key advantages in analysis speed, dynamic visualization, and data-driven decision making.
9.1 Key Dashboard Elements
An effective survey dashboard is made up of several interactive and visual components that help users explore and interpret data easily. Below is a list of common elements found in most survey dashboards, along with their core functions.
| Component | Function |
|---|---|
| KPI/Value Boxes | Show key metrics (e.g., total responses, average satisfaction) |
| Interactive Charts | Visualize distribution and trends using bar, pie, or line charts |
| Filters/Dropdowns | Allow data slicing by time, region, or user segment |
| Table/Data Grid | Display survey responses in detail, with export/download option |
| Word Cloud | Visualize keywords from open-ended responses |
| Map (Optional) | Show geographical distribution of respondents |
9.2 Dashboard Frameworks
Choosing the right tool depends on your team’s technical skills, data sources, and the complexity of your dashboard needs. Below is a comparison of popular platforms used to build survey dashboards, highlighting their key features and strengths.
| Tool/Platform | Key Features |
|---|---|
| R (shiny / flexdashboard) | - Direct connection to Google Sheets or local databases - Open-source and highly customizable - Supports packages like shinydashboard, plotly, DT, highcharter |
| Python (dash / streamlit) | - Flexible for data analysis and machine learning - Interactive and responsive dashboards |
| Excel + PivotCharts + Slicers | - Ideal for quick, offline, or small-scale dashboards |
| Power BI / Tableau | - Professional-grade visuals with drag-and-drop UI - Easy integration with Google Sheets, cloud services, and databases |
9.3 Conneting Google Form
9.3.1 Using R
- Create Google Form → Automatically saves responses to Google Sheets.
- Use
googlesheets4R package to fetch survey data. - Clean and analyze the data.
- Build interactive dashboards using
flexdashboardorshiny.
# Load the googlesheets4 package to interact with Google Sheets
library(googlesheets4)

# Disable authentication – this allows reading only public Google Sheets
gs4_deauth()

# Define the URL of the Google Sheet you want to read
sheet_url <- "https://docs.google.com/spreadsheets/d/1hNDRkTtvi7nO_SUW3JJtA4DOR7_wBOL_WG7f-xEi8-M/edit?usp=sharing"

# Read the data from the Google Sheet into R
survey_data <- read_sheet(sheet_url)

# Display the data that was read from the Google Sheet
survey_data
# A tibble: 1 × 8
Timestamp Staff di program studi membantu m…¹ Dosen memperhatikan …²
<dttm> <chr> <chr>
1 2025-05-19 11:44:58 Sangat memuaskan Sangat memuaskan
# ℹ abbreviated names:
# ¹`Staff di program studi membantu mahasiswa dalam layanan akademik`,
# ²`Dosen memperhatikan kehadiran mahasiswa di dalam perkuliahan`
# ℹ 5 more variables:
# `Proses perkuliahan mengutamakan pendekatan ilmiah seperti (PBL, Studi kasus, proyek dll) sehingga tercipta suasana akademik yang positip` <chr>,
# `Proses pembelajaran relevan dengan karakteristik keilmuan program studi dan memberi kompeensi yang unggul pada mahasiswa` <chr>,
# `Fasilitas, sarana dan prasarana (gedung-gedung, ruangan kelas, laboratorium, taman, dll) sehat, bersih selalu dirawat dengan baik` <chr>, …9.3.2 Using Python
- Create Your Google Form
- Go to Google Forms.
- Create a new form and add questions.
- Click on “Responses” tab → click the Google Sheets icon to link responses to a spreadsheet.
- Get the Public CSV Link from Google Sheets
- Open the linked Google Sheet.
- Click Share → set the sharing to:
- Anyone with the link can view
- Copy the sheet URL.
- Read the Data in Python using pandas
For example:
import pandas as pd

# Use Google Sheet CSV export link
sheet_url = "https://docs.google.com/spreadsheets/d/1hNDRkTtvi7nO_SUW3JJtA4DOR7_wBOL_WG7f-xEi8-M/export?format=csv"
survey_data = pd.read_csv(sheet_url)

# Show the data
survey_data
Timestamp ... Email address
0 19/05/2025 11:44:58 ... siregarbakti@gmail.com
[1 rows x 8 columns]