6 Lab 6. Analyzing camera trap data.
Background
In this lab we will use actual camera trap data collected in Serengeti National Park to investigate temporal niche partitioning. I assume you have already done the data collection as described in Field Lab 6.
Goals of the exercises
The main goal(s) of today’s lab are to:
1) Understand the types of behavioral data that scientists can collect from camera trap photos.
2) Become familiar with one of the ways scientists can compare differences in activity patterns.
3) Think about interspecific interactions of predator-prey and potential competitors in the Serengeti.
Getting started
First we need to load the relevant packages for our data analysis. Packages contain all the functions that are needed for data analysis.
6.1 Part 1: Focus on your Serengeti camera trap data
First we load your data sheet with the times added. NOTE: Make sure that your updated datasheet has the exact same name as the file indicated below.
Then we check the structure
##        X category_id season                           image_id location Time
## 1  79855  wildebeest     S3 S3/N06/N06_R12/S3_N06_R12_IMAG0552      N06   14
## 2  97565  wildebeest     S3 S3/P09/P09_R11/S3_P09_R11_IMAG0531      P09    7
## 3 110725  wildebeest     S3 S3/R09/R09_R12/S3_R09_R12_IMAG1068      R09   16
## 4  59051  wildebeest     S3 S3/K07/K07_R12/S3_K07_R12_IMAG0161      K07   12
## 5  39219  wildebeest     S3 S3/I06/I06_R12/S3_I06_R12_IMAG0039      I06   12
## 6  61300  wildebeest     S3 S3/K11/K11_R12/S3_K11_R12_IMAG0307      K11    1
Now we can make a density plot that will show the distribution of camera trap photos that were taken over 24-hours. We add the fill = ‘category_id’ so that we show different distributions for each animal.
ggdensity(data=CombinedDFTimes,x='Time',fill = 'category_id')+
  xlab('Time (24 hrs)') +ylab('Density')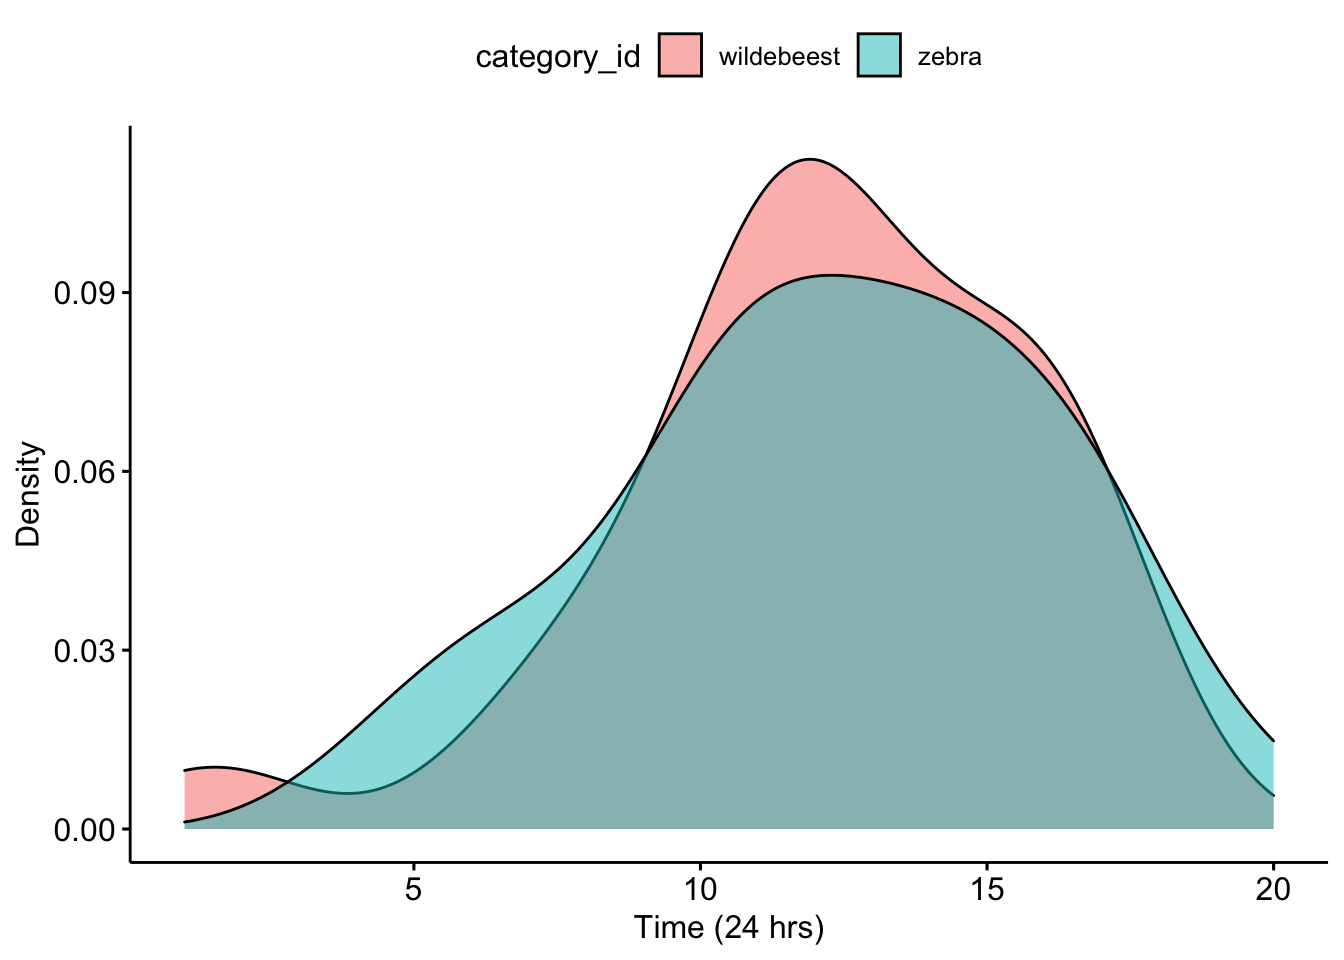
Question 1. What do you notice about the overlap of the two density curves? Does it look like there is temporal niche partitioning?
Now we can calculate an overlap coefficient which can be used to investigate potential competitive and interaction possibilities between species.The value ranges from ranges from 0 (no overlap) to 1 (complete overlap).
First we subset our data to focus on the first animal in our dataset
Then we subset our data to focus on the second animal in our dataset
Now we use the overlap function to calculate the overlap coefficient
## # Overlap
##
## 0.91
Question 2. How do you interpret the overlap coefficient for your data?
6.2 Part 2: Focus on your partner’s Serengeti camera trap data
Now we will read in our partners data.
NOTE: Make sure that your updated datasheet has the exact same name as the file indicated below.
Let’s check the structure
##        X category_id season                           image_id location Time
## 1 247918     cheetah     S2   S2/R07/R07_R3/S2_R07_R3_IMAG0167      R07   15
## 2 326897     cheetah     S3 S3/K11/K11_R11/S3_K11_R11_IMAG0155      K11    1
## 3 204936     cheetah     S2   S2/J11/J11_R2/S2_J11_R2_IMAG1279      J11    6
## 4 364272     cheetah     S3 S3/P10/P10_R11/S3_P10_R11_IMAG0031      P10   12
## 5 262070     cheetah     S2   S2/U13/U13_R1/S2_U13_R1_PICT0091      U13    5
## 6 181602     cheetah     S2   S2/H07/H07_R3/S2_H07_R3_PICT4675      H07   16
Now we can make a density plot for our partner’s data.
ggdensity(data=CombinedPartnerDFTimes,x='Time',fill = 'category_id')+
  xlab('Time (24 hrs)') +ylab('Density')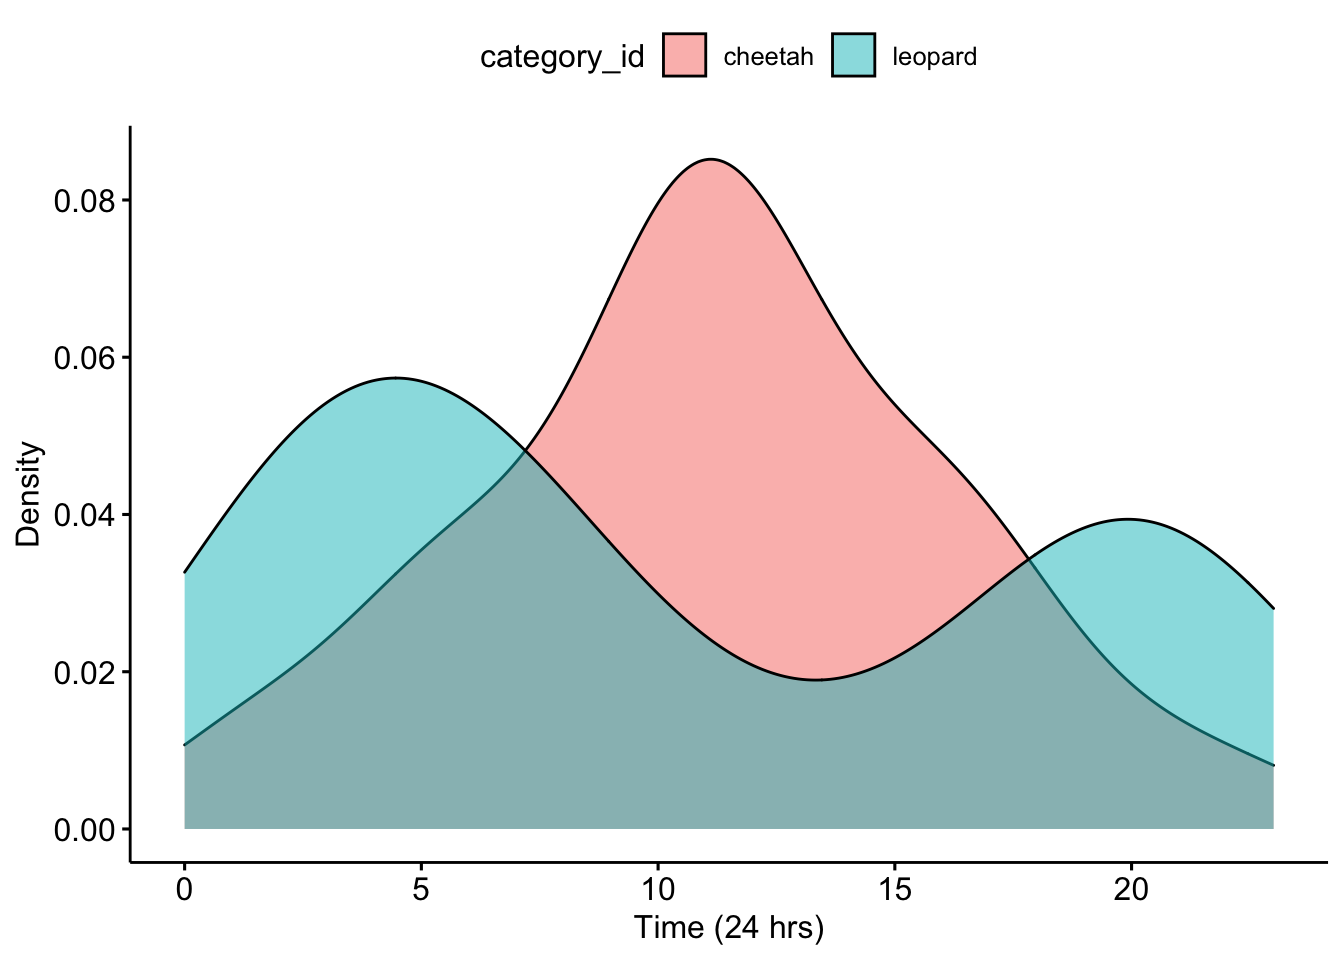
Question 3. What do you notice about the overlap of the two density curves for your partner’s data? Does it look like there is temporal niche partitioning?
Now we can calculate an overlap coefficient which can be used to investigate potential competitive and interaction possibilities between species.The value ranges from ranges from 0 (no overlap) to 1 (complete overlap).
First we subset our data to focus on the first animal in your partner’s data set
Then we subset our data to focus on the second animal in our dataset
Now we use the overlap function to calculate the overlap coefficient
## # Overlap
##
## 0.56
Question 4. What is the overlap coefficient for your partner’s data? How do you interpret this?
6.3 Part 3. Investigating temporal niche partitioning in four different animals
First we combine both datasets
Then we plot the diel activity patterns for all four species
ggdensity(data=AllDataCombined,x='Time',fill = 'category_id',facet.by = 'category_id')+
  xlab('Time (24 hrs)') +ylab('Density')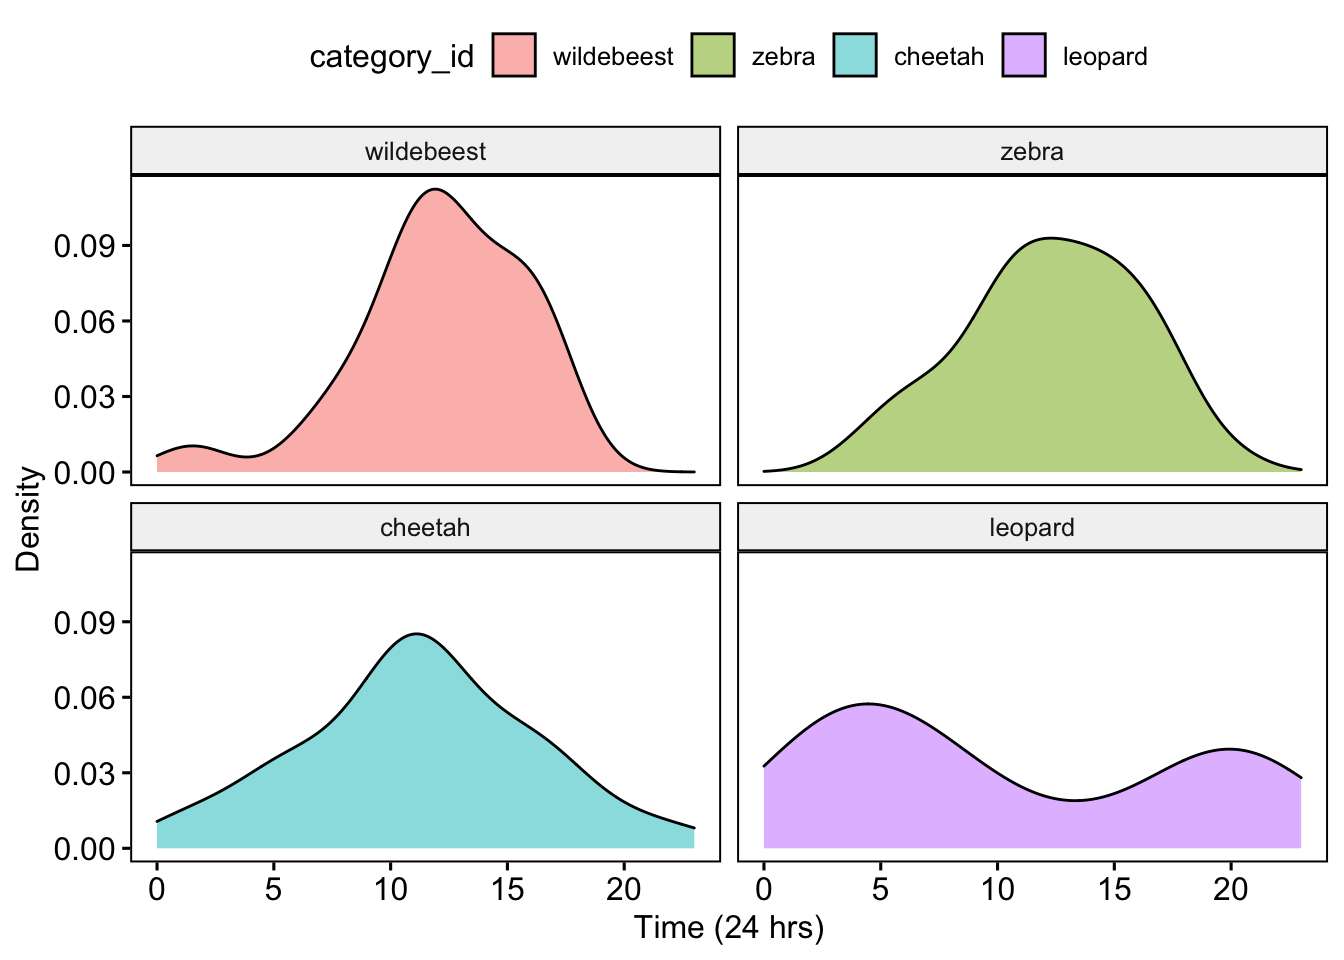
Question 5. Based on the activity patterns and your understanding of the Serengeti food web how do you interpret these results? Is there evidence of temporal niche partitioning among potential competitors? What about interactions between potential predators and prey?