About
Variation in the educational experiences and outcomes of students in the United States is systemically shaped by variation in opportunity that cuts across race, ethnicity, and class. Education systems persistently fail to meet the needs of minoritized racial and ethnic groups of students, including the two largest minoritized groups—Black and Hispanic students. Education systems especially struggle to successfully serve Black and Hispanic students who are lower-income and male. These gaps in opportunity frequently translate into learning and achievement gaps, which disproportionately lead to unfavorable career and life outcomes for Black and Hispanic students, including higher rates of unemployment, poverty, incarceration, and early death.
This website
This website facilitates exploration of Black and Hispanic achievement on NAEP (National Assessment of Educational Progress) since 2003. It is primarily intended for education researchers and policymakers interested in identifying jurisdictions that consistently best serve and support the learning and achievement of Black and Hispanic students in the United States.
The contents of this website help the reader explore where and when Black and Hispanic students, including Black and Hispanic lower-income and male students, consistently scored highest on measures of NAEP achievement. The ultimate purpose of this effort is to learn from jurisdictions with track records of best supporting the learning and achievement of Black and Hispanic students over sustained periods of time.
This project deliberately avoids presenting direct comparisons in achievement between students of different races since this practice, while often used in education research, lends itself to promoting deficit narratives. Instead, comparisons are made between groups of students from particular states and the same groups of students nationally.
The importance of consistently observing greater achievement
Like many statistics, NAEP estimates of mean achievement are subject to error. Mean NAEP scores are subject to both measurement and sampling error. As such the mean achievement score of a group of students for any given testing year will be influenced by some degree of statistical “noise.” This of course complicates identifying jurisdictions that appear to best support the learning and achievement of Black and Hispanic students. A relatively high NAEP score in any given year may be unduly influenced by error. If, however, a jurisdiction’s mean achievement estimates for a group of students is relatively high across several years of testing, then there is greater evidence to suggest that the jurisdiction is successfully supporting the learning of the group of students.
Why NAEP?
NAEP results are incomparably valuable to education researchers and policymakers. Results from NAEP assessment offer the only common metric of math and reading achievement on which representative samples of students from all states and select large districts can be compared. Importantly, these results also provide us a sense of which states are best supporting the learning and achievement of underserved groups of students, including Black and Hispanic students.
The Data
The data presented in the current version of this website come from the NAEP Data Explorer, a web-based system that provides users with tables of detailed results from NAEP assessments made available to the general public by the National Center for Education Statistics. Assessment results are presented dating back to 2003. Although the very first NAEP Assessment was administered nationally in 1969, it was first administered at the state-level in all 50 states in 2003 (Lapointe, 2004; Olkin, 2004).
Data Suppression. The NAEP program does not currently provide a complete account of demographic group achievement across jurisdictions. As a longstanding policy, for concerns related to statistical precision, NAEP only reports mean achievement estimates calculated from samples of at least 62 students (Elliott & Phillips, 2004). Consequently, the mean achievement of minority (low incidence) populations of students are frequently suppressed in reporting.
On this website, when mean achievement estimates are unavailable (suppressed in NAEP reporting), these data points will be absent from visual representations that appear throughout the website. As an example, estimates of mean grade 8 reading achievement of Hispanic students are illustrated below for Kentucky. In this plot, mean achievement estimates are missing for years 2003 through 2007 because these estimates are suppressed (unavailable) in NAEP reporting.
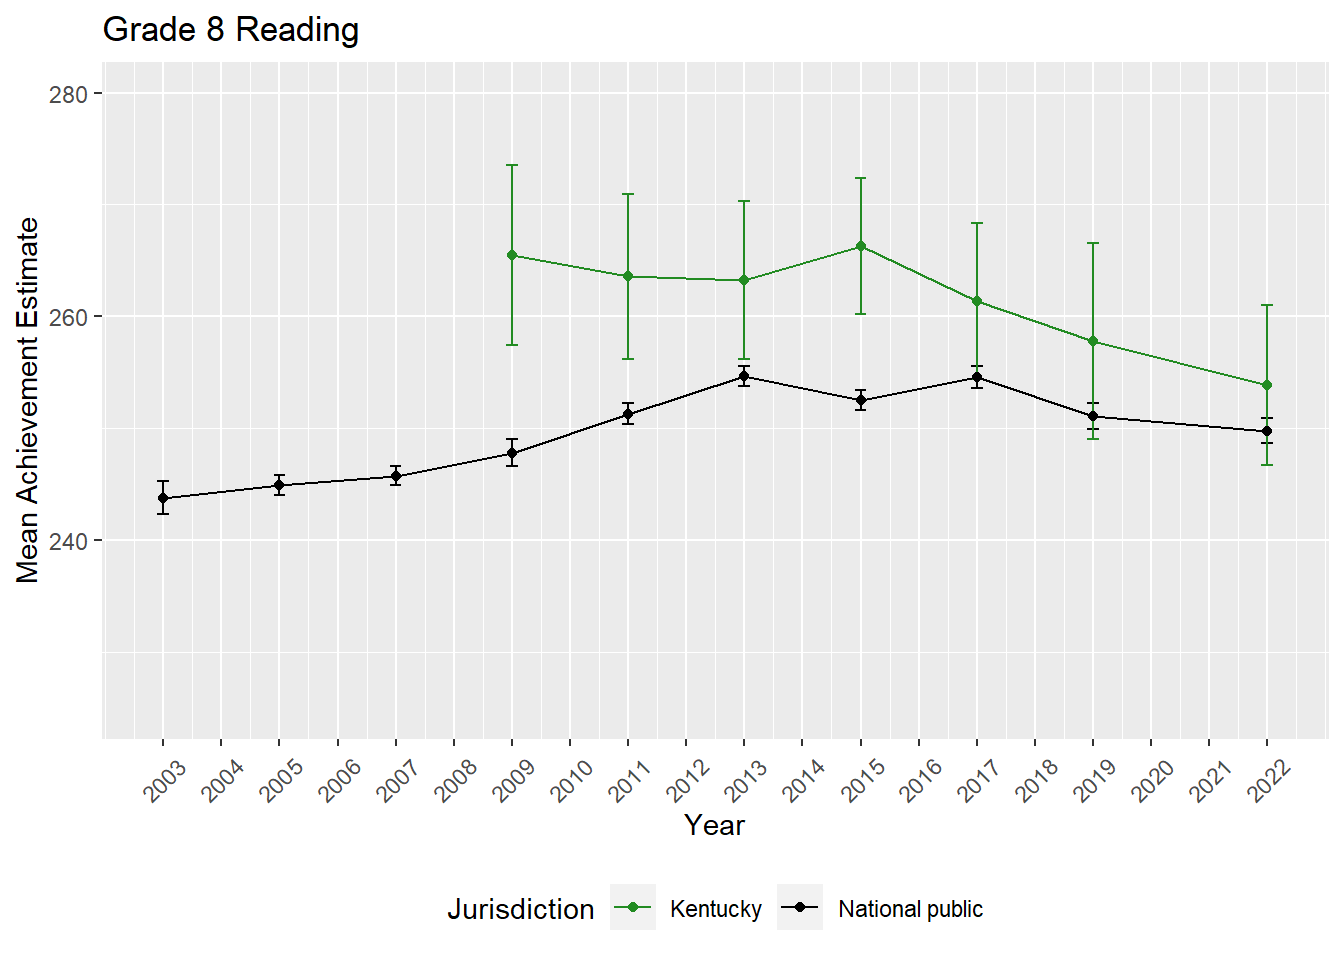
Confidence Intervals. In the graphs that populate chapters one through four, 95% confidence intervals are used to illustrate the mean achievement estimates of jurisdictions. The intervals will tend to be larger when corresponding estimates are calculated from smaller samples.
Version notes: The major update in v1.2 is the inclusion of data sets in chapter 5. These are the data used to generate plots in chapters 1 to 4.