ggplot2 is a plotting system for R, based on the grammar of graphics.
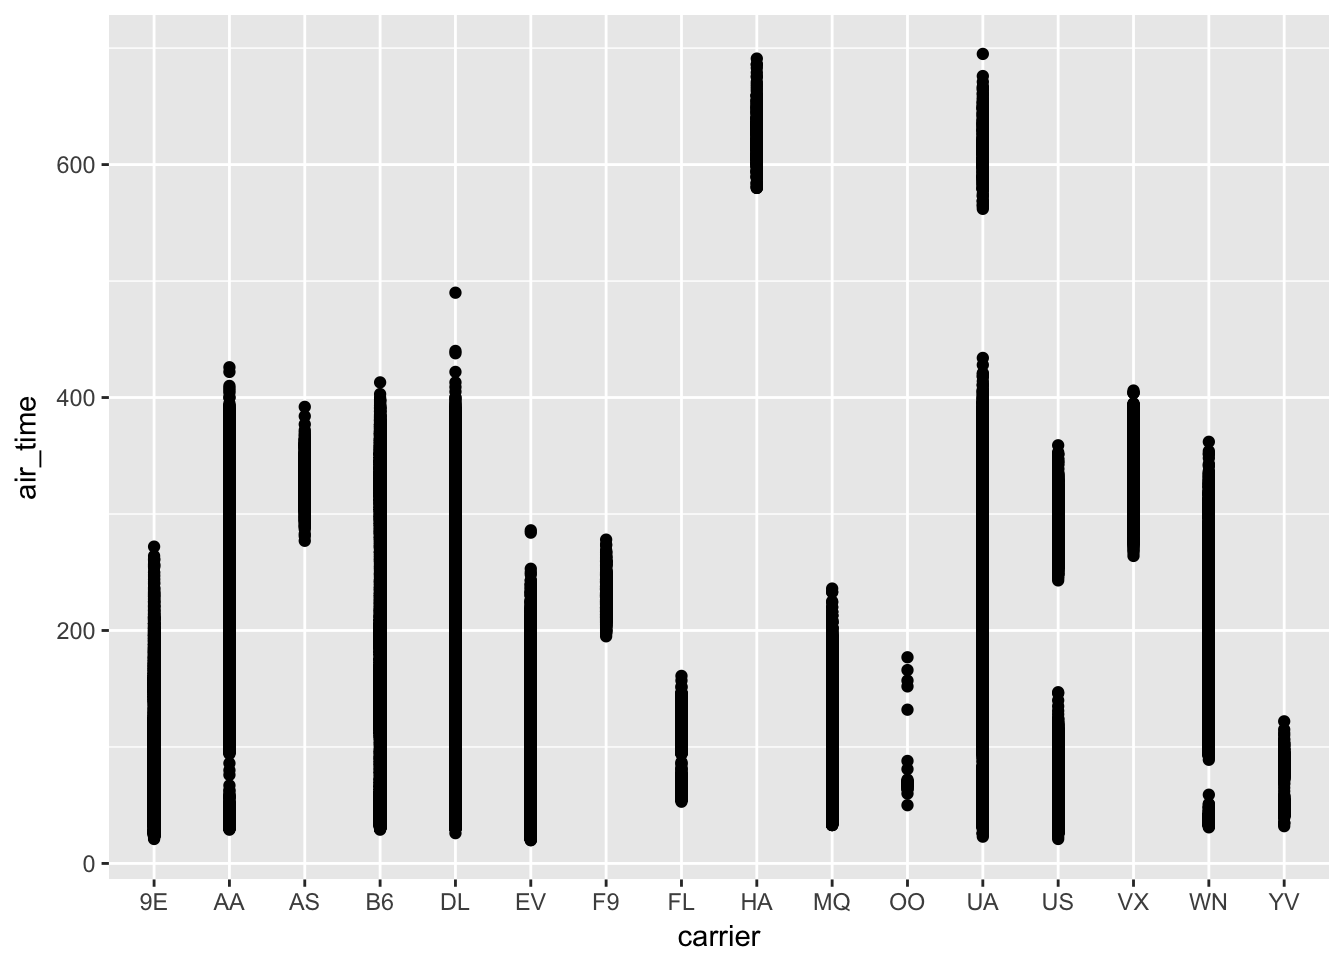
library(ggplot2)

ggplot(flights, aes(x=carrier, y=air_time)) + geom_point()
## Warning: Removed 9430 rows containing missing values (geom_point).