Chapter 4 Workshop: Predicting structure and function from sequence
In this session, we will explore the concepts of sequence similarity and sequence alignment and how they can be used to predict the structure and function of a protein.
Rather than analysing the entire PDVJ01000001.1 DNA sequence (it’s very long!), we will investigate just one section of it (a subrange). Try translating this DNA sequence (in all 6 reading frames) and using one of the resulting predicted protein sequences.
To perform the translation, you could use one of these tools: - https://web.expasy.org/translate/ - https://www.ncbi.nlm.nih.gov/orffinder/
This should yield some potential protein amino-acid sequences, for example these:
GYSVQKIRNIAVIAHVDHGKTSHEQVNERAMDSNALEKERGITILSKNTAIRYGDHKINVIDTPGHADFGGEVERVLKMVDGALILVDAYEGVMPQTKFVVKKMLALGLKPIVVINKIDKPSADPERVIDEVFDLFVAMDATEDQLDFPVIYAAARDGIAKLDMADPDGDFTCLFNMILDKVPEPQGDPENPTQLQVFTLDYDNYVGKIGIARIFNGRISKGDNILLAKADGELVKGKISKLIGFMGLNRMEIQTAEAGDIVALAGIETVDVGDTICDPNNPMPLDPMHVEEPTLNVFFSVNDSPLAGQEGKHITSNKIKERLEAEMNTNVAMRCEVIGEGKFQVSGRGELQITILAENMRREGFEFGIGRPEVIIRDIDGVKCEPFEHLVVDLPQDFAGSIIERLGRRKAEMTAMVPMGEGFTRVEFVIPARGLIGFRGQFLTETKGEGVMNHSFLEFRPYTASGVESRQYGALTSMEDGVTLAFSLANLQERGVLFVSPQTKVYKGMIVGEHSRTNDLDVNPVKGKAQSNVRSSGADEAIKLVPPRDMNLERALEWIEDDELLEVTPLSIRIRKKWLDPTDRKRYAKK
or
RKGTIMLRSLFAGVTGLQAHQIAMDVESNNIANVNTIGFKYSRANFSDLLAQTAQIATAPQGDLGGKNAVQIGLGTTINSVTRIMTQGSIQNTDKNTDVAIQGDGFFIVSSDAGSTYKYSRSGDFKFDAGGNFVDNGGFIVQGWVRDEVTGKVDSTAPITNINIPPGLTTPANPSGVVTLKANLDSGETVETFNPTNEMATYSLTDYLAYVAASPGPYTVAQSTANAIRTANTNVAEDVKVMFNEQGRSMVMQTGQGVWISYKPAIENETILGVAGAFTFDLNGTTISGTTPGVIAADNAGYIAQQINAKTALTGVVATVGAGGAMVLTNDNARASDLDATKNIRITLGAGAAAVGMAATVANNNNTTAYNYRYASNAVDLANNVAPINTTFRTTEQLRIIMQEHAQLITGSTGVEVIINNEGQYKFTNNNDGDATQEDLKMQVTAYSDANSNITKNVRFTEVMQAIDGTLIEGSTGIRLSQSLNAATHSASIDIYDSLGSKHTLKMDFRKTGVDTVTGATWSMKLSVPAPGEINTIAPLNEIDGQVSFGPDGSLSSYTPTNVNFTGNNGSSPNQNVNIDLGTSNAFDGITSFDATSGTSGISQDGFPGGDIVGIRIDQSGTLIGSFSNGRSFGLAQIGMAKFTNNEGLVADGGNVFLQSANSGDPIIGTAATAGRGFMQSSALEASNVDLSKSLTNLIIIQRGYQANGKTITTSDTLLETLLGIKR
Please see the following series of screenshots illustrating how to use BLAST to gather homologues (i.e. related sequences) of our query sequence, align them and generate a phylogenetic tree.
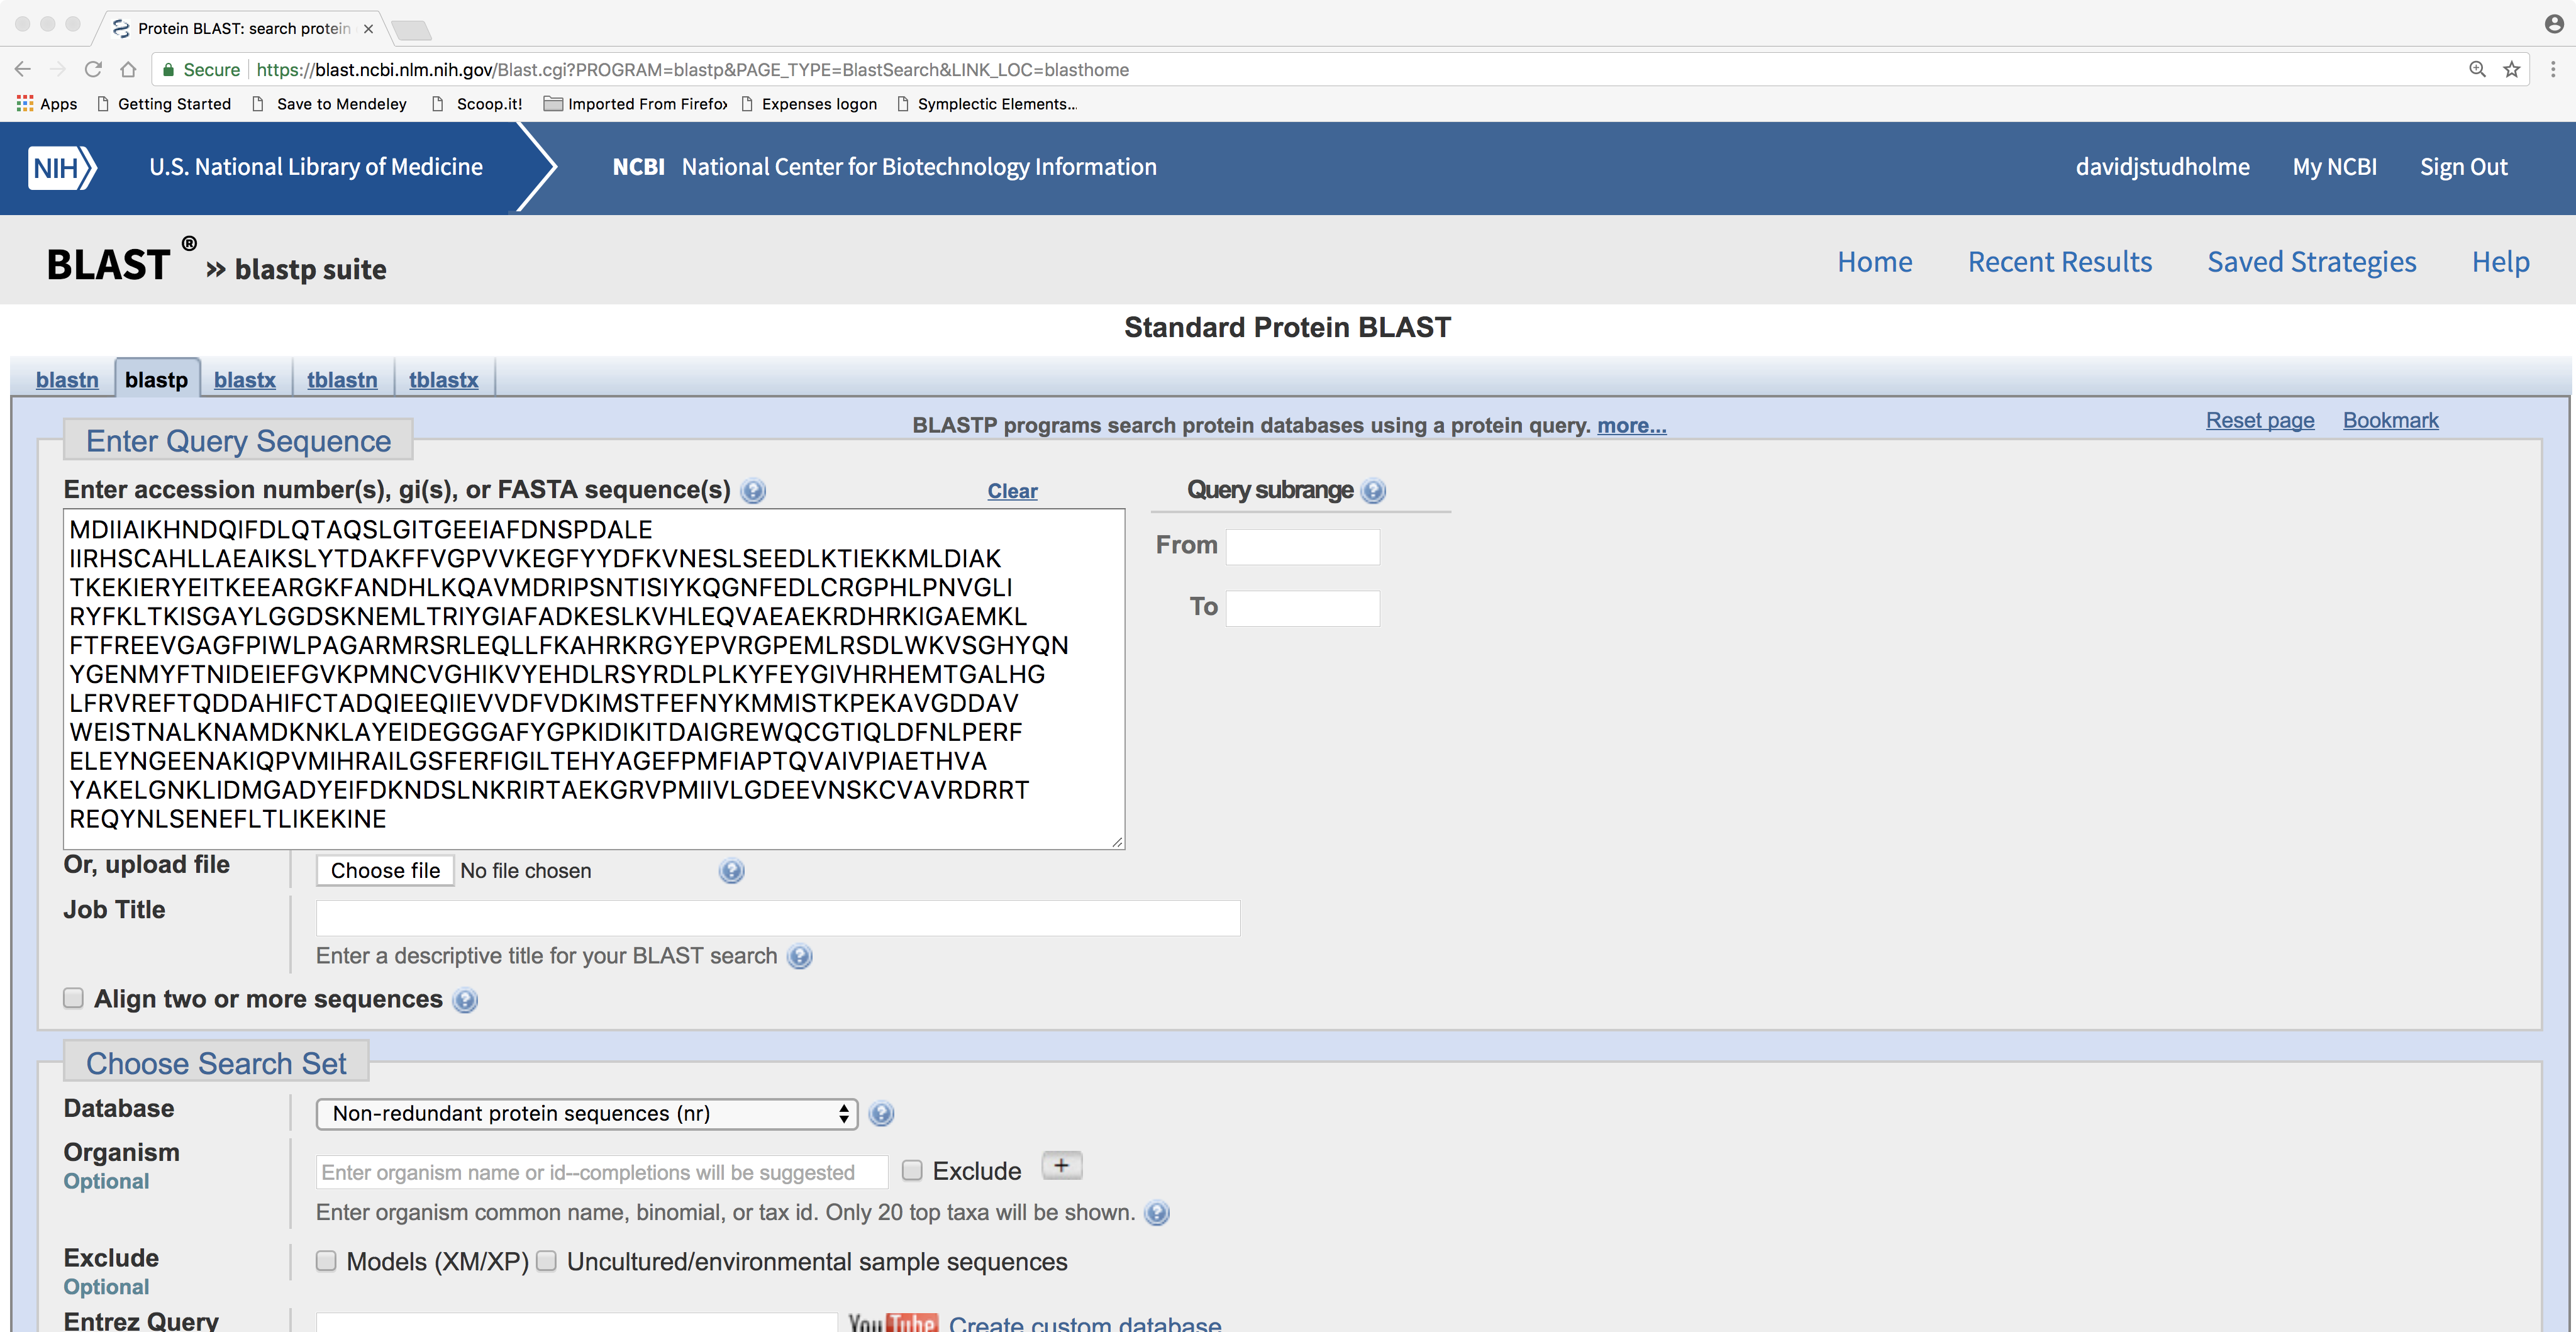
Here is the BLASTP search form:
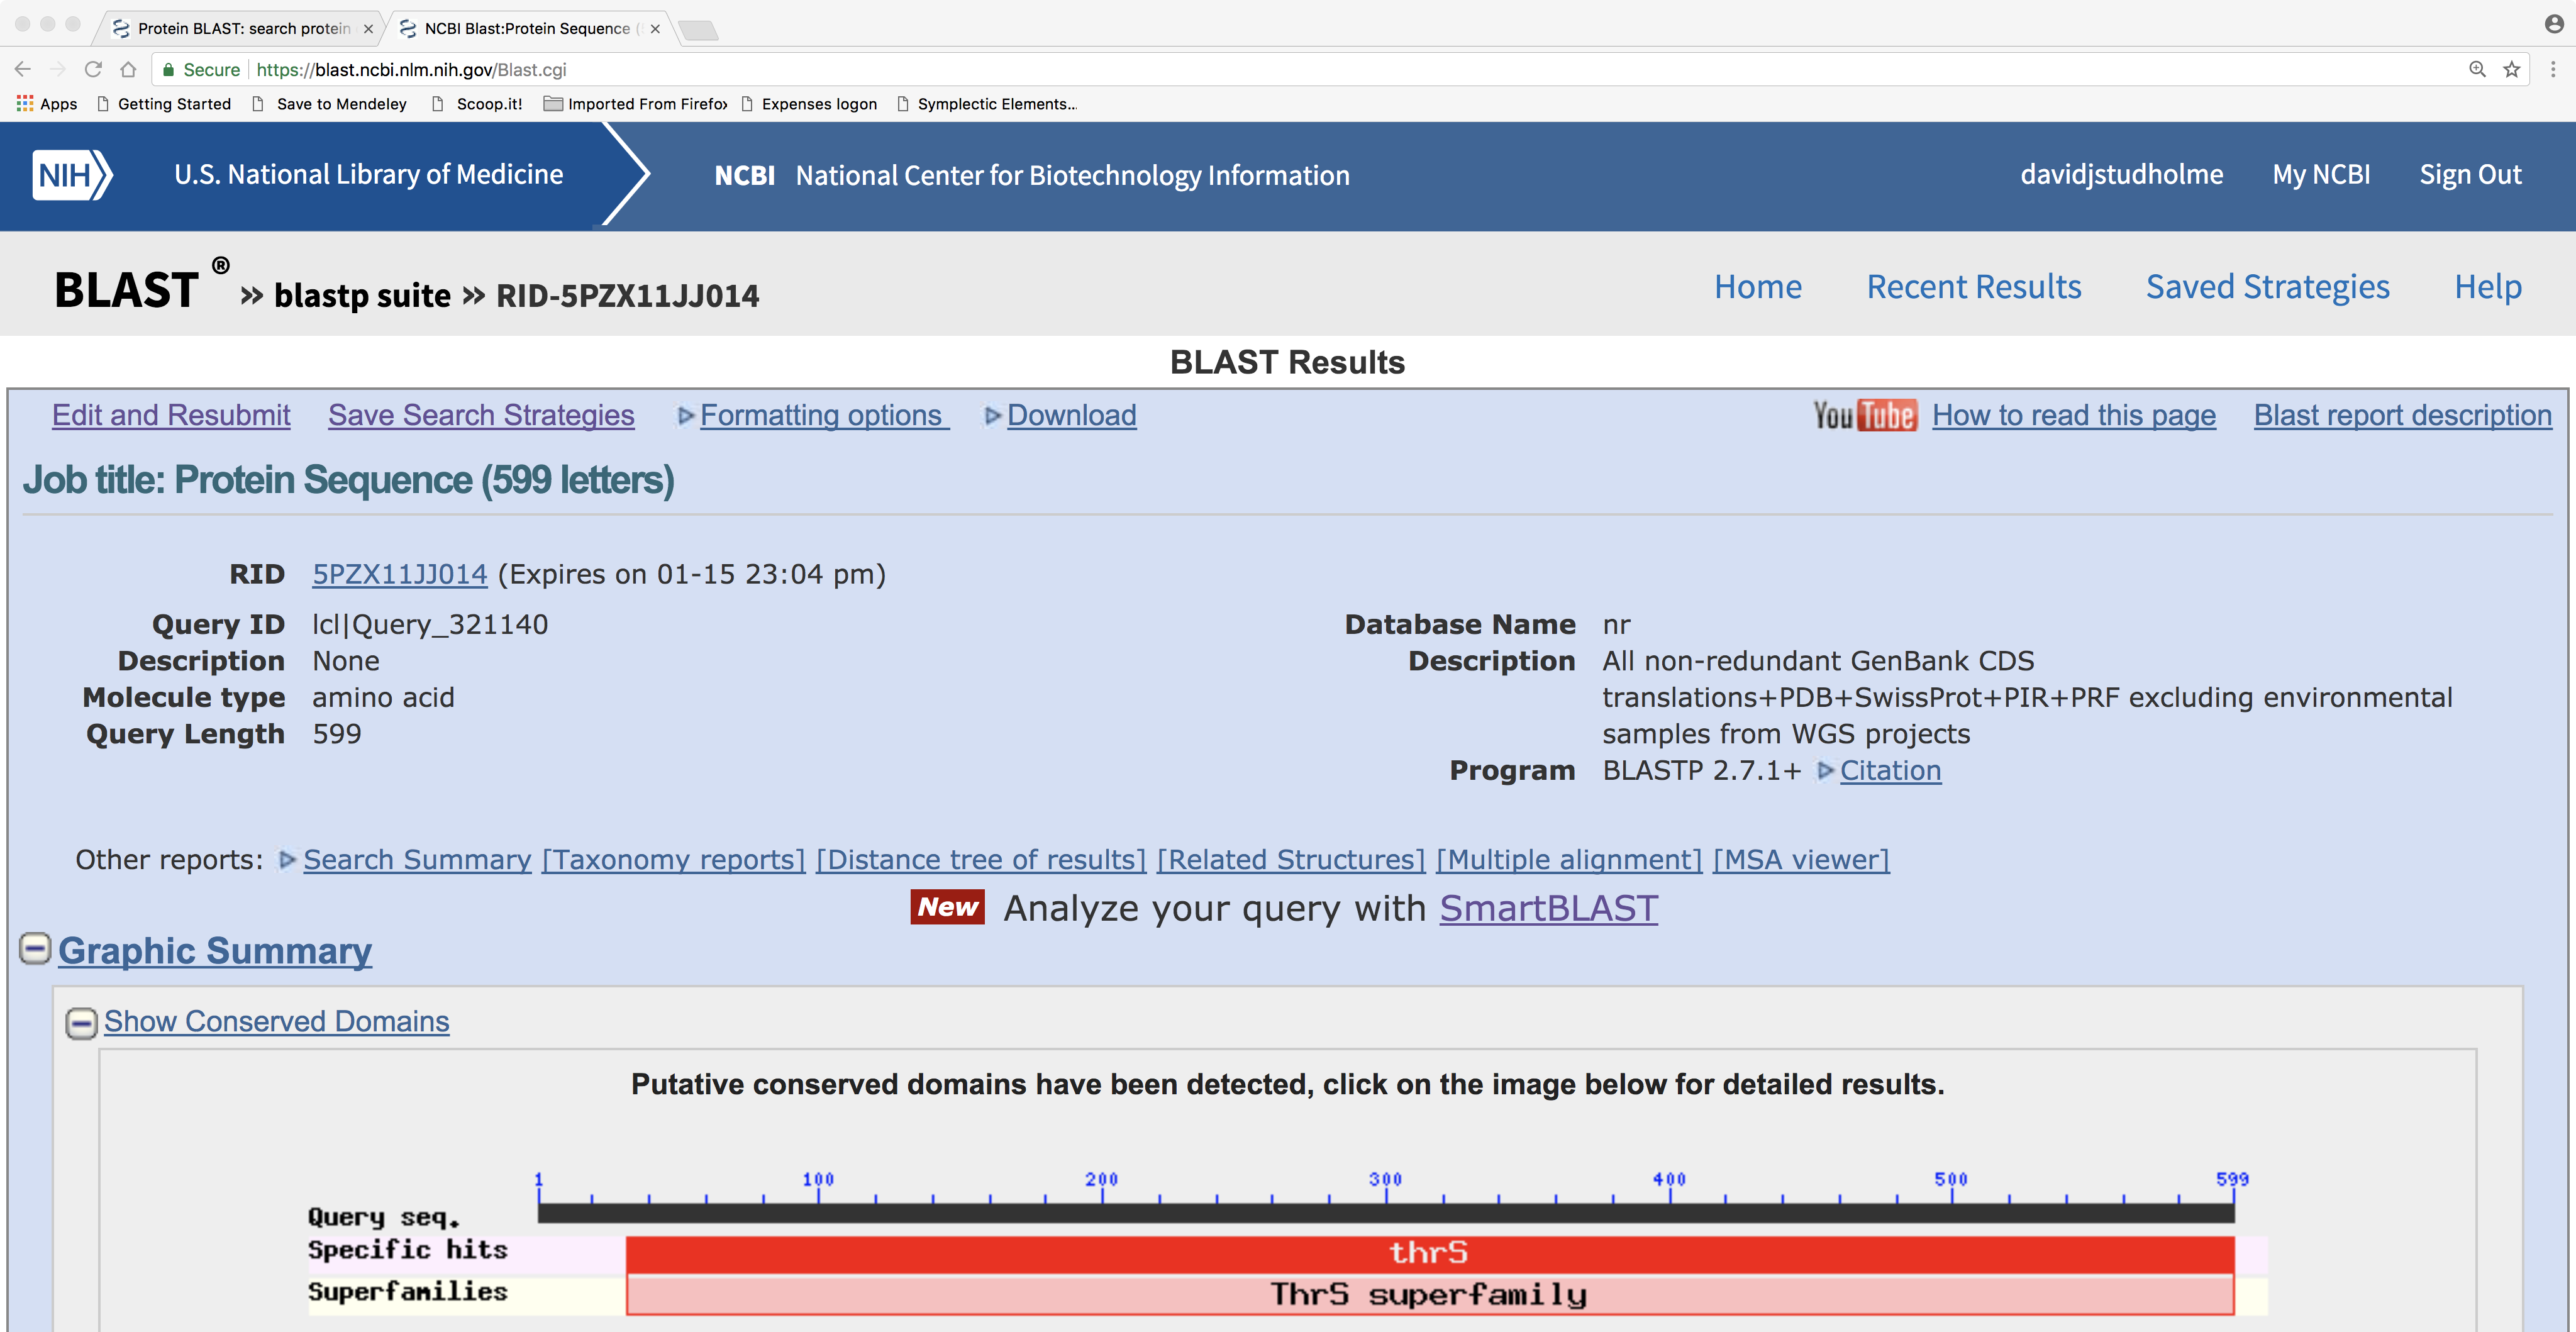
Here is the BLASTP result page. Note the graphical representation of protein domain structure. Also note hyperlinks to “Multiple alignment” and “Distance tree of results”:
4.0.1 A note about protein domains
Often, a single polypeptide chain within a protein can be made-up of multiple domains. Each domain may have a different function; for example, a transcription factor protein might contain a DNA-binding protein combined with another domain that interacts with other regulatory proteins. That same DNA-binding domain might also occur in some other protein, perhaps containing a protein-kinase domain. So, proteins are modular, comprised of basic functional and structural building blocks that are the domains. See pages 370-371 in A. Lesk (2017).
There are several databases that allow us to recognise domains within an amino-acid sequence. These include Pfam, SMART, TIGRfams, among others. The NCBI’s BLAST web page presents the results of searches against these domain databases in addition to the actual search results. Searching agains a domain database such as Pfam is achieved not via a BLAST search but rather through the use of hidden MArkov models (HMMs). You can read more about the use of HMMs in pages 152 - 153 in A. M. Lesk (2019) (this textbook is widely available, e.g. online via the University of Exeter library). Another tool that you can use for simultaneously searching against a whole collection of domain databases is InterProScan.
4.1 Generating a sequence alignment and phylogenetic tree
Placing a novel protein/gene into a phylogenetic tree can reveal insights into its evolutionary origins and possibly its function. Recall that this example query sequence from the previous workshop GenBank: PDVJ01000001.1 came from a metagenome. A metagenome is basically a mixture of many individual genomes, potentially from many different species. How do we know which species this sequence originated from? A phylogenetic analysis can help to ansswer this question.
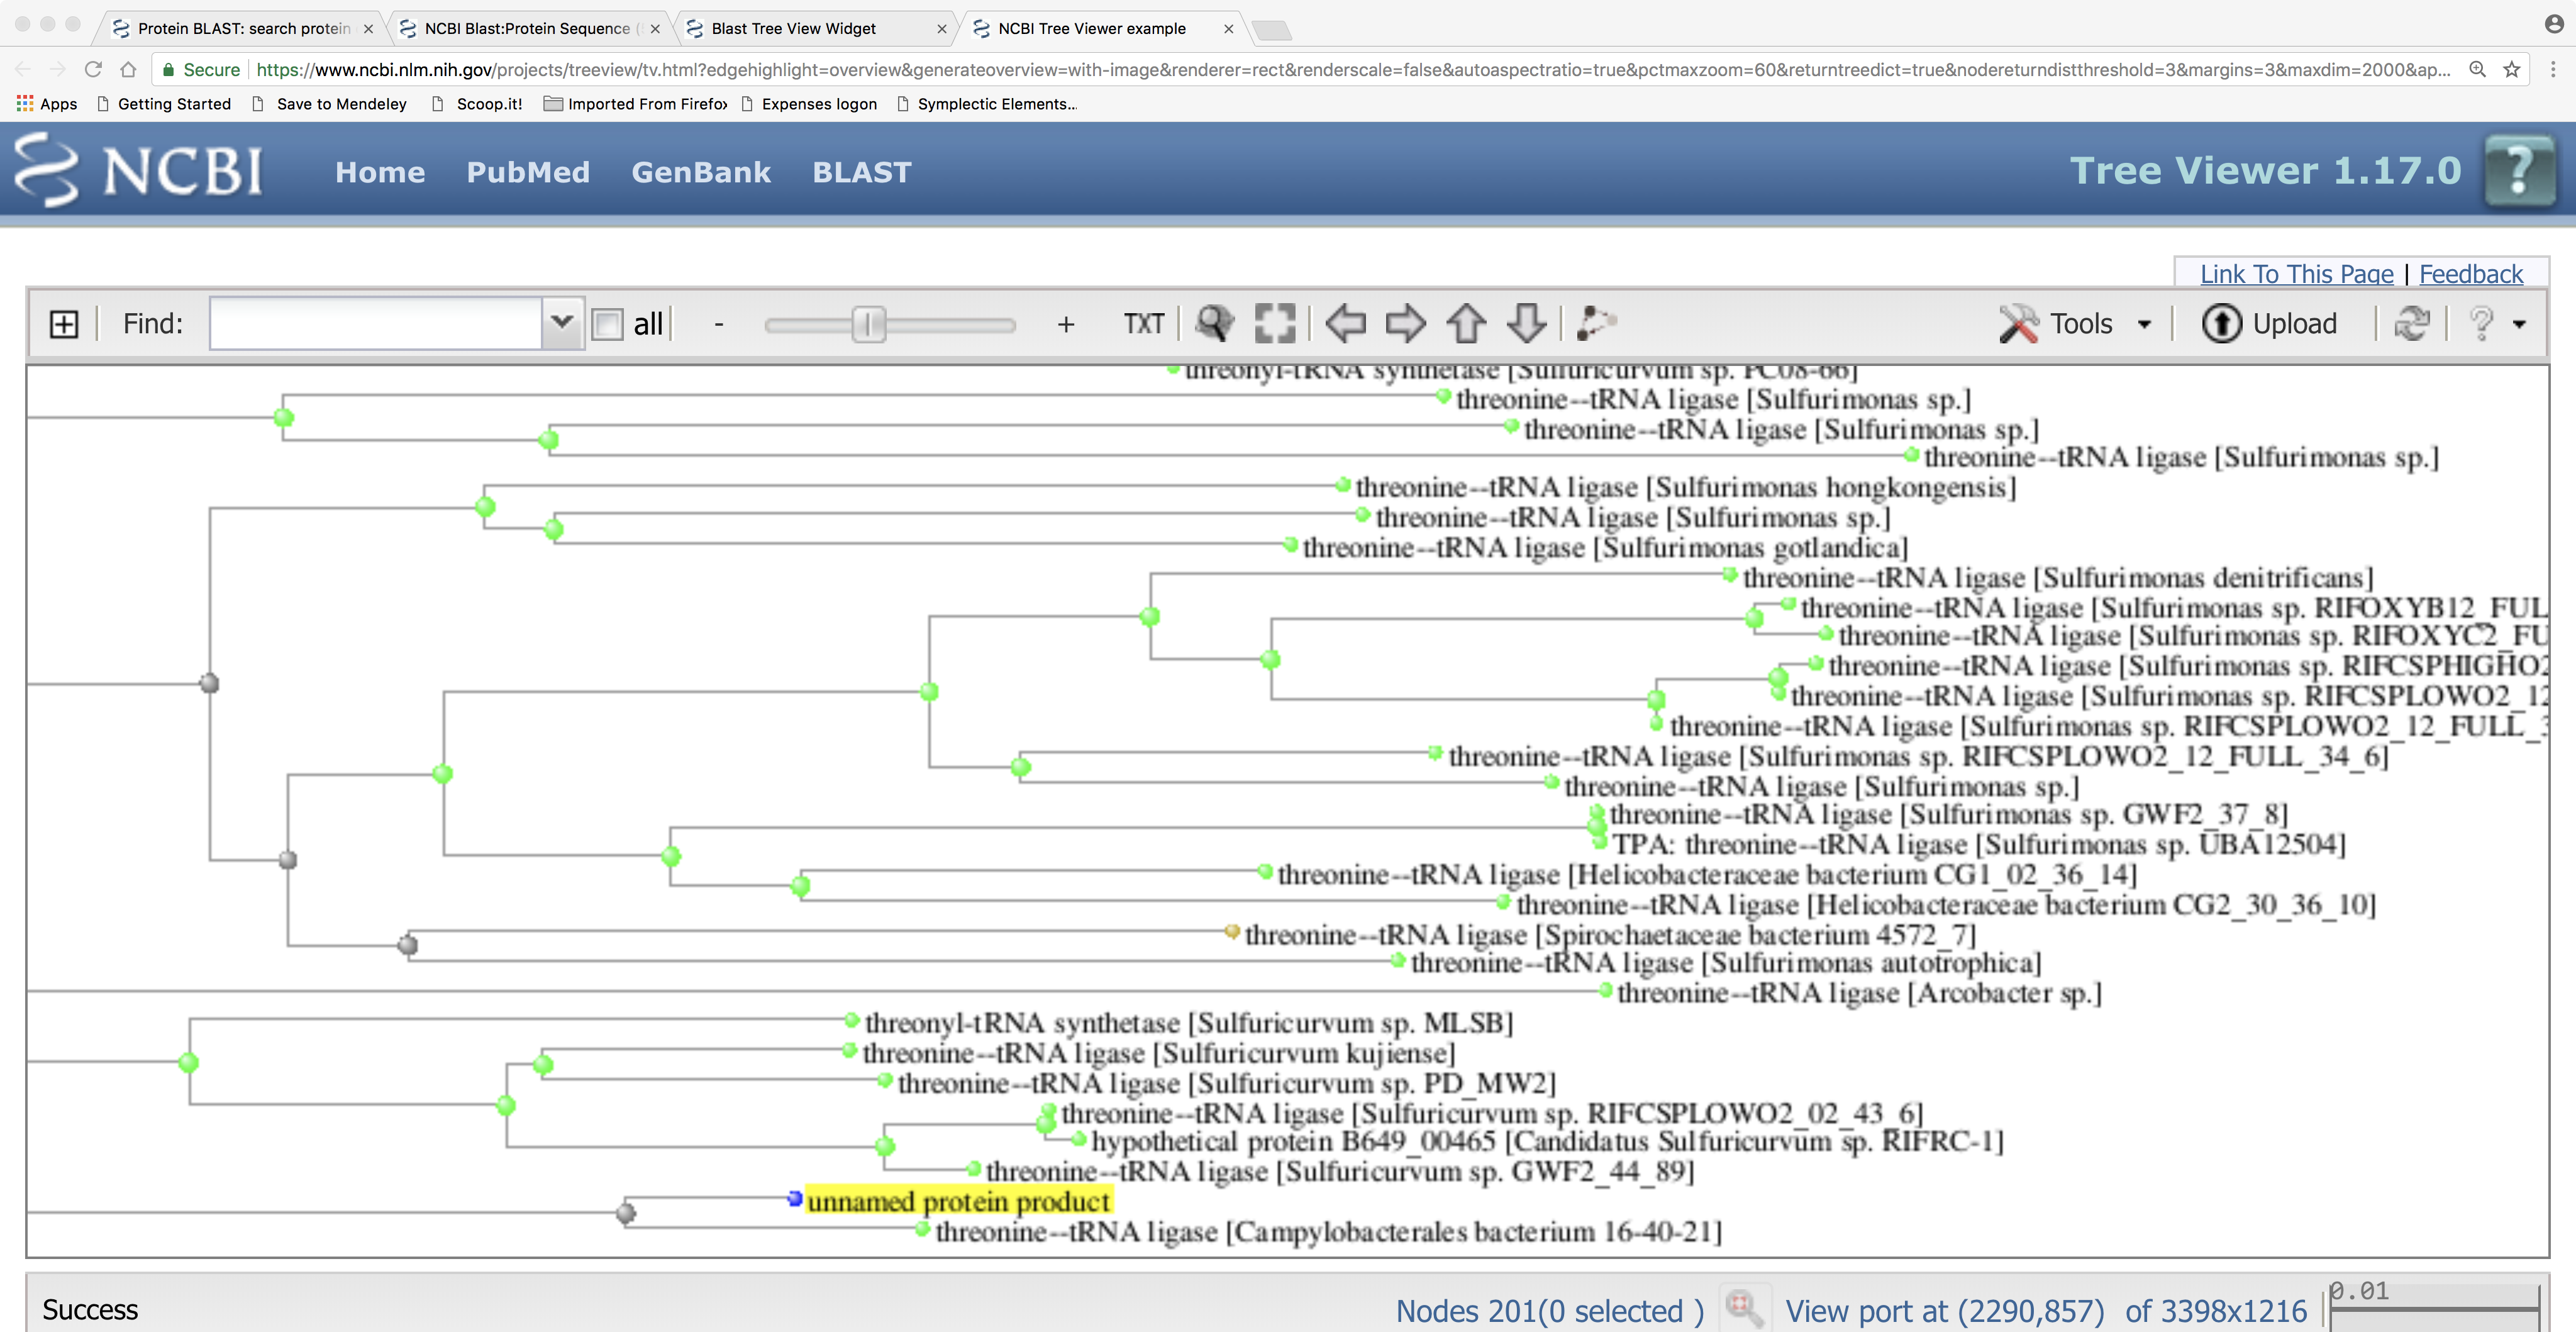
Here is the tree showing the relationships between our query protein sequence and the BLASTP hits. Note that our query protein seems to cluster with a protein from the epsilon-proteobacterial order Campylobacterales and, more distantly, to other epsilon-proteobacteria such as Sulfuricurvum spp.; this strongly suggests that this metagenomics sequence originates from a bacterium of that group. Can you think of a way to investigate or check this further, using BLAST searches?
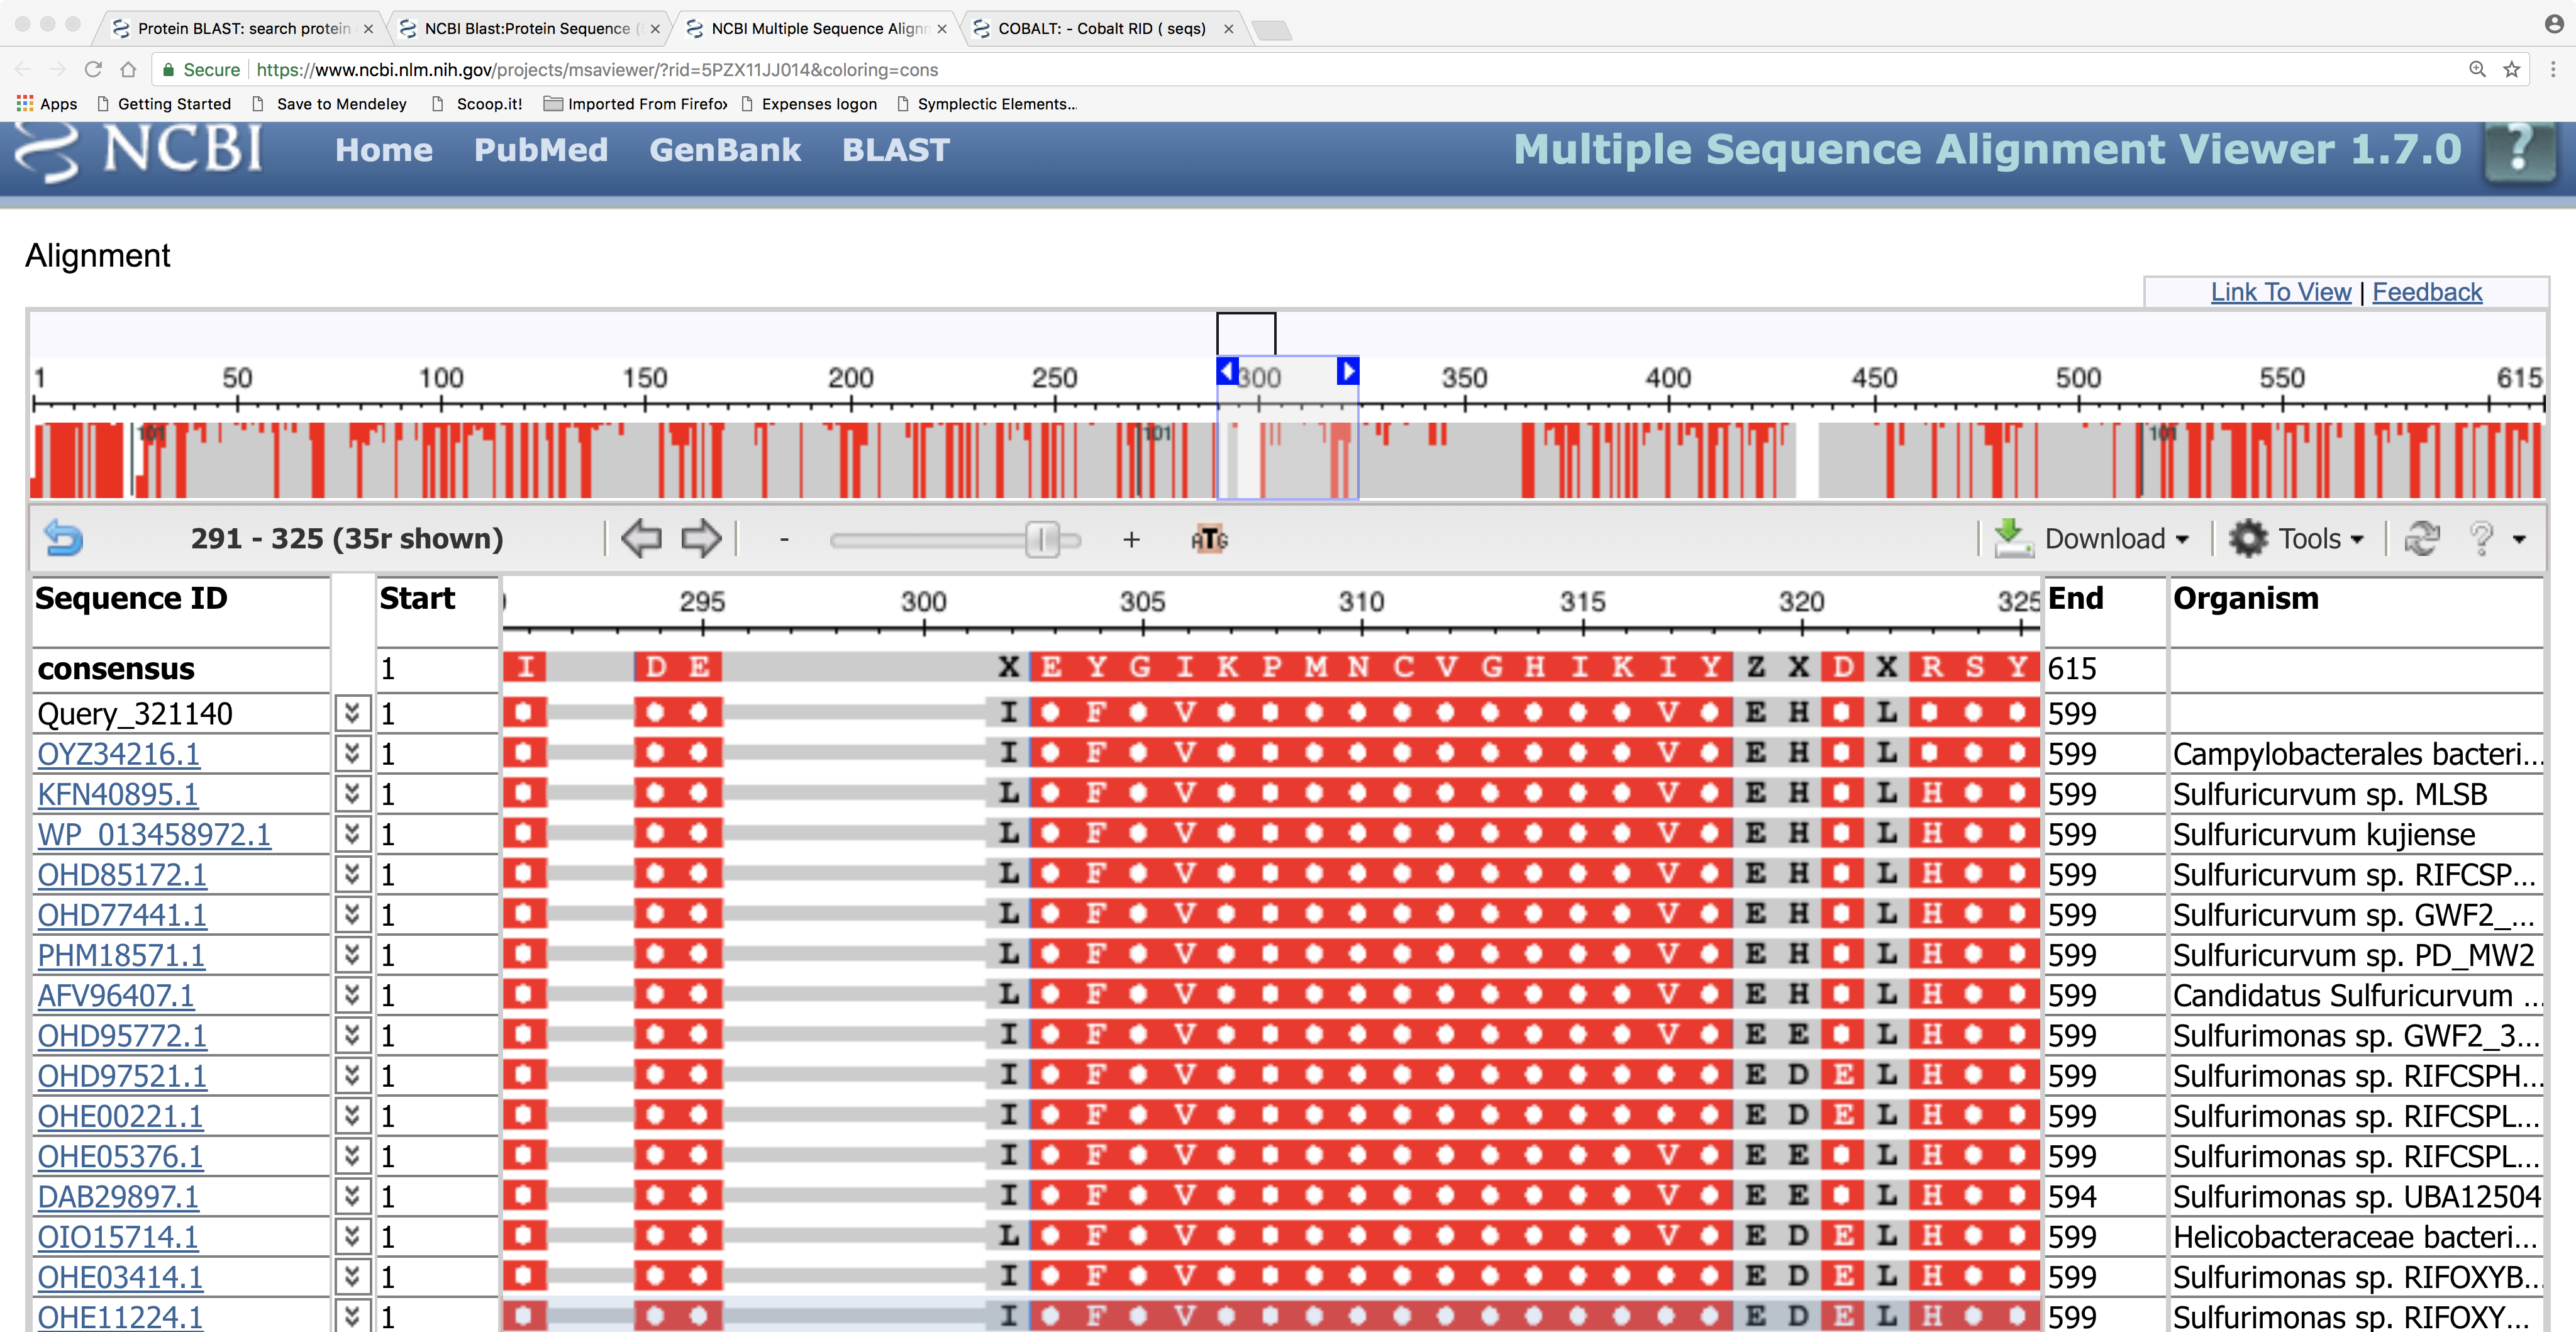
Here we can see the details of the amino-acid sequence alignment of our query sequence against the BLASTP hits:
4.2 Predicting protein function with the STRING database (http://string.embl.de/)
Many microbial genomics databases are available that, rather than just presenting raw data, have some “added value”, such as tools for predicting the function of genes. One such example is the STRING database.
This database aims to provide clues about the functions of poorly characterised genes by identifying associations with genes of better-understood function. These associations can be physical proximity of genes in the genome or they can be correlations in patterns of presence/absence. Other associations are gleaned from mining text of published papers or looking at correlation in transcriptomics expression data. In any case, the detection of such associations depends on the interrogation of a large number of genome sequences (or transciptome and/or textual data). Let’s try it out using as an example the E. coli otsA gene, involved in trehalose biosynthesis; this example is borrowed from a previously published genomics tutorial (Strong et al., 2004). You should also try it with your newly discovered gene/protein.
First, enter the terms into the search box and press the “Search” button:
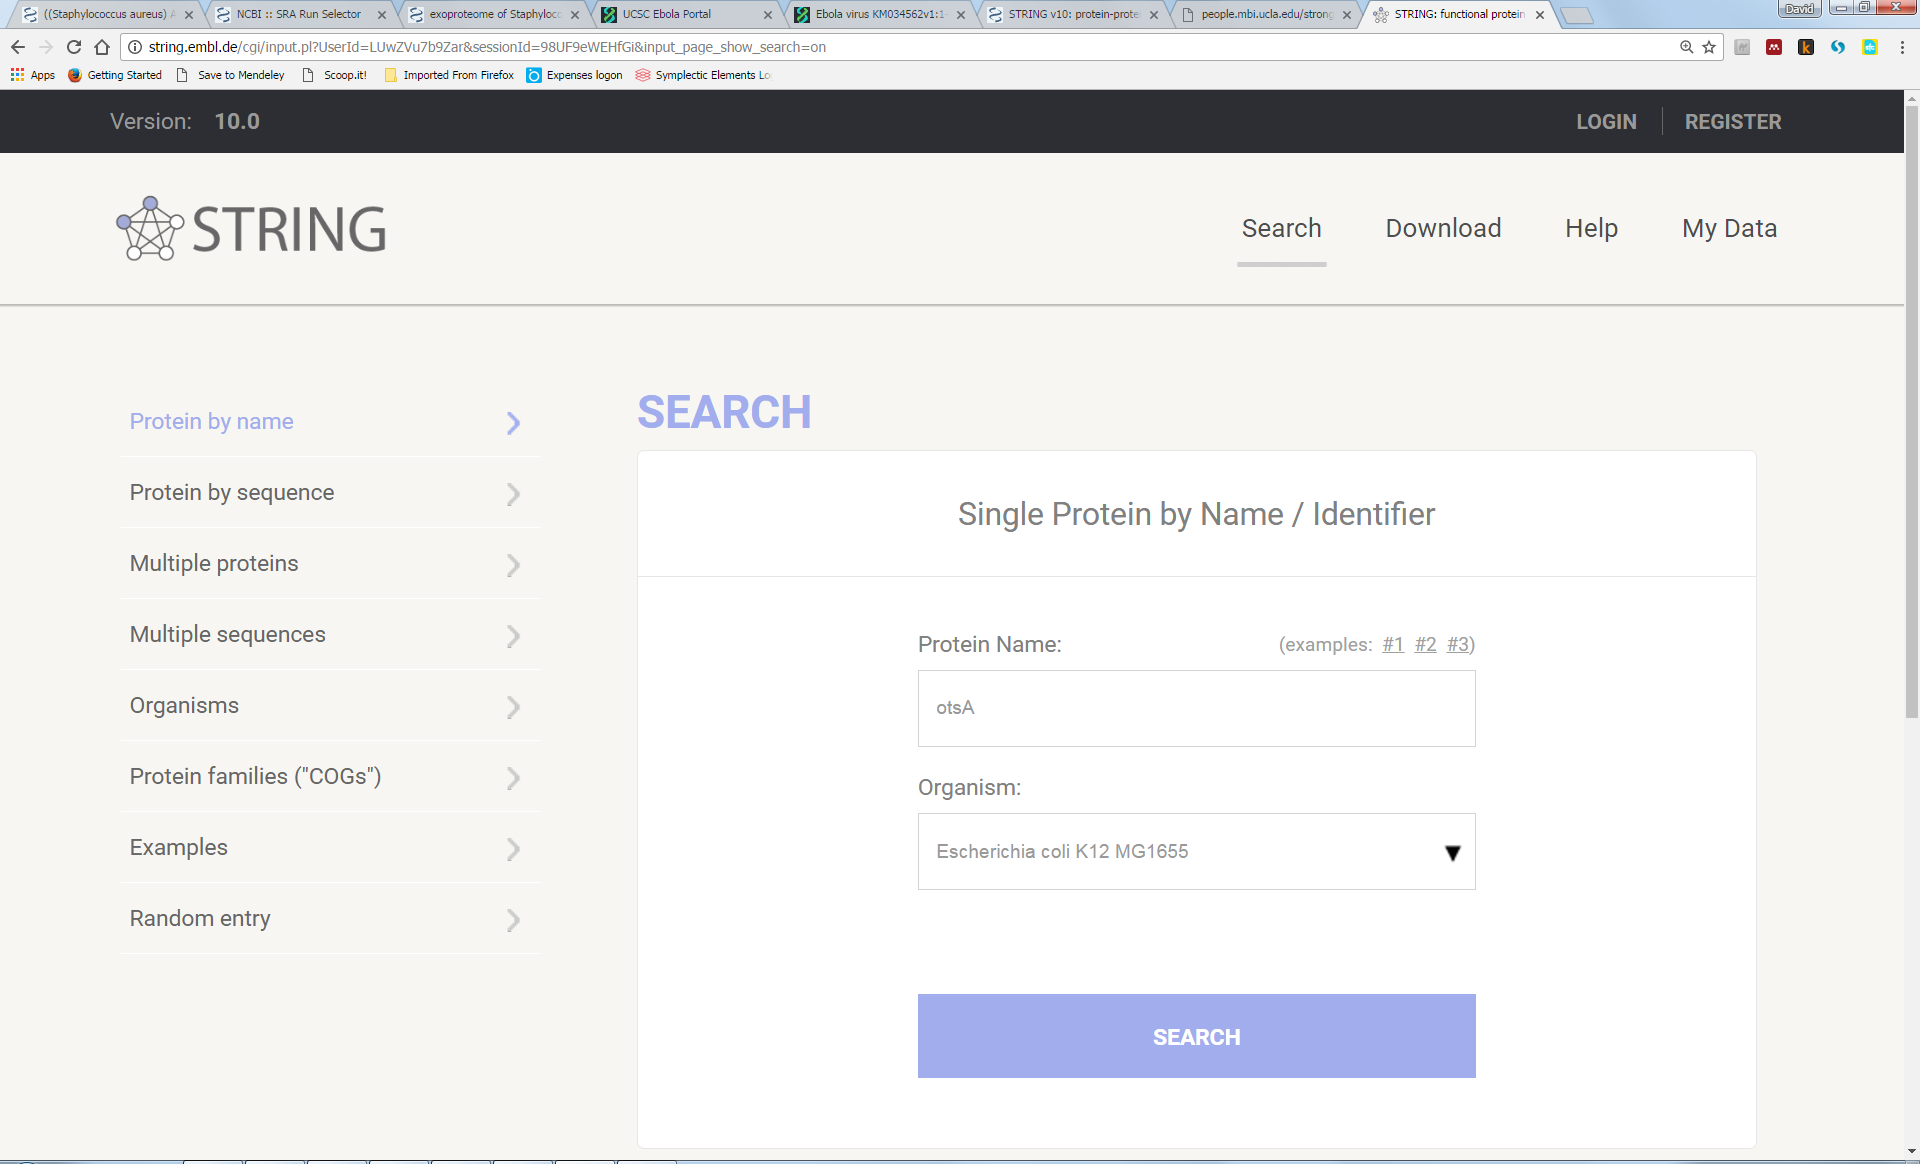
(Note that you can also search “by sequence” rather than “by name”; therefore, you could paste-in the sequence of your newly discovered protein.)
This yields a network of interactions, inferred from genome sequence data, between the otsA gene and some others:
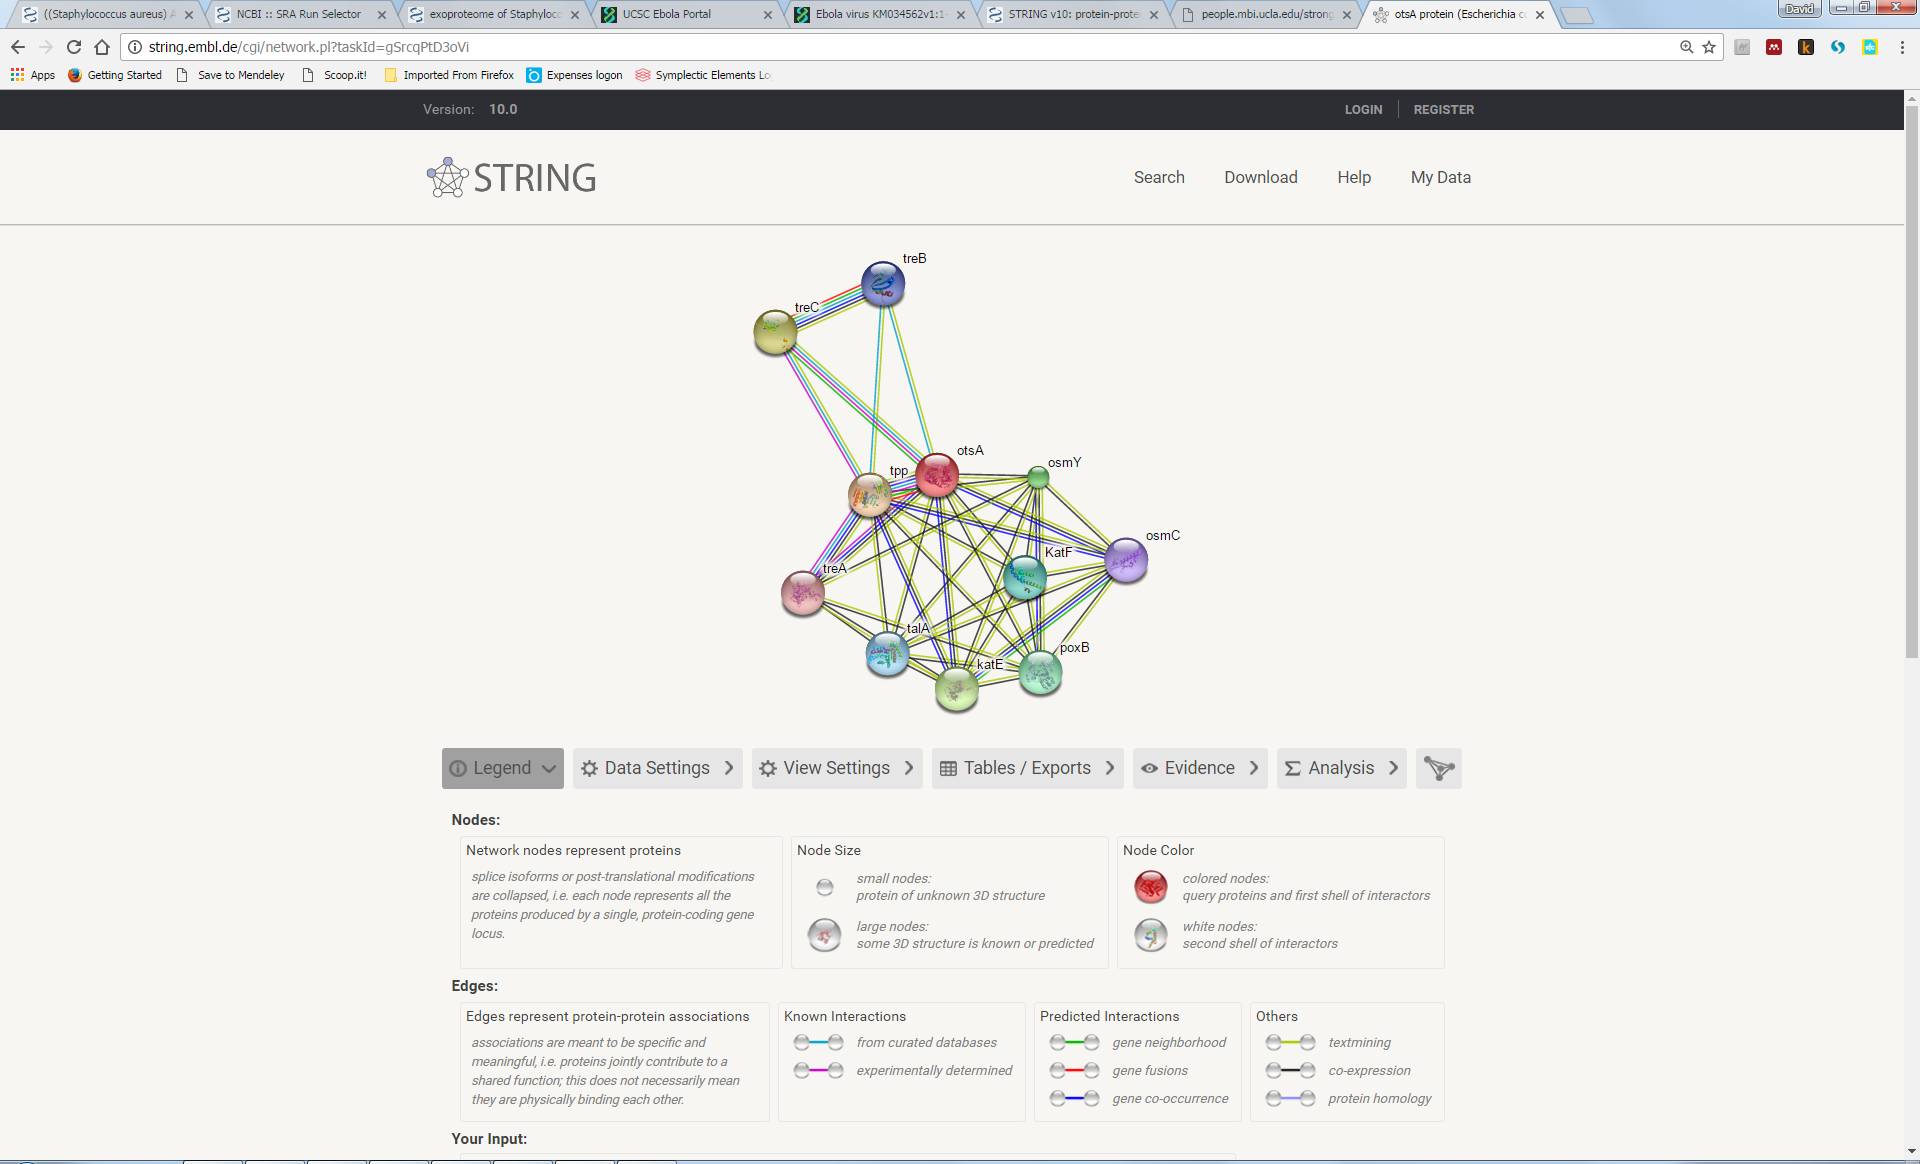
Note that this network is represented as a ‘graph’ consisting of nodes (a.k.a. ‘vertices’) and connections (‘edges’). We will encounter graphs again in other contexts of bioinformatics, especially in de-novo sequence assembly later in the course.
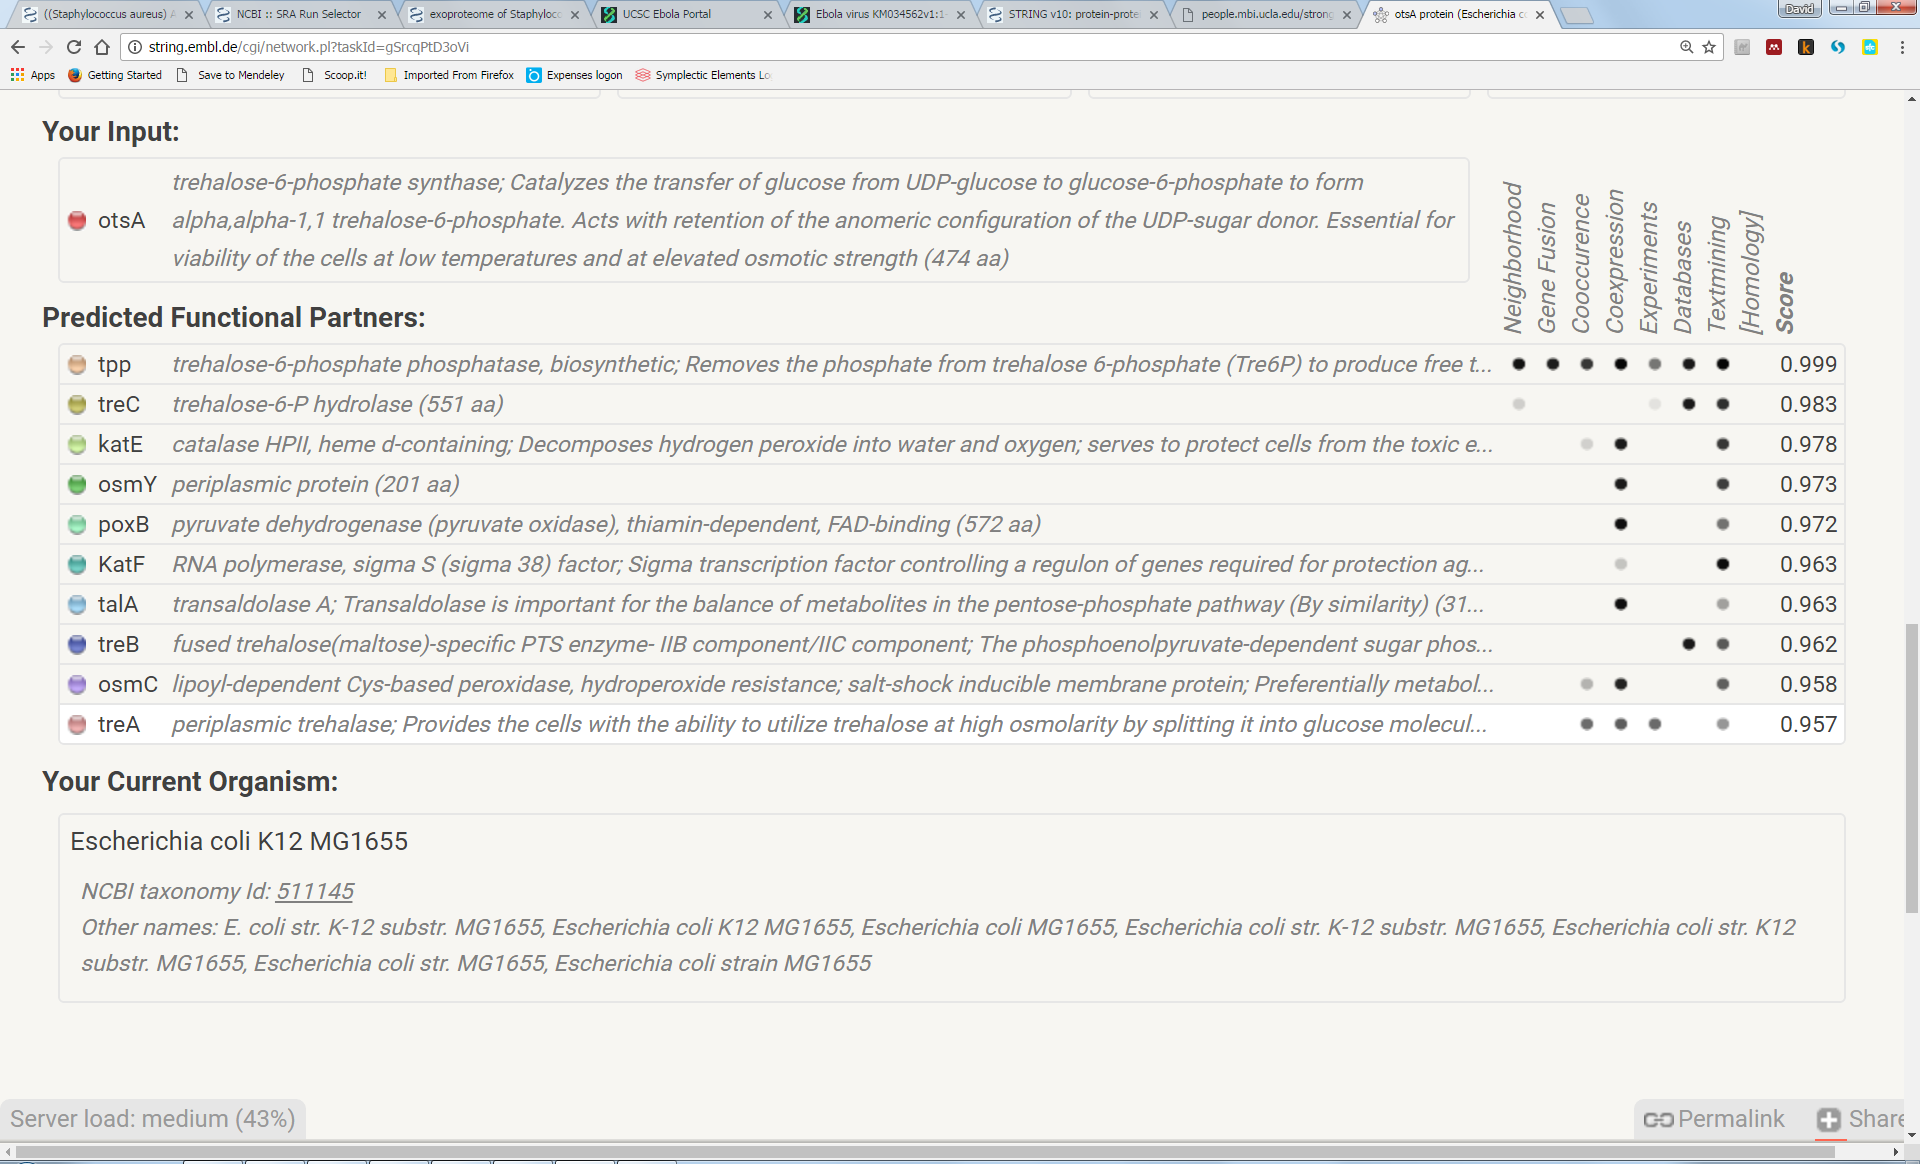
Note that some of these genes, associated via genome sequence data, also happen to have related functions (trehalose biosynthesis):
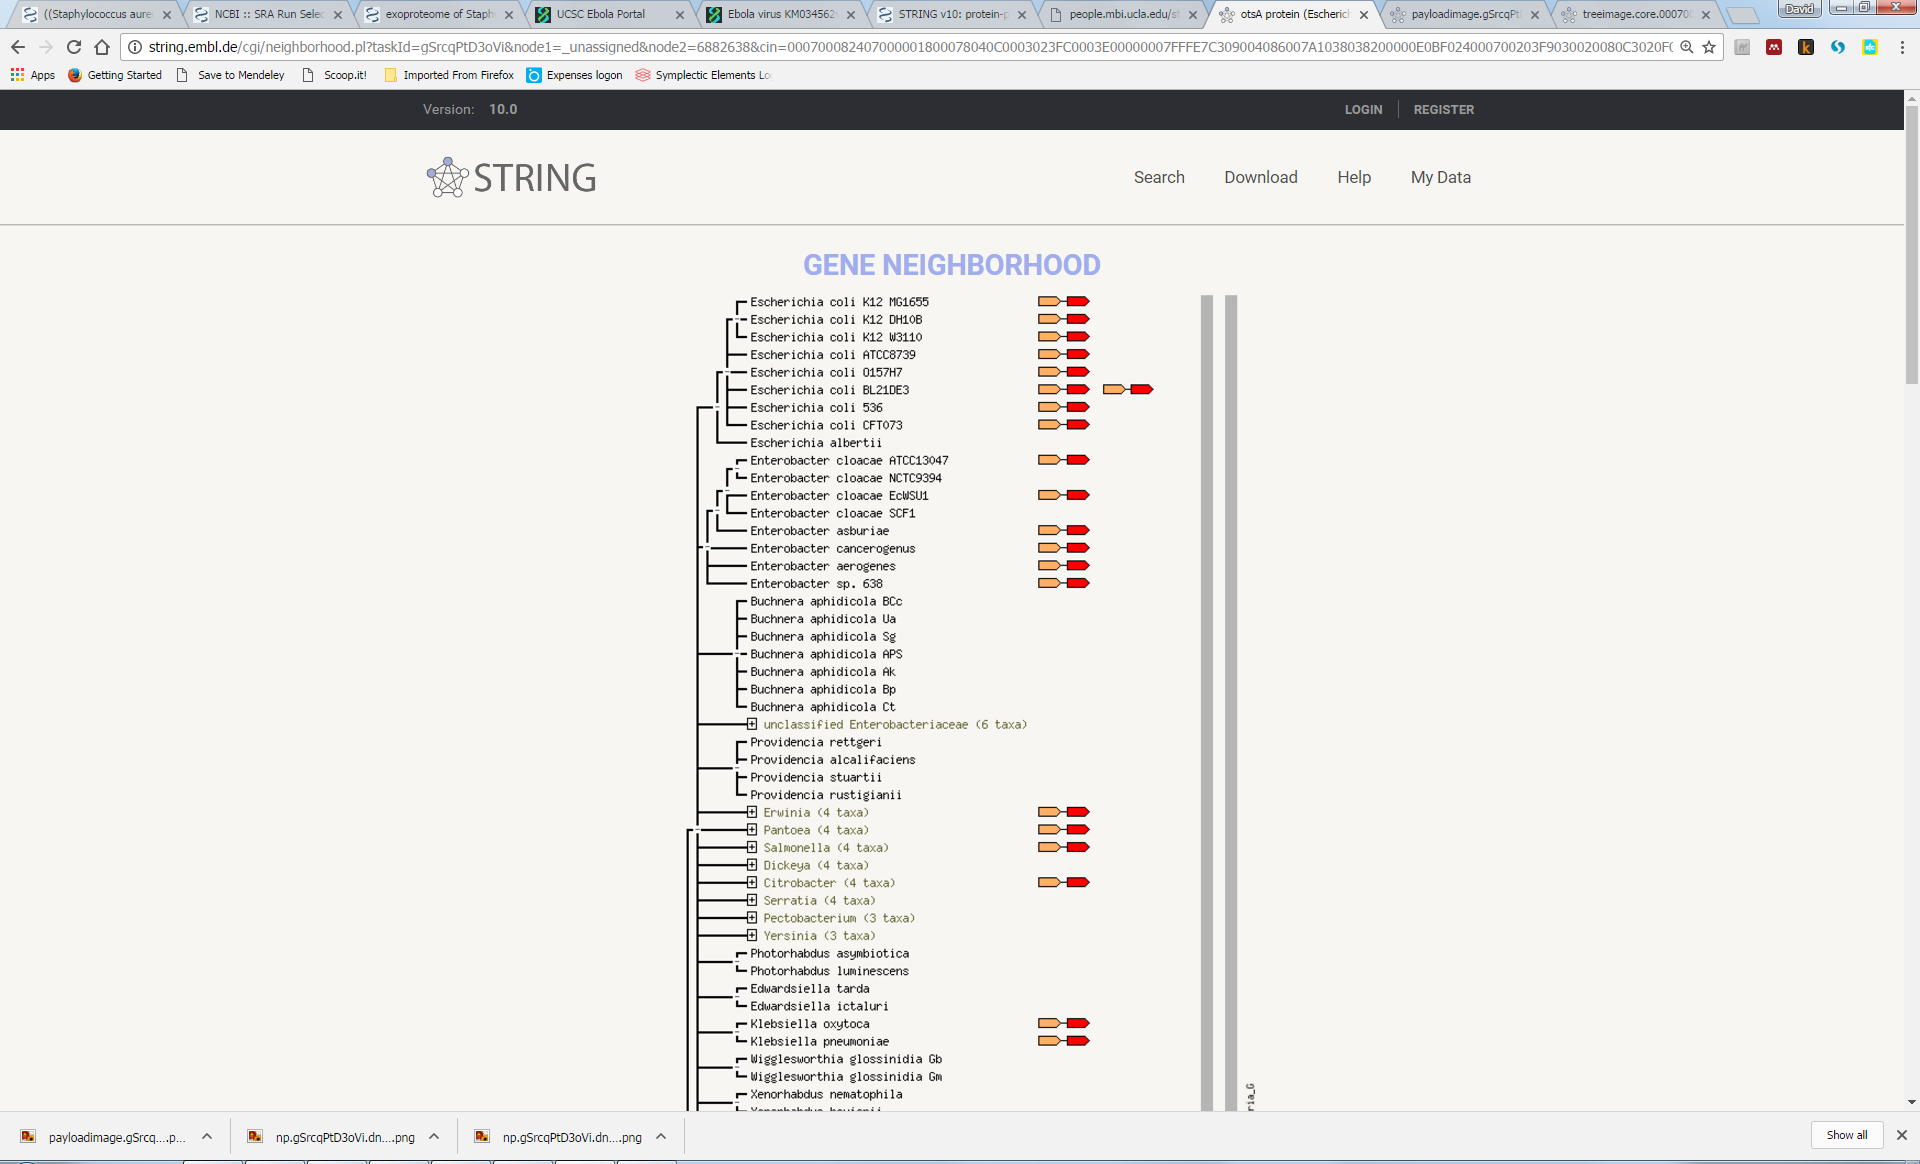
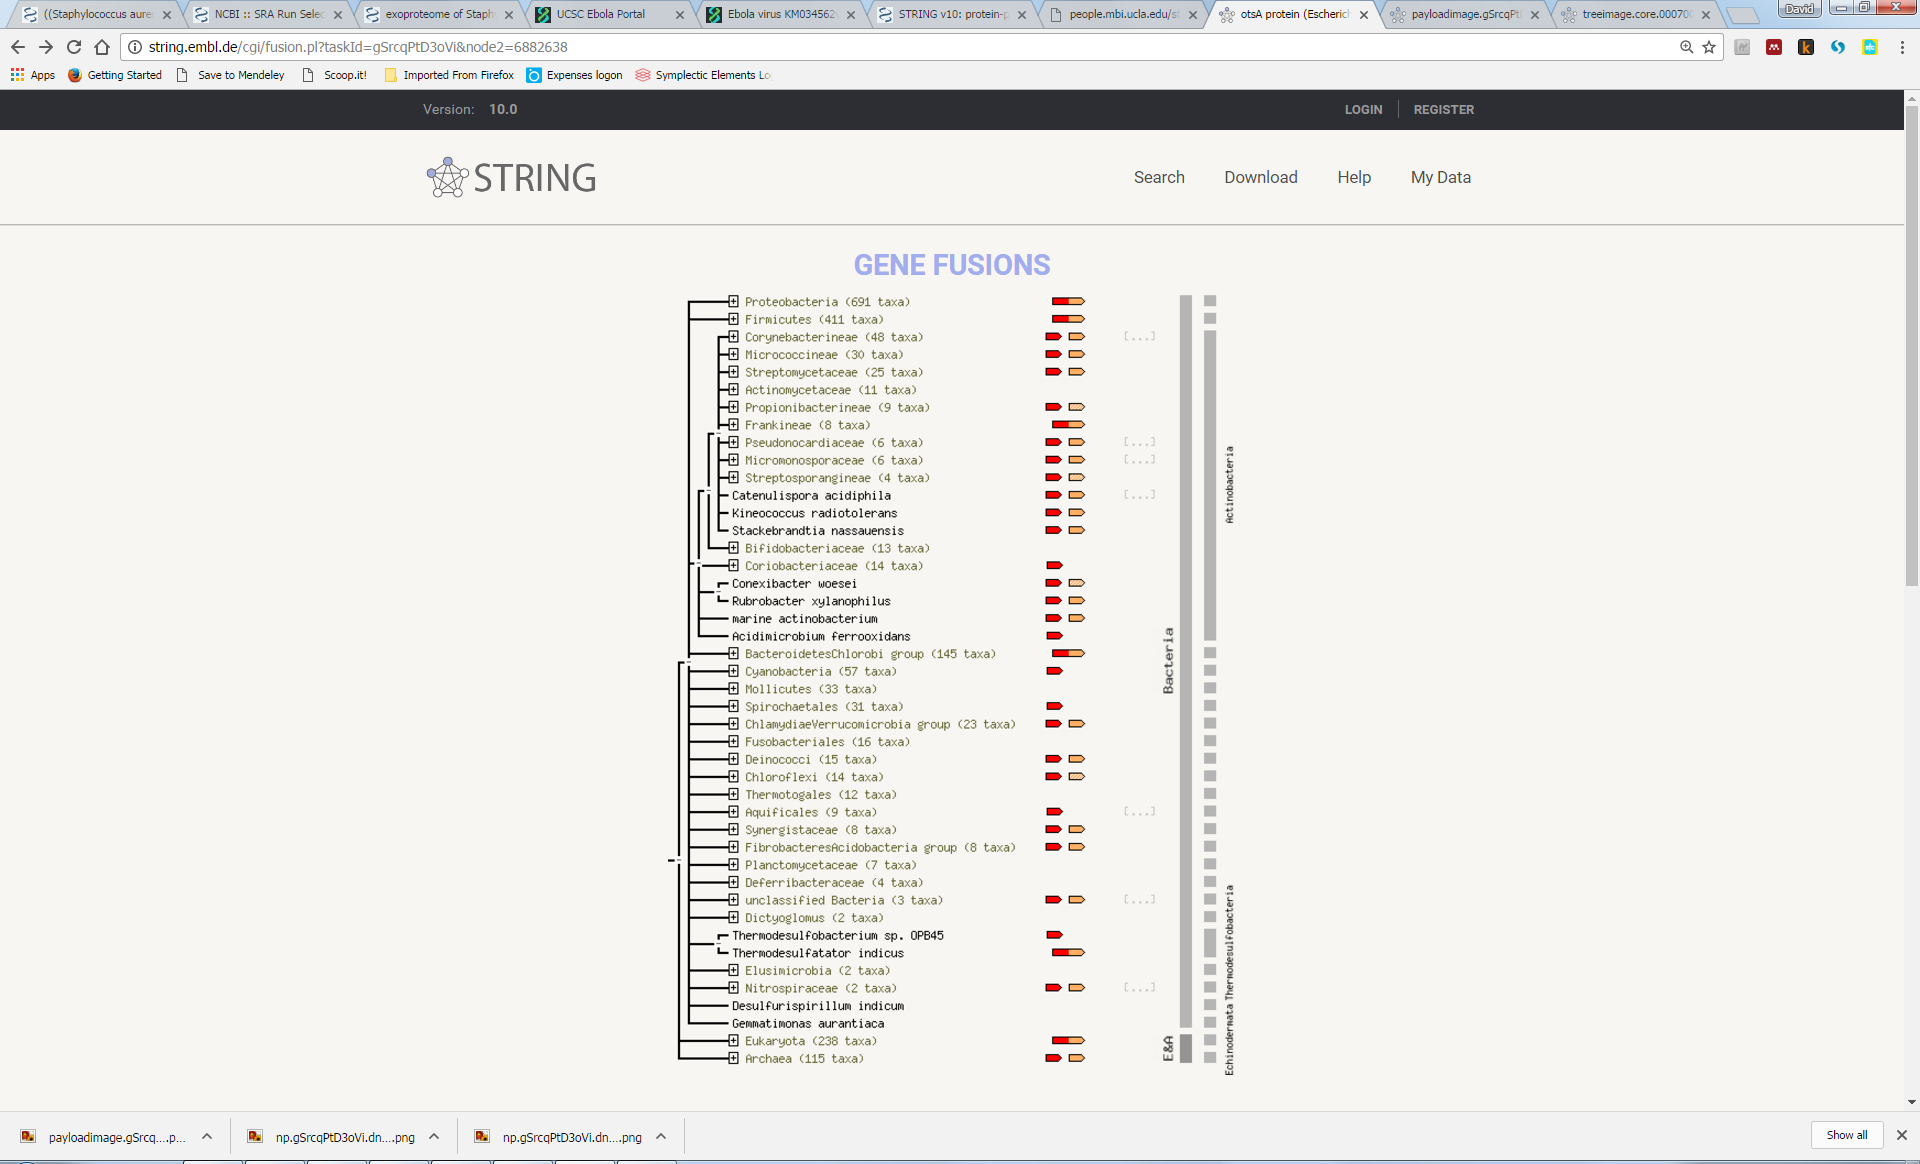
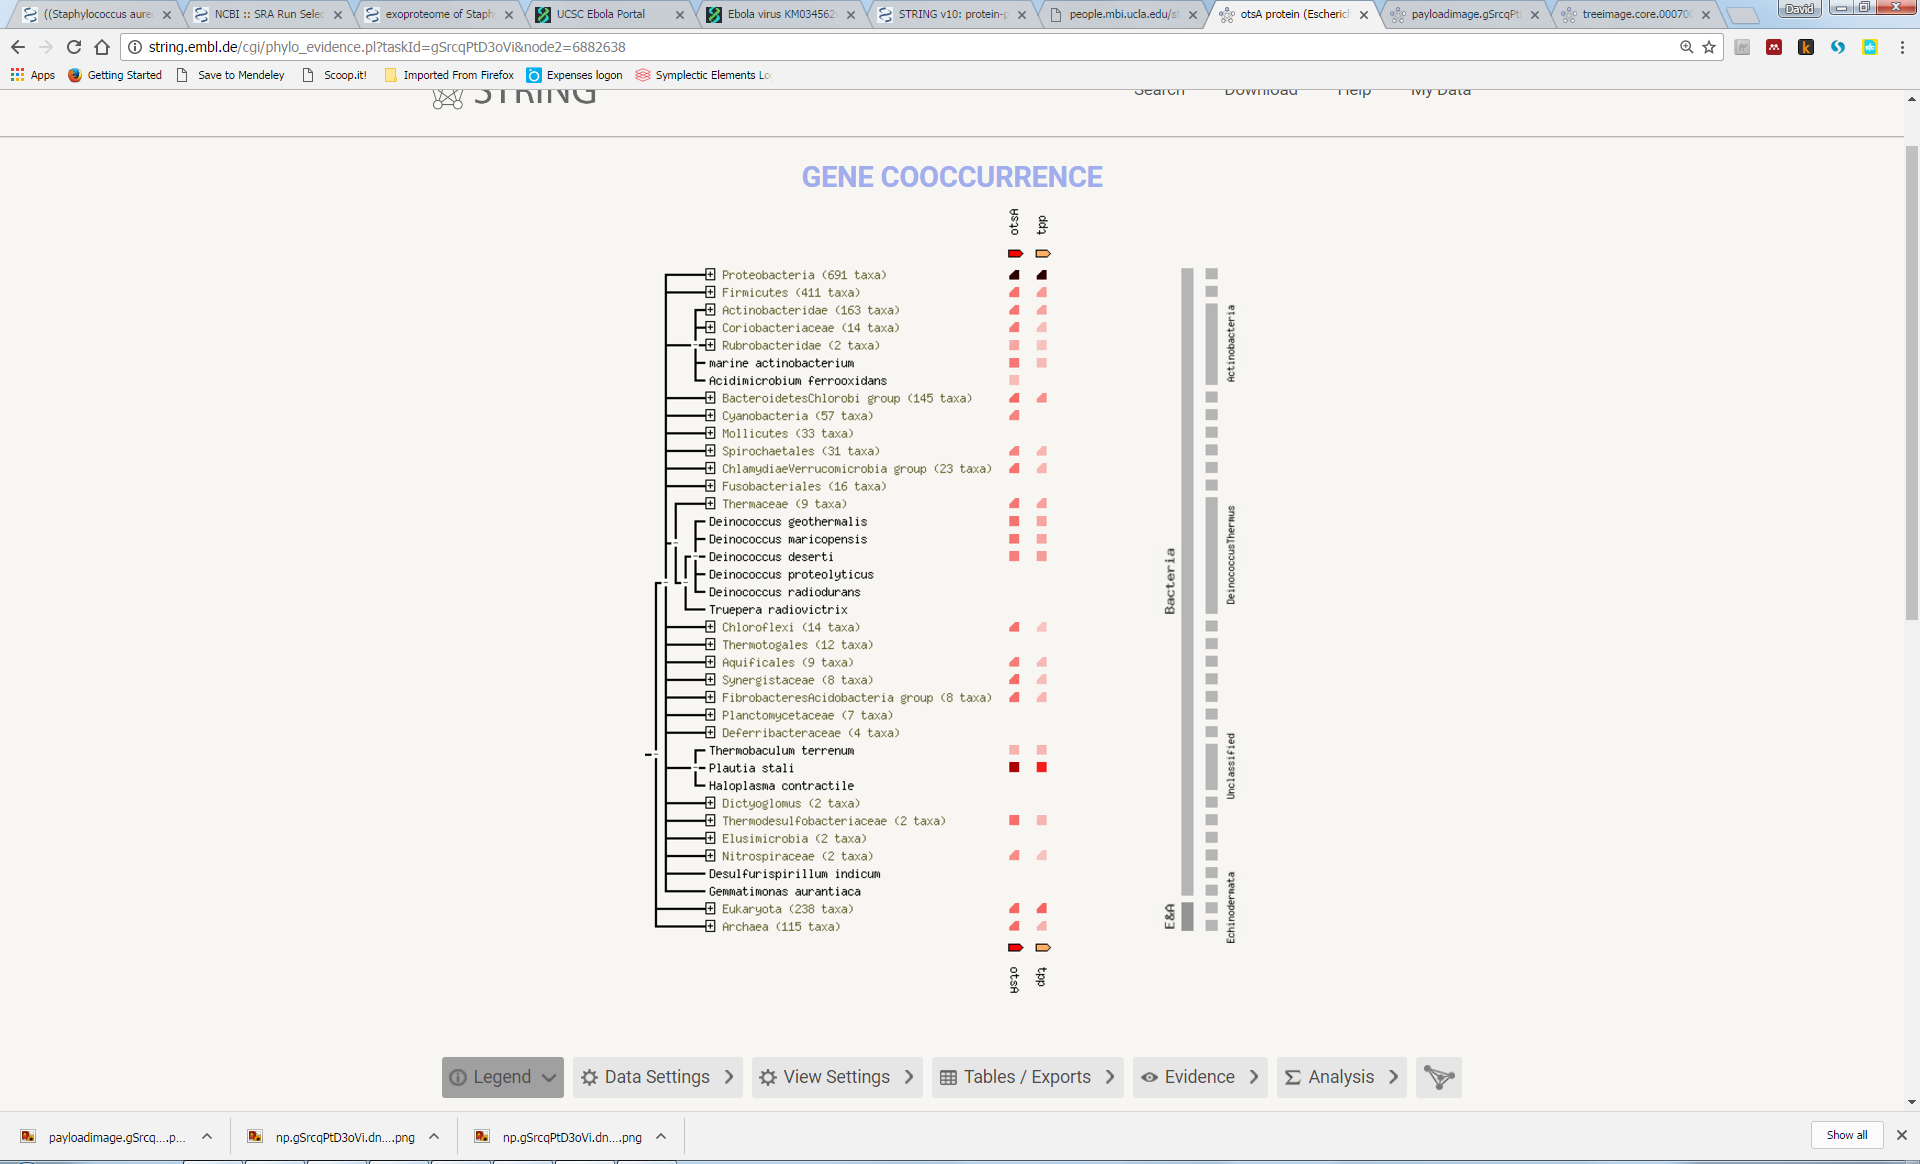
Try to understand the meaning of the realtionships that link the genes in this network. Here we can see that otsA and tpp are adjacent to each other in many genomes, suggesting a functional link (“Neighbourhood”). In a few genomes, the two proteins are actually fused into a single protein (“Gene Fusion”). Furthemore, most genomes either contain both genes or neither gene (“Cooccurrence”):
Now, explore some of the other associations, some of which are less obvious, such as the link with katF or osmY.
:-)