Chapter 2 Mexico
2.1 State-level overview
According to Mexico’s 2020 census, nearly 7.2 million individuals, or 6% of the country’s population aged 5 years and older, speak an indigenous language. Figure 2.1 depicts the population numbers in each of Mexico’s 32 states. Click on the map to see that state name, total population, indigenous language population, and proportion of the state’s population that speaks an indigenous language.
Figure 2.1: Population charactersitics by state: total population, population that speaks an indigenous language and ratio of the two
Inhabitants that speak an indigenous language are heavily concentrated in the south of Mexico. For example, the state of Chiapas has the most indigenous language speakers, with nearly 1.4 million individuals, which comprise slightly over a quarter of the state’s population (28%). Meanwhile, Oaxaca’s indigenous language speakers represent nearly a third of its population (32%) though there are slightly fewer individuals than in Chiapas (1.2 million). Three other states have more than half a million indigenous language speakers (Veracruz, Puebla and Yucatán), comprising between 9-24% of each state’s respective populations. At the other end of the specturm, there are seven states, largely located in the north of the country, with fewer than one percent of their population that speak an indigenous language.
2.2 Indigenous Language Communities by State
Most of indigenous language speakers live in indigenous population clusters. That is, two thirds of indigenous language speakers live in communities where 40% or more of the inhabitants also speak an indigenous language. These communities are are often the poorest, most marginalized in Mexico, and as such their distribution across the country is relevant.
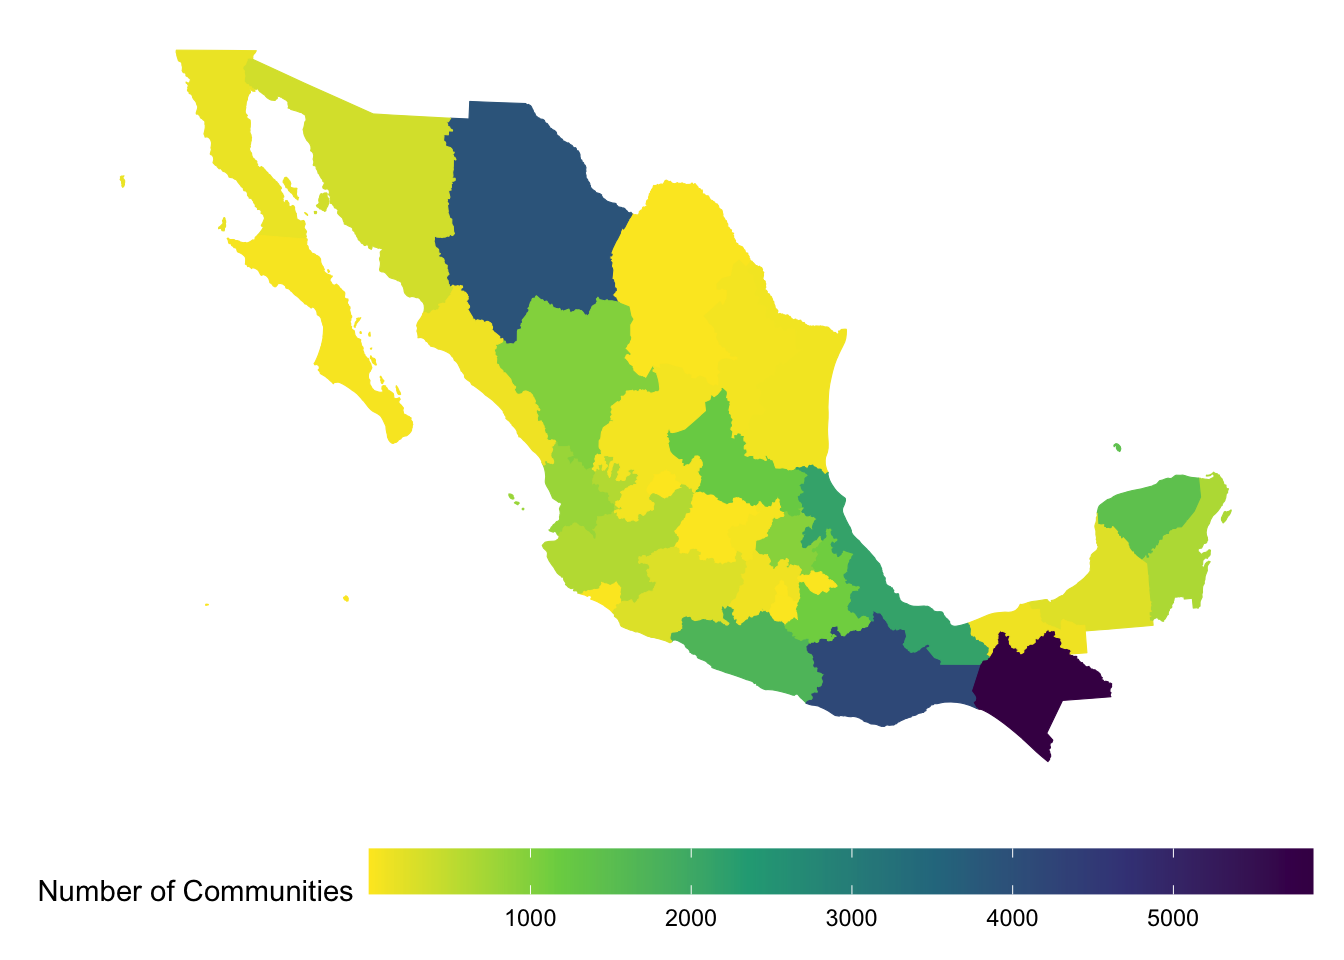
According to the 2020 census, there are 27,394 communities in Mexico in which 40% or more of the inhabitants speak an indigenous language. Nearly 80% of these indigenous communities are located in eight states: Chiapas, Oaxaca, Chihuahua, Verzcruz, Guerrero, Yucatán, San Luis Potosí and Puebla. Chiapas and Oaxaca alone account for just over a third of all the indigenous language communities in the country. Figure 2.2 depicts the distribution of these indigenous language communities across Mexico’s 32 states.

Figure 2.2: Number of communities where 40% or more of inhabitants speak an indigenous language
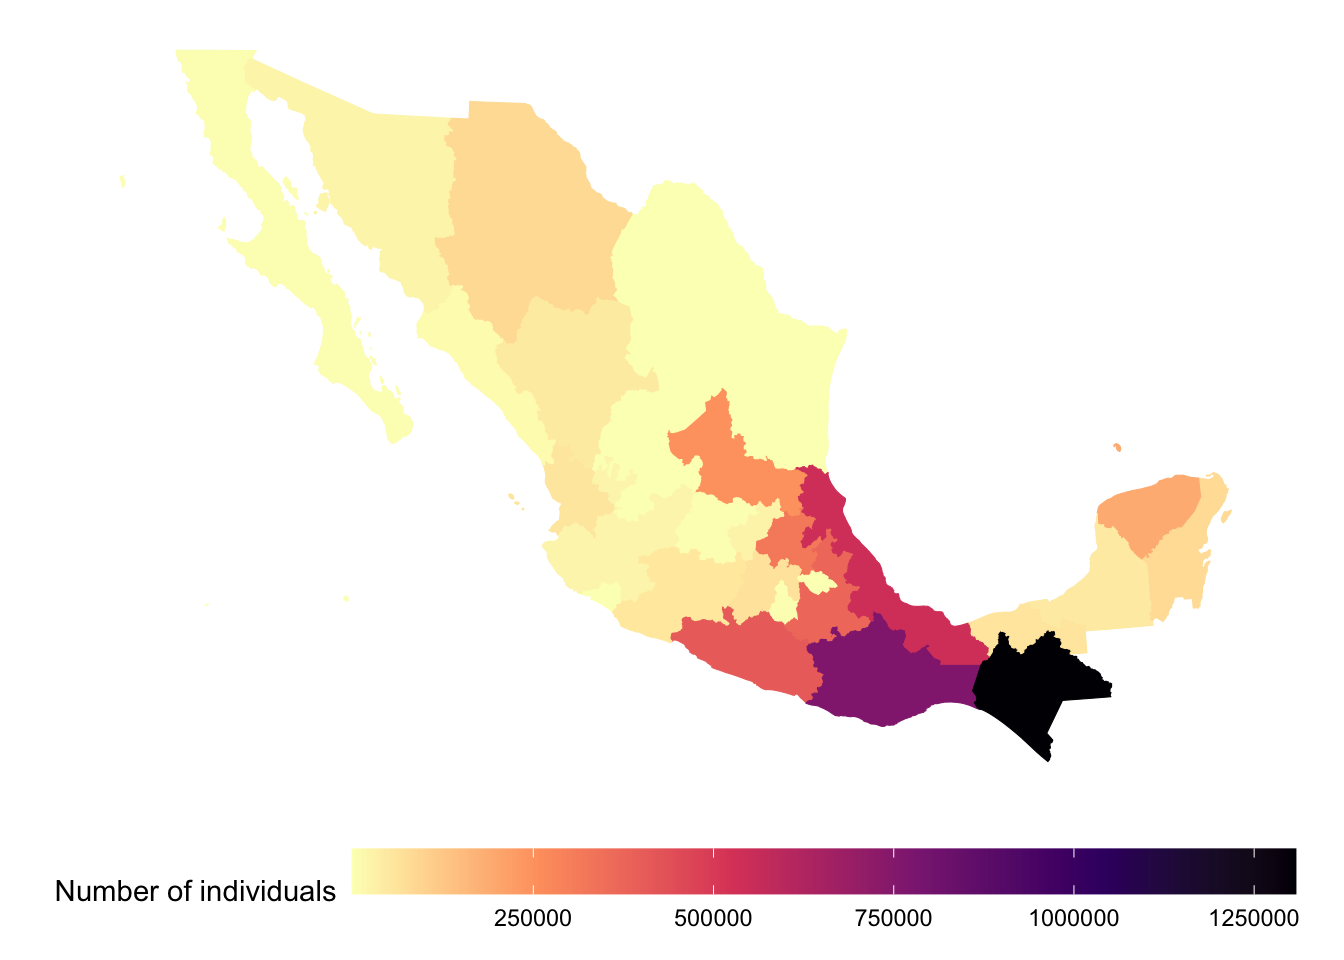
More than 4.7 million individuals live in the indigenous language communities. Figure 2.3 depicts the population numbers. It is worth noting that while Chiapas contains 22% of Mexico’s language communities, it contains 28% of the country’s inhabitants in language communities, suggesting that the size of the language communities in Chiapas are relatively large. For comparison, the next most populous state in terms of language communities is Oaxaca, which contains 15% of language communities and 16% of the country’s inhabitants in language communities. Likewise, Chihuahua has the third highest number of language communities or 14% of the country’s total, but only 2% of the country’s inhabitants in such communities.

Figure 2.3: Number of individuals living in communities where 40% or more of inhabitants speak an indigenous language
Figure 2.4 depicts the settings in which the indigenous language is used in the communities. Click on the various states to see the state name, number of language communities, total population in language communities and settings where the indigenous languages are spoken in the communities. In these language communities, the indigenous language is most often used in the home and least often used in schools. Specifically, an average of 76% of inhabitants in the language communities speak an indigenous language at home while an average of 52% speak the indigenous language at school. For the other settings, the portion of the community inhabitants on average that speak the language are: 71% among neighbors, 61% during festivities, 56% for commerce, and 53% at church.
Figure 2.4: The proportion of indigenous language community inhabitants who use the indigenous language in the following settings: at home, among neighbors, for commerce, for festivities, at church, and at school
2.3 Municipal detail
Available 2020 census data also details each municipality’s population of indigenous language speakers as well as the population that is not literate.
2.3.1 Literacy
In 2020, just under 8.2 million individuals in Mexico, or 7% of the population, are illiterate. Zoom in and click on municipalities in Figure 2.5 to explore the illiteracy rate (the proportion of the total municipal population that is illiterate), as well as the number of inhabitants that are illiterate. Note that the highest illiteracy rates (up to 52%) are generally in the poorest and most rural municipalities while the largest numbers of illiterate inhabitants (illiterate population) can be found in urban migration hubs, such as Acapulco, Acapulco; Puebla, Puebla; Juárez, Chihuahua; and parts of Mexico City.
Figure 2.5: Illiteracy rates and illiterate population numbers by municipality (illiteracy means those who cannot read or write a message)
Note that the literacy data only considers the population aged 5 years and older. Additionally, a few points about the way the literacy data is collected in the 2020 census are worth mentioning. The exact wording of the literacy question is, “Does (NAME) know how to read and write a message?” (“¿(NOMBRE) sabe leer y escribir un recado?”). That is, the question does not specify the language of interest, which leaves room for uncertainty and error. For example, an individual who is literate in a language other than Spanish but not literate in Spanish may be uncertain about how to answer the question. Additionally, the question relies on self-reported literacy, which also introduces uncertainty and possible error. More objective literacy evaluations will often require respondents read a short, pre-determined message and the surveyor who then records the respondent’s literacy skill based on the message. Finally, the census respondent may not know the literacy level of the household member for whom they are responding, which would also introduce error. As such, the census data records unspecified literacy for just over 300,000 individuals.
2.3.2 Indigenous languages
Table 2.6 details the number of speakers and the languages spoken by Mexico’s 7.2 million indigenous language speakers. There are 71 listed languages (note that one category is “Other indigenous languages of the Americas”). Five languages have more than half a million speakers: Náhuatl has the most speakers with 1.6 million individuals, followed by Maya (768,379 speakers), Tseltal (559,262 speakers), Tsotsil (521,669 speakers), and Mixteco (511,717 speakers). A total of 16 languages have over 100,000 speakers while 21 languages have fewer than 1,000 speakers.
Figure 2.6: Indigenous languages of Mexico and their speakers
Zoom in and click on municipalities in Figure 2.7 to explore the number and proportion of municipal inhabitants who speak an indigenous language. This municipal maps indicates that the indigenous languages show much stronger clustering than what is suggested by the state map. That is, most of the country’s municipalities have almost no indigenous language speakers, while pockets of languages are particularly concentrated in certain parts of certain states. Municipalities with the highest number of indigenous language speakers are found in the state of Chiapas while Oaxaca sees a large concentration of the country’s municipalities with the highest proportion of inhabitants who are indigenous language speakers.
Figure 2.7: Number and Proportion of municipal inhabitants that speak an indigenous language
Figure 2.8 maps the distribution across Mexico of each of the 71 indigenous languages.
Better if arrange language options in map below in alphabetical order instead of ranked by most to least speakers?