Chapter 4 Water Temperature Loggers
4.1 Introduction
In order to supplement aerial thermal infrared imagery and cold-feature ground truthing data, we deployed water temperature loggers in the lower reach of each study stream to collect continuous time series of water temperature. We used Onset HOBO Temp Pro V2 loggers, deployed and maintained according to standards published in Mauger et al. 2015.
This section executes methods to visualize and perform basic quality checks on continuous temperature loggers deployed in the study streams. All data files (.csv) used in these analyses can be downloaded from this project’s GitHub repository.
4.2 Map
See the Project Map section of this report for locations of water temperature logger sites. The ArcGIS Online layer titled, “Water Temperature Logger Sites” displays these locations.
4.3 Logger Data QA/QC
Data retrieved from the field was subjected to a basic quality assurance process before being incorporated into the analysis dataset. We visually inspected each water temperature time series and excluded data indicative of pre/post deployment or exposure. Figures 4.1 and 4.2 provide a visual exampe of water temperature time series prior to and post quality assurance processes.
Figure 4.1: Example of water temperature time series prior to quality assurance process
Figure 4.2: Example of water temperature time series after quality assurance inspection
4.3.1 Additional data preparation
The following sections describe additional details on data preparation specific to each water temperature logger site.
4.3.1.1 Beaver Creek
Loggers at the Beaver Creek logger site were deployed in early summer 2020. As part of a separate research project, Alaska Center for Conservation Science (University of Alaska Anchorage) established a logger site several hundred meters upstream also in Summer 2020.
We examined if data from the two sites are similar enough to use as a proxy for each other when data observations are missing. Time series from both sites are shown in figure 4.3, and simultaneous values from both sites are presented in figure 4.4.
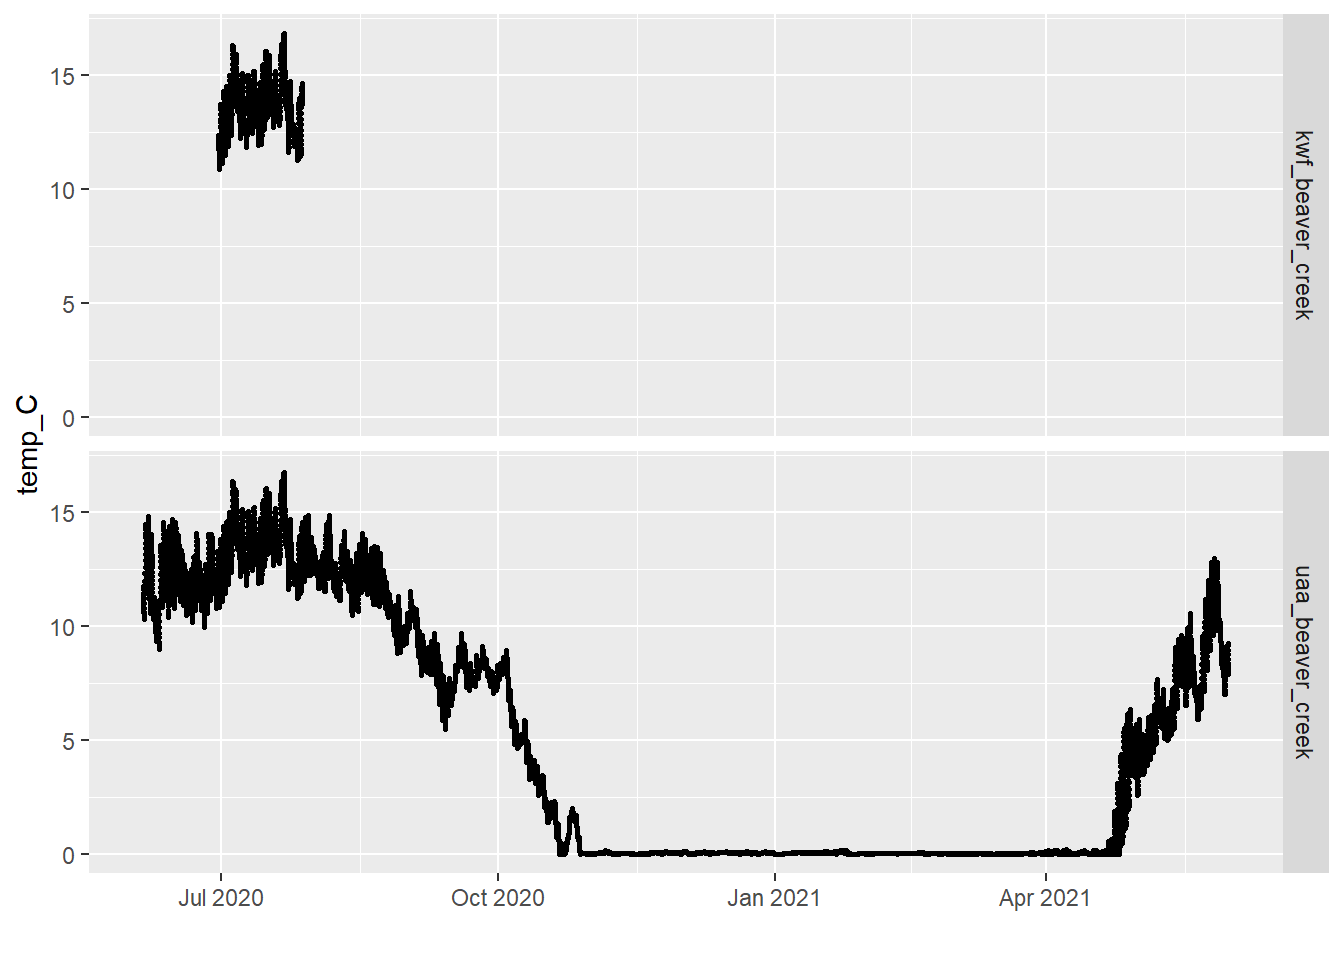
Figure 4.3: Water temperature time series from Lower Beaver Creek at two nearby sites.
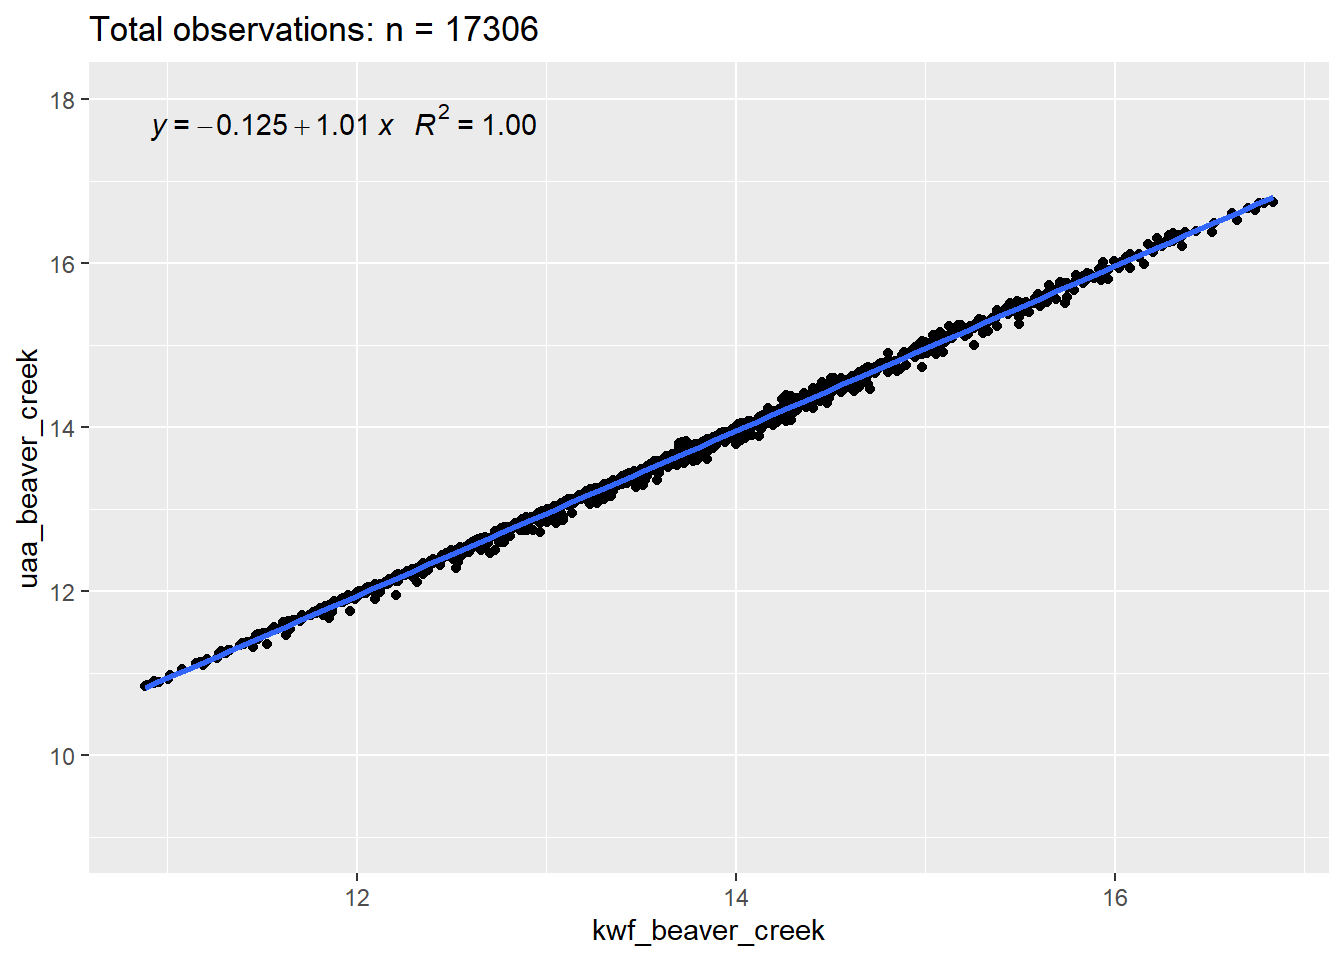
Figure 4.4: Regression of simultaneous water temperature observations from two nearby sites in Beaver Creek.
The average absolute difference in temperature between the two logger sites in Beaver Creek is 0.06 ± 0.05 C (mean ± sd). For most applications, a substitution of data from either of these sites in Lower Beaver Creek will still accurately represent water temperature.
4.3.1.2 Lower Crooked Creek
Lower Crooked Creek has two adjacent water temperature monitoring locations within 20 m of each other. Further details on these two sites are described below, and figure 4.5 shows locations of the two sites.
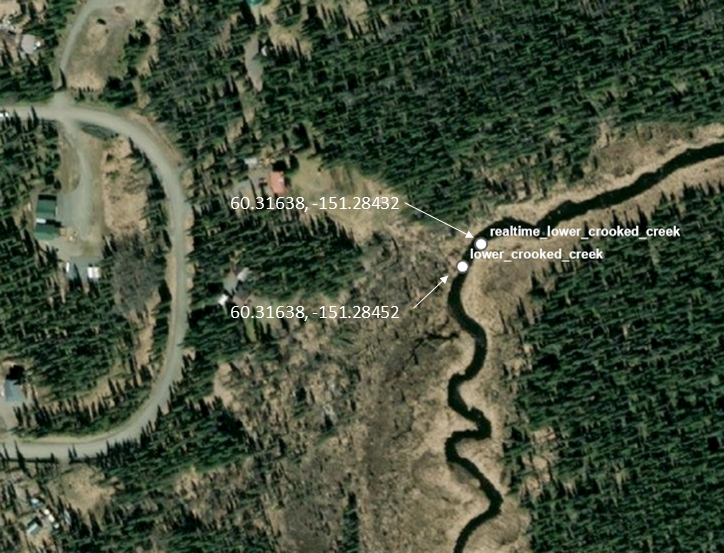
Figure 4.5: Lower Crooked Creek temperature monitoring sites
4.3.1.2.1 Lower Crooked Creek Real-time temperature monitoring site
Cook Inletkeeper maintains a site installed by Beaded Stream that records air and water temperature data in real-time and streams these data live at https://inletkeeper.org/our-work/healthy-habitat/real-time-temperature-sites/crooked-creek/. Water and air temperature data has been recorded and streamed from this site at hourly intervals since summer 2017.
Temperature data from this location can be downloaded as a csv file directly from the above Inletkeeper web link. However, as of 2022-11-18 there is an error with the publicly available csv file. The publicly available csv file has incorrect time stamps after 12/31/2019. Beaded Stream staff is aware of the error, and says the remedy will require an in-person visit to the field. In the mean time, contact Beaded Stream staff to request access to most current data.
The data with correct time stamps from 2017-08-15 though 2021-10-26, obtained directly from the internal Beaded Stream dashboard, is also available for download at this link from GitHub: Download Lower Crooked Creek Realtime Temperature Data.
4.3.1.2.2 Lower Crooked Creek HOBO TempPro V2 logger site
A pair of HOBO Temp Pro V2 loggers are installed at a location 20 m upstream from the real-time temperature logger site. Water temperature is recorded at 15 minute intervals.
During a site visit on 7/28/2021, we discovered that this pair of loggers potentially resided within a small, previously unidentified cold water plume incoming from the river-left bank. (On the ArcGIS Online project map, this feature is identified as “tributary_44.” It was unclear if the local cold water seep was influencing the loggers in way such that they would not represent main channel temperature.
In order to determine if HOBO logger data prior to 7/28/2021 is influenced by the cold seep, we performed the following steps:
Relocated loggers. On 7/28/2021, we modified logger deployment such that one logger was directly upstream of the cold water seep, and one remained in its original location within the seep.
Compared temperature data upstream vs. downstream of the seep. We observed consistently cooler temperatures in the downstream logger, with an average absolute difference of 1.47 ± 0.30 °C (mean ± sd). Figure 4.6 displays time series from both loggers as well as the difference values where simultaneous data from both locations exists.
From these data we observe that the small cold water tributary consistently affected main stem temperature where the loggers recorded temperature. Temperature contrast was much less apparent in cooler months, after approximately September 1st, 2021. Thus, the data from these HOBO loggers prior to 7/28/2021 in the location downstream of the small cold water tributary should not be considered representative of main channel Crook Creek temperatures.
We reviewed all paper field forms from the lower Crooked Creek site from 2015 - present (link here) to determine the time extent that HOBO loggers may have been influenced by the cold water tributary. These notes suggest that the period extended from from 5/31/2019 - 7/28/2021. Prior to 5/31/2019 there is not evidence on file that can confirm whether or not the loggers were deployed within the cold water plume.
One possible explanation for why technicians failed to observe the cold water seep when they installed the HOBO loggers in Summer 2019 is that high discharge level in the Crooked Creek main channel temporarily masked the localized effect of cold water input. These results highlight the value of regular site visits to re-verify that the site is well-mixed, or checking temperatures beyond the minimum of five observations across a transect.
Additionally, these results exemplify the role of cold water inputs in maintaining thermal refugia for salmonids in watersheds such as Crooked Creek. Note in figure 4.6 that water temperature within the cold water plume in the main channel was often 1.5 °C cooler than the non-influenced location. Temperature differentials of this nature help allow salmonids to access a diverse portfolio of thermal environments important to functions throughout their life cycle such as migration, metabolism, and foraging.
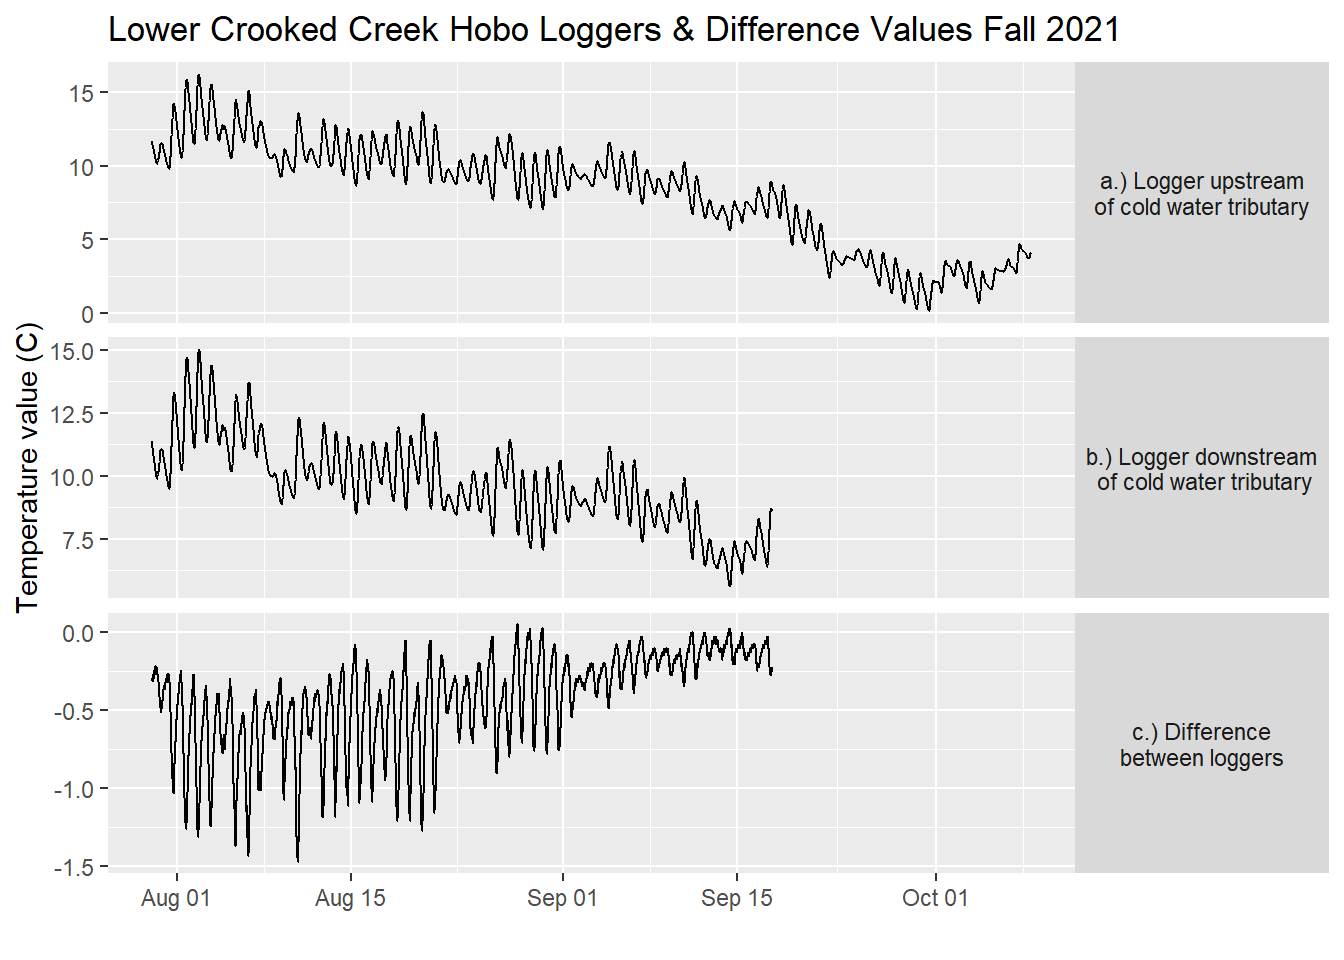
Figure 4.6: Water temperature time series from Lower Crooked Creek at two nearby loggers (~5 m apart). a.) Upstream of a small coldwater tributary, b.) downstream of small coldwater tributary, c.) difference values between the loggers. Note different y-axis ranges.
4.3.2 Extent of water temperature time series
Figure 4.7 displays temporal extent of currently available water temperature at each site
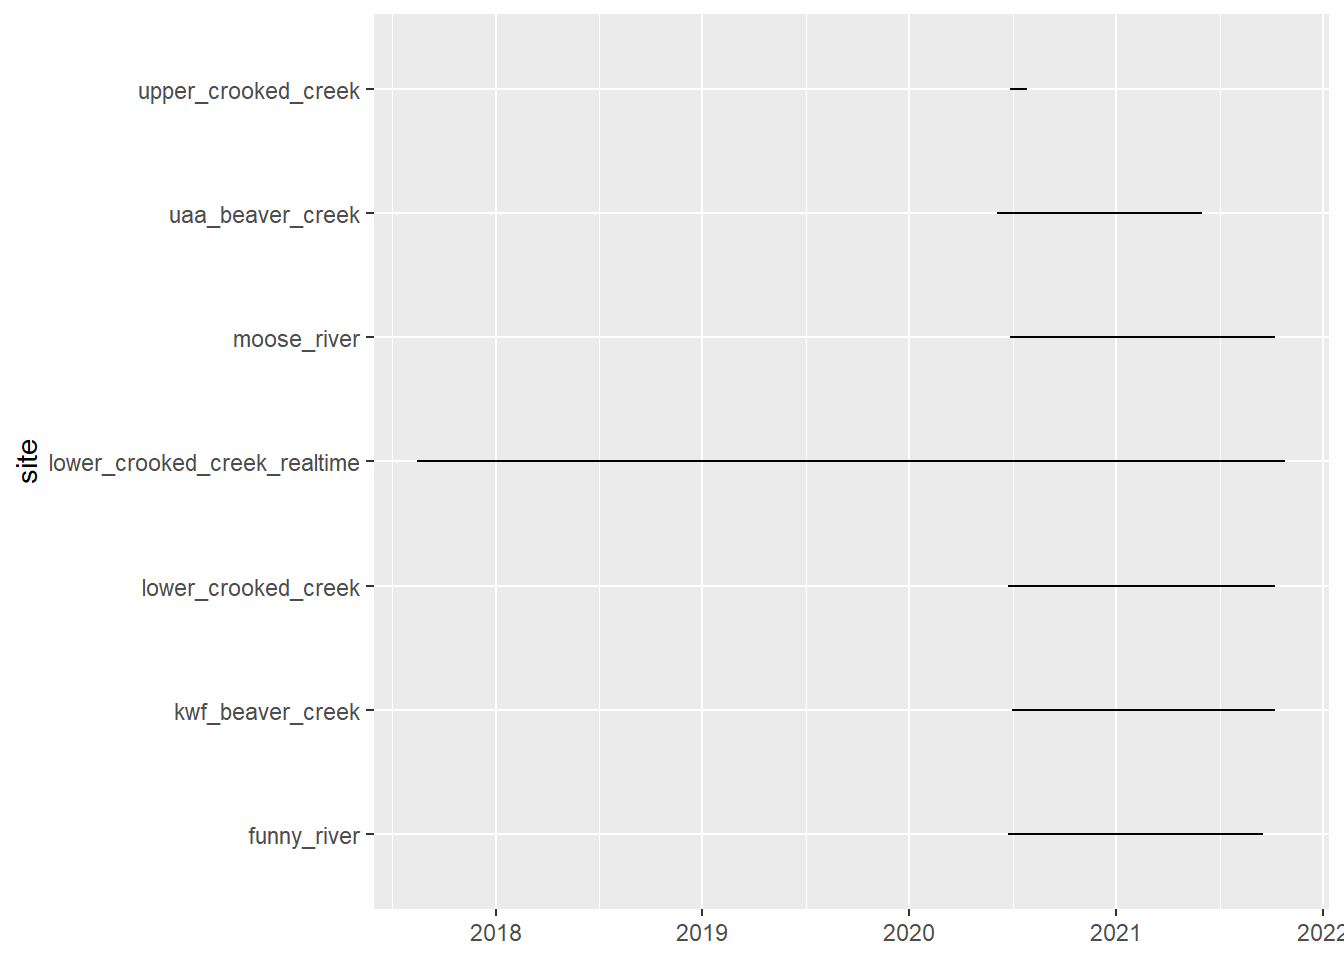
Figure 4.7: Temporal extent of water temperature logger data