2 Animated Plots
This tutorial describes how to create animations in R using the gganimate R package. gganimate is an extension of the ggplot2 package for creating animated ggplots. gganimate allows you to animate changes in data, changes in viewpoints, and it allows you to build animations that carry along traces of the prior viewframes within them, that is, to have “shadows” of past keyframes.
2.1 Prerequisites
gganimate is available on CRAN and can be installed with install.packages('gganimate'). The latest development version can be installed as follow: devtools::install_github('thomasp85/gganimate'). For the examples below, we first load required packages and set the default ggplot2 theme to theme_bw():
2.2 Demo dataset
We then load the gapminder demo dataset.
library(gapminder)
head(gapminder)
#> # A tibble: 6 x 6
#>   country     continent  year lifeExp      pop gdpPercap
#>   <fct>       <fct>     <int>   <dbl>    <int>     <dbl>
#> 1 Afghanistan Asia       1952    28.8  8425333      779.
#> 2 Afghanistan Asia       1957    30.3  9240934      821.
#> 3 Afghanistan Asia       1962    32.0 10267083      853.
#> 4 Afghanistan Asia       1967    34.0 11537966      836.
#> 5 Afghanistan Asia       1972    36.1 13079460      740.
#> 6 Afghanistan Asia       1977    38.4 14880372      786.
2.3 A static plot
p <- ggplot(
  gapminder,
  aes(x = gdpPercap, y=lifeExp, size = pop, colour = country)
  ) +
  geom_point(show.legend = FALSE, alpha = 0.7) +
  scale_color_viridis_d() +
  scale_size(range = c(2, 12)) +
  scale_x_log10() +
  labs(x = "GDP per capita", y = "Life expectancy")
p
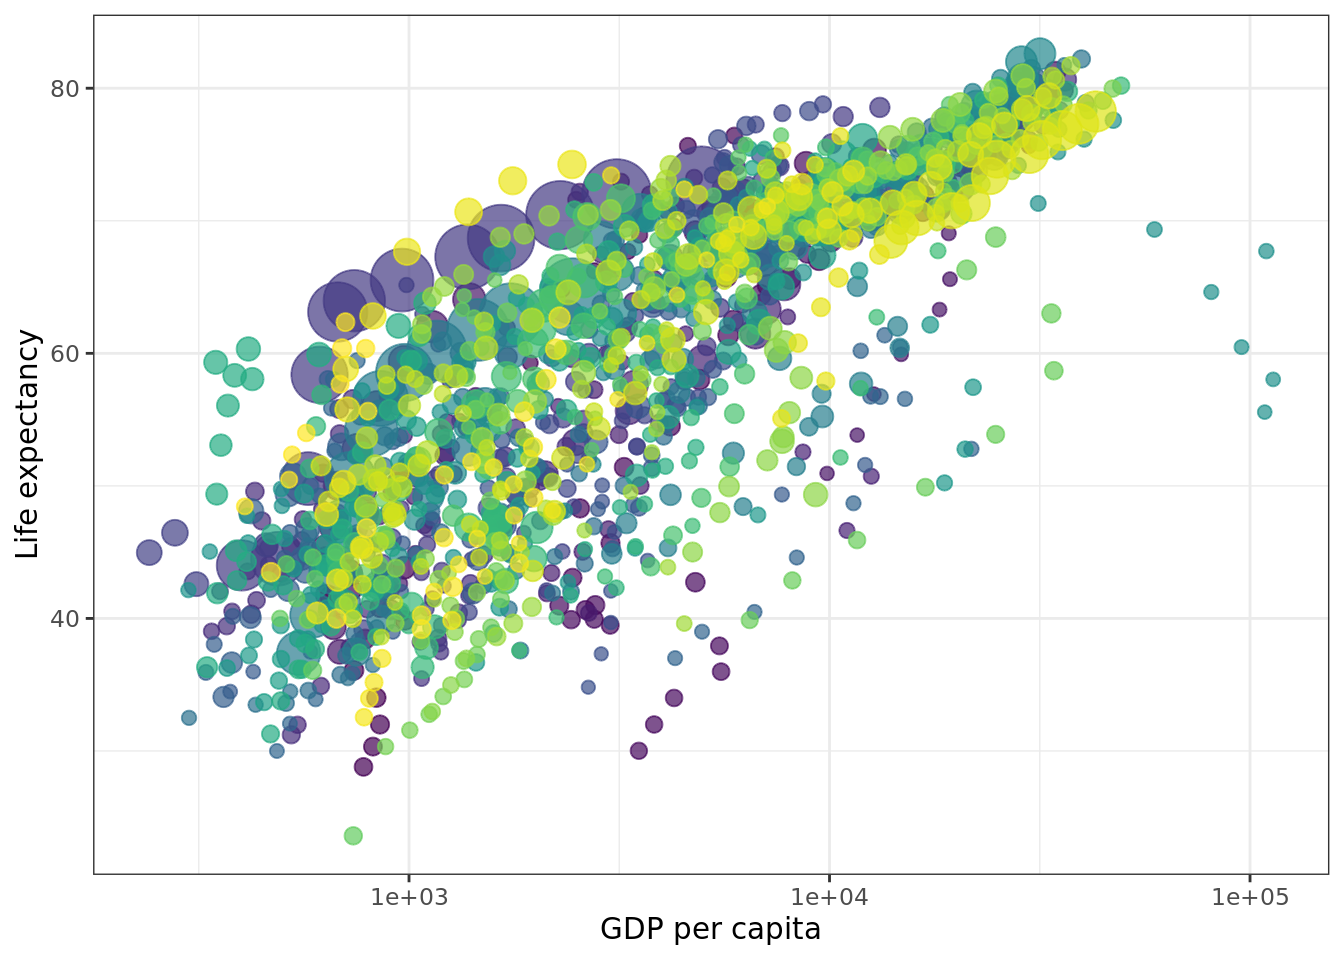
Figure 2.1: All the GDP and Lifexpectancy data, overplotted
2.4 Animate transitions through time
2.4.1 The relationship between GDP and life expectancy through time
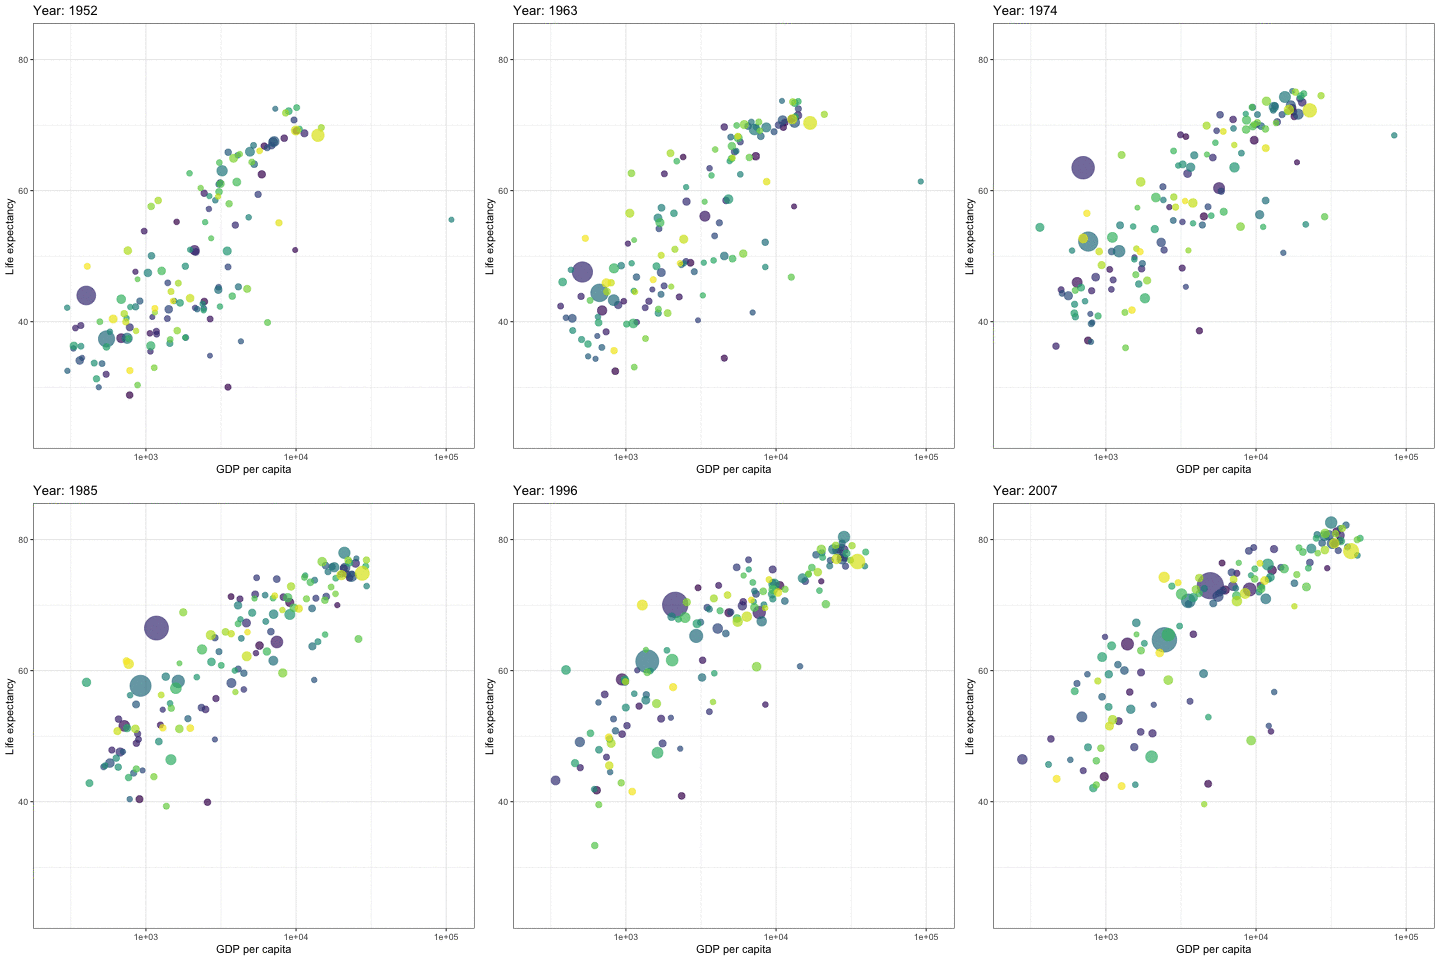
The key gganimate function is transition_time(). This is where you specify the variable that serves as the frame_time, ordering the sequence of animated keyframes. The animation is labeled using a string that references this frame_time variable. Specifying "Year: {frame_time}" will ensure that the year corresponding to each keyframe will be displayed.
p + transition_time(year) +
  labs(title = "Year: {frame_time}")
2.4.2 Saving animations
An animation can be saved to a .gif file that can embedded into a HTML page just like a normal image would be. The function to use is anim_save. This function should come directly after the code that plots your animation. The function expects a filename argument.
p + transition_time(year) +
  labs(title = "Year: {frame_time}")
anim_save(filename="gdp_income_animation.gif")
2.4.3 Embedding animations in an RMarkdown document
If you have saved an animation, you can include that animation in your RMarkdown document by using the function include_graphics which is a part of the knitr package. As with other included images, you can (and should) specify the width that you would like the image to be displayed using the out.width variable in your chunk header. This variable can be set to a number of pixels (e.g. out.width="500px") or a percentage of the available page width (e.g. out.width = '80%').

