Chapter 5 Applications
Some fun applications are demonstrated in this chapter. To be added …
Here is an example of a simple random-walk plot using the Python Matplotlib library, and its classic plot formatting and colors. We start with the typical imports:
import matplotlib.pyplot as plt
plt.style.use('classic')
import numpy as np
import pandas as pd
Now we create some random walk data:
rng = np.random.RandomState(0)
x = np.linspace(0, 10, 500)
y = np.cumsum(rng.randn(500, 6), 0)
And do a simple plot:
plt.plot(x, y);
#plt.legend('ABCDEF', ncol=2, loc='upper left');
plt.show()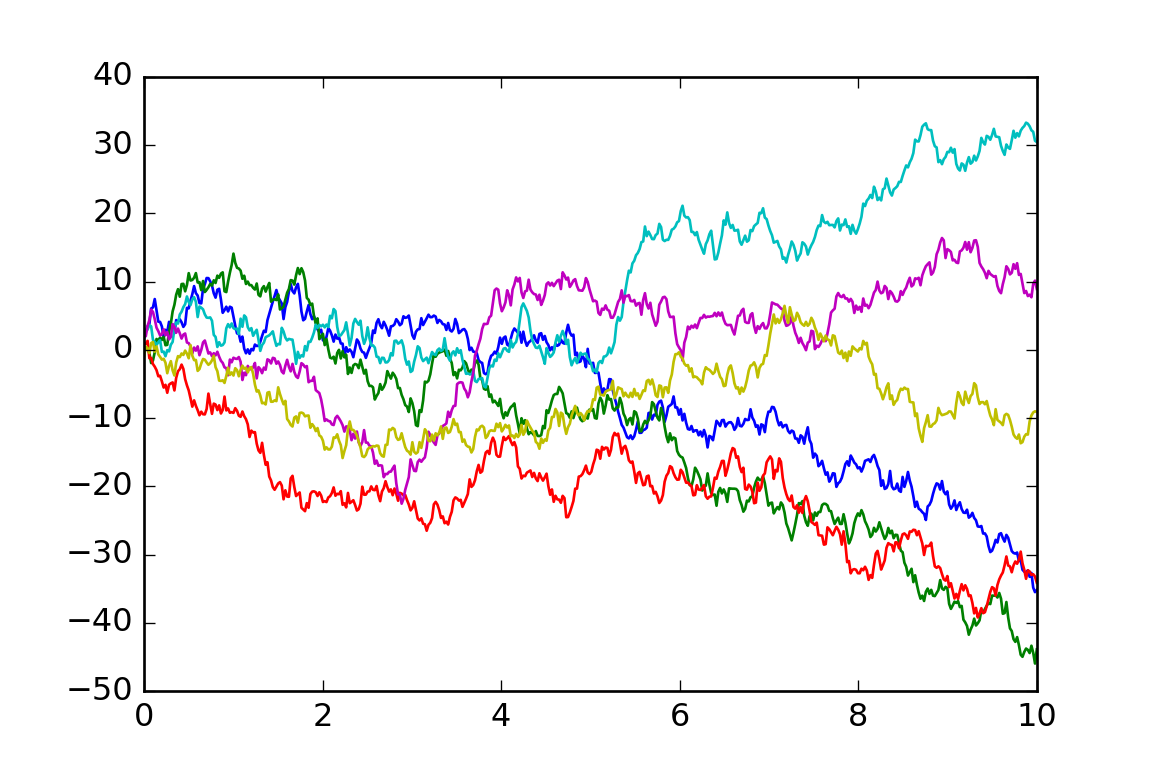
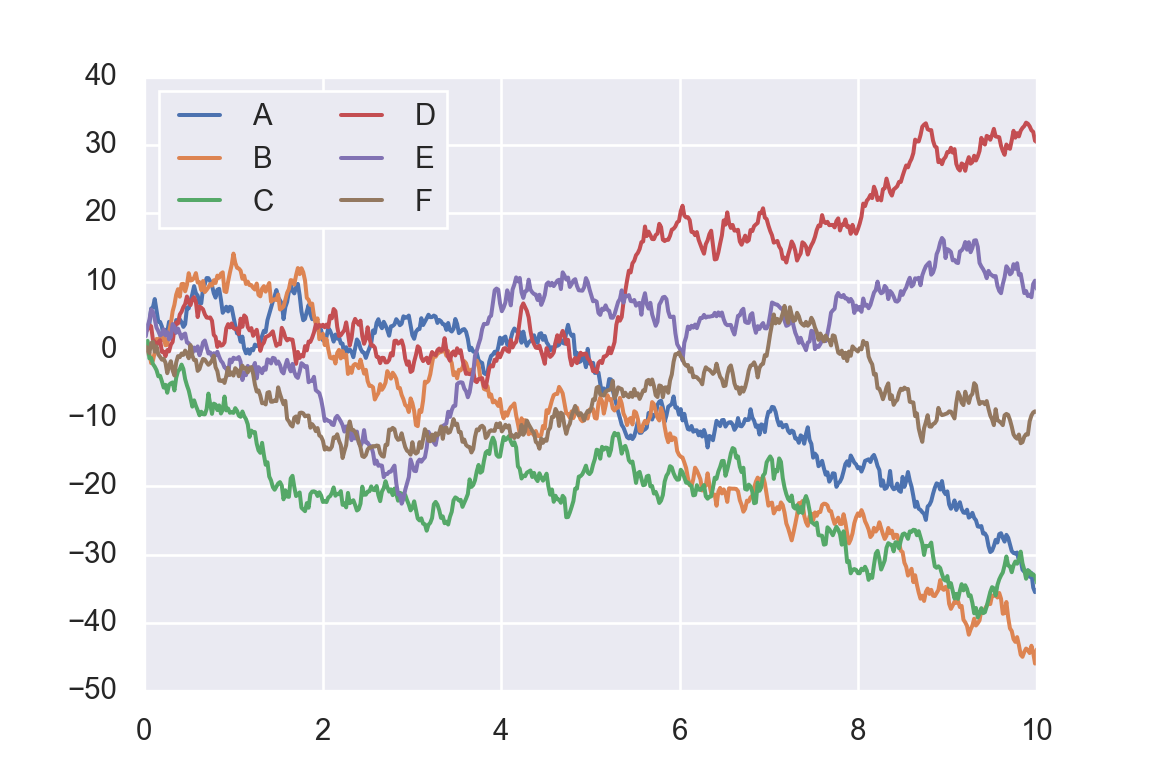
Now let us take a look at how it works with the Python Seaborn library. As we will see, Seaborn has many of its own high-level plotting routines, but it can also overwrite Matplotlib’s default parameters and in turn get even simple Matplotlib scripts to produce vastly superior output. We can set the style by calling Seaborn’s set() method. By convention, Seaborn is imported as sns:
import seaborn as sns
sns.set()
Now let’s rerun the same two lines as before:
# same plotting code as above!
plt.plot(x, y);
plt.legend('ABCDEF', ncol=2, loc='upper left');
plt.show()