Chapter 16 Visualizing trees and trees with data
16.1 Objectives
By the end of this chapter, you will:
- Understand ways to visualize trees
- Understand how to visualize trees with data
It’s always important to visualize trees, and data on your trees. For example, most comparative methods require branch lengths. Are yours reasonable? Do you have any taxa on very long branches (which could indicate alignment or paralogy issues)? Are there many effectively zero length branches? Does everything agree with what you know of taxonomy?
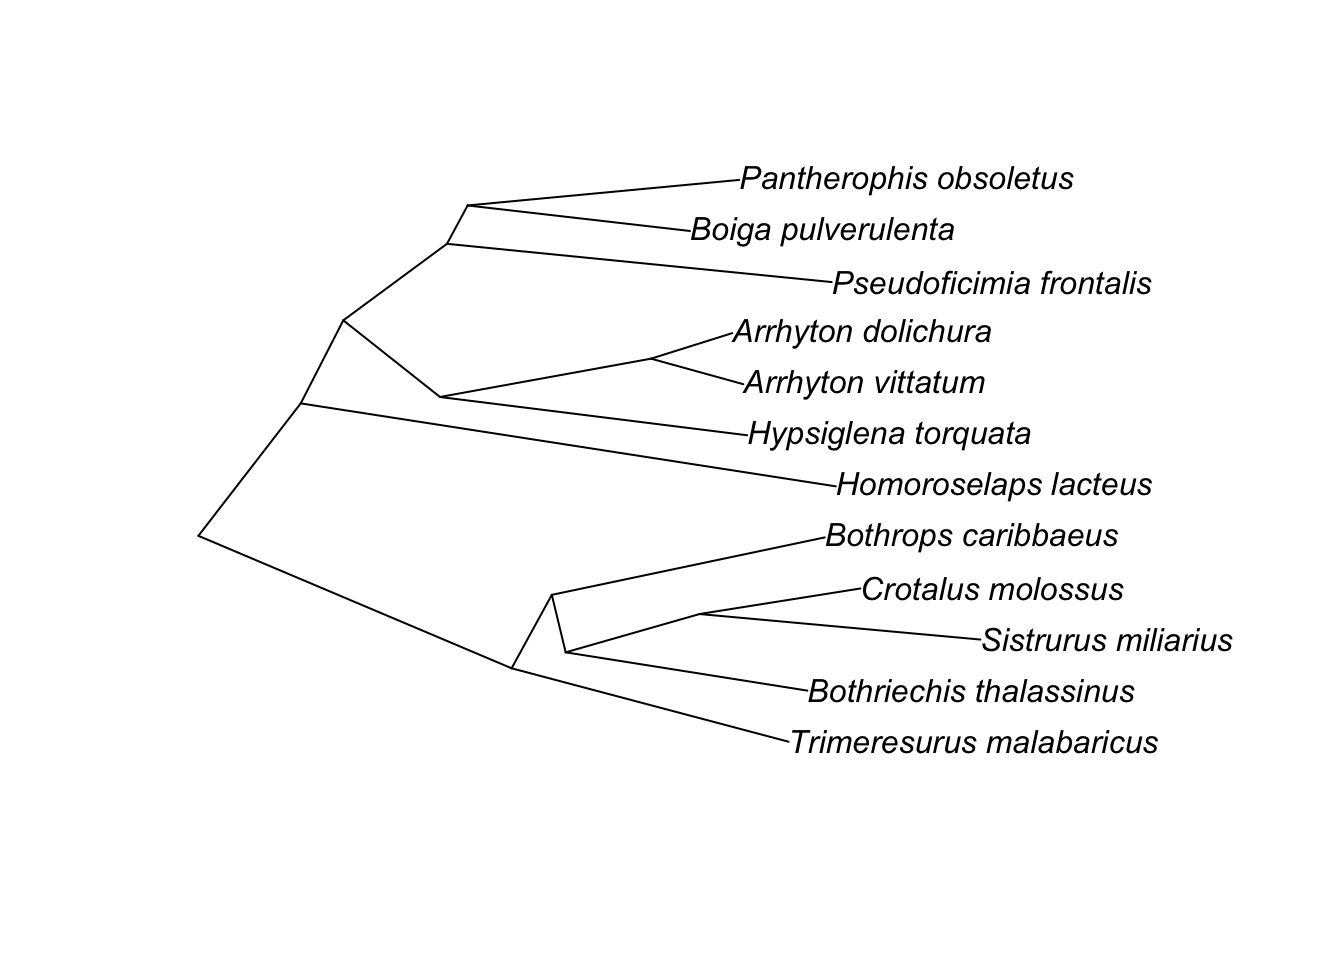
To start, let’s take a sample tree: a tree of snakes by Pyron R.A., Burbrink F., Colli G., Montes de oca A.N., Vitt L.J., Kuczynski C.A., & Wiens J.J. 2010. The phylogeny of advanced snakes (Colubroidea), with discovery of a new subfamily and comparison of support methods for likelihood trees. Molecular Phylogenetics and Evolution 58 (2): 329-342. [#TODO: add proper citation]. It is a tree of 767 taxa. But we’ll start with a 12 tip subtree.
The natural way you’d plot this in R:
ape::plot.phylo(small.phy)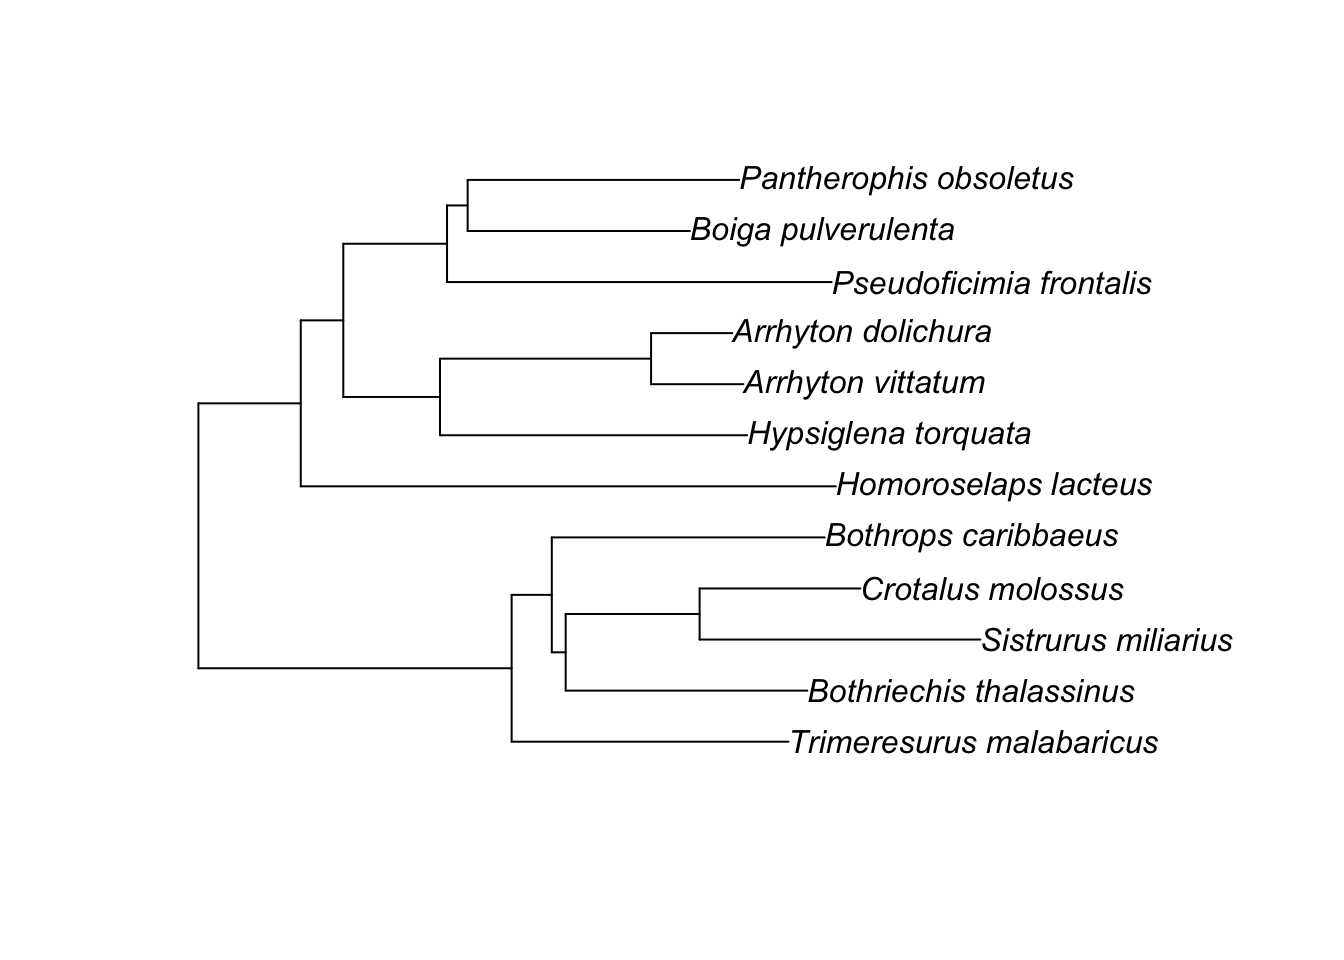
Plotting it with tips to the right is most common, but there are other options, too:
ape::plot.phylo(small.phy, direction="upwards")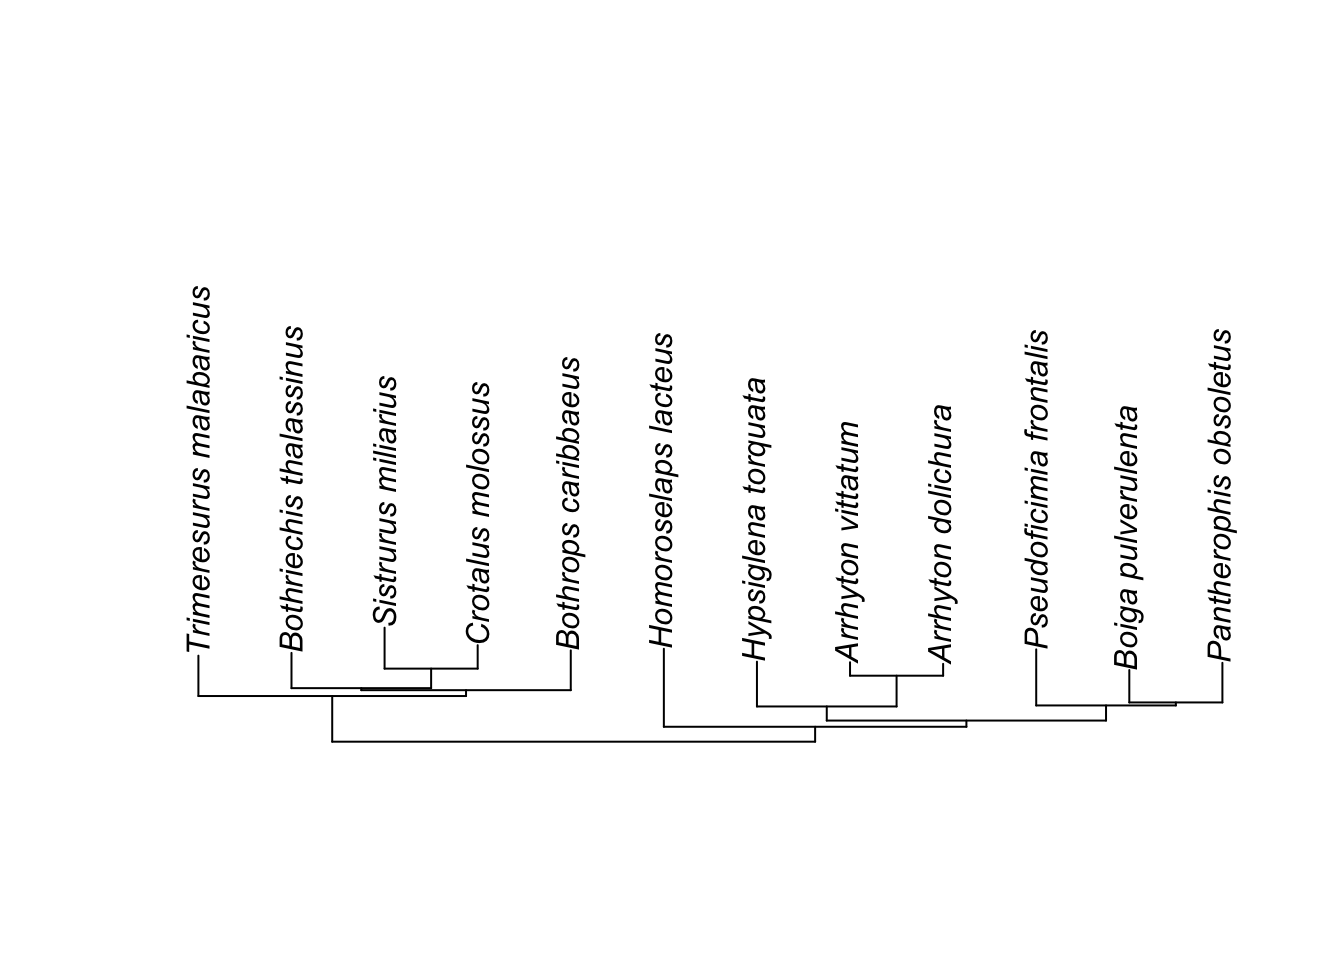
Especially for big trees, fan (circle trees) can also be popular:
ape::plot.phylo(small.phy, type="fan")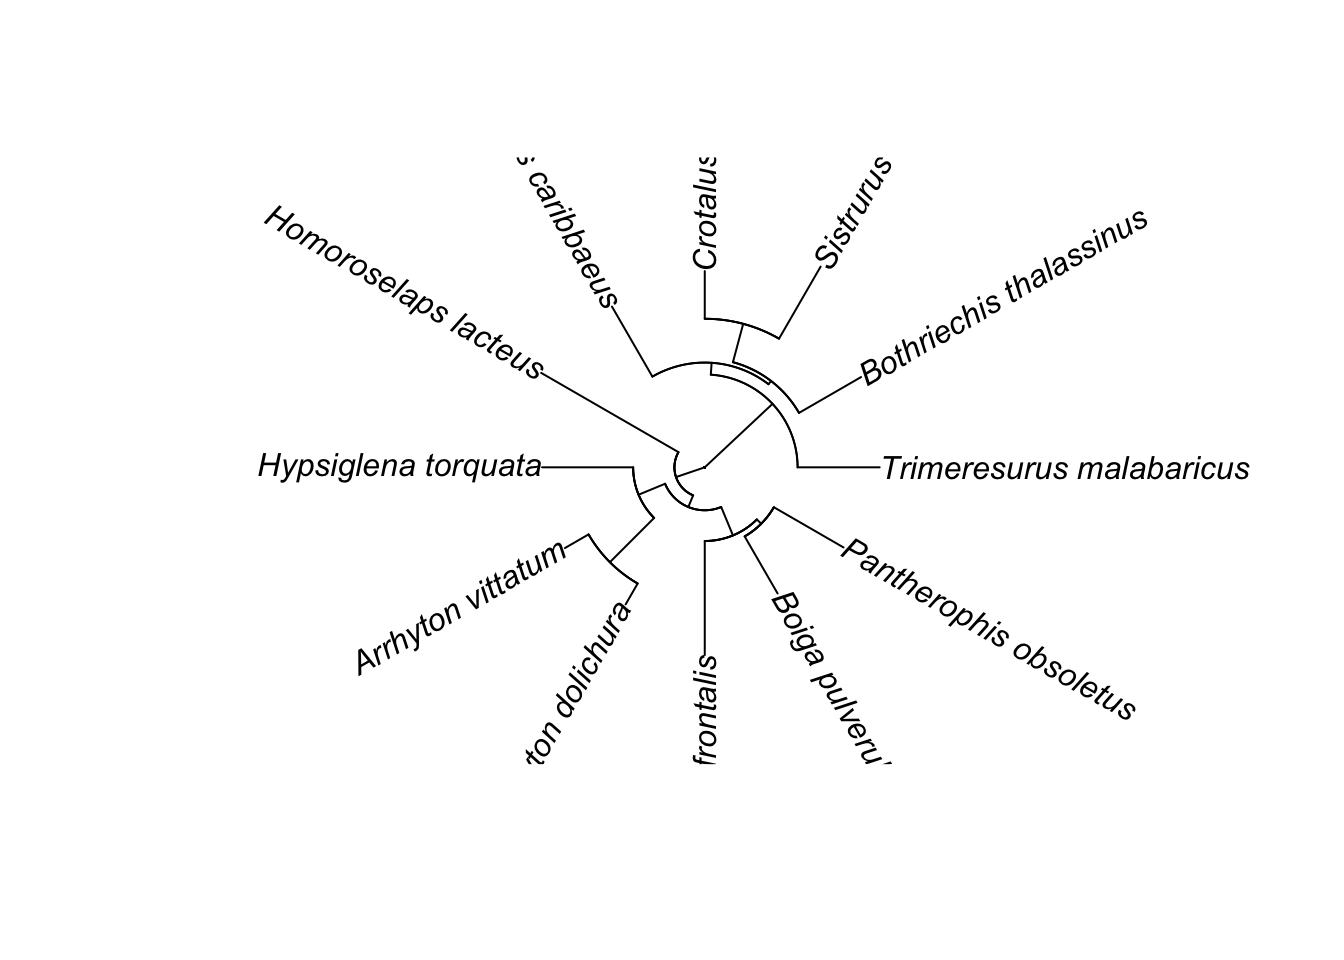 Sometimes for just seeing the tree structure itself, once can remove branch lengths:
ape::plot.phylo(small.phy, type="cladogram")