Supplementary Materials for Probabilistic Modeling Framework for Genomic Networks Incorporating Sample Heterogeneity
\(^1\)Department of Biostatistics, University of Michigan,
\(^2\)Department of Biotatistics, University of Pennsylvania,
\(^3\)Department of Statistics, Texas A&M University
\(^4\)These authors contributed equally.
\(^5\)Corresponding author\(:\) veerab@umich.edu
Introduction
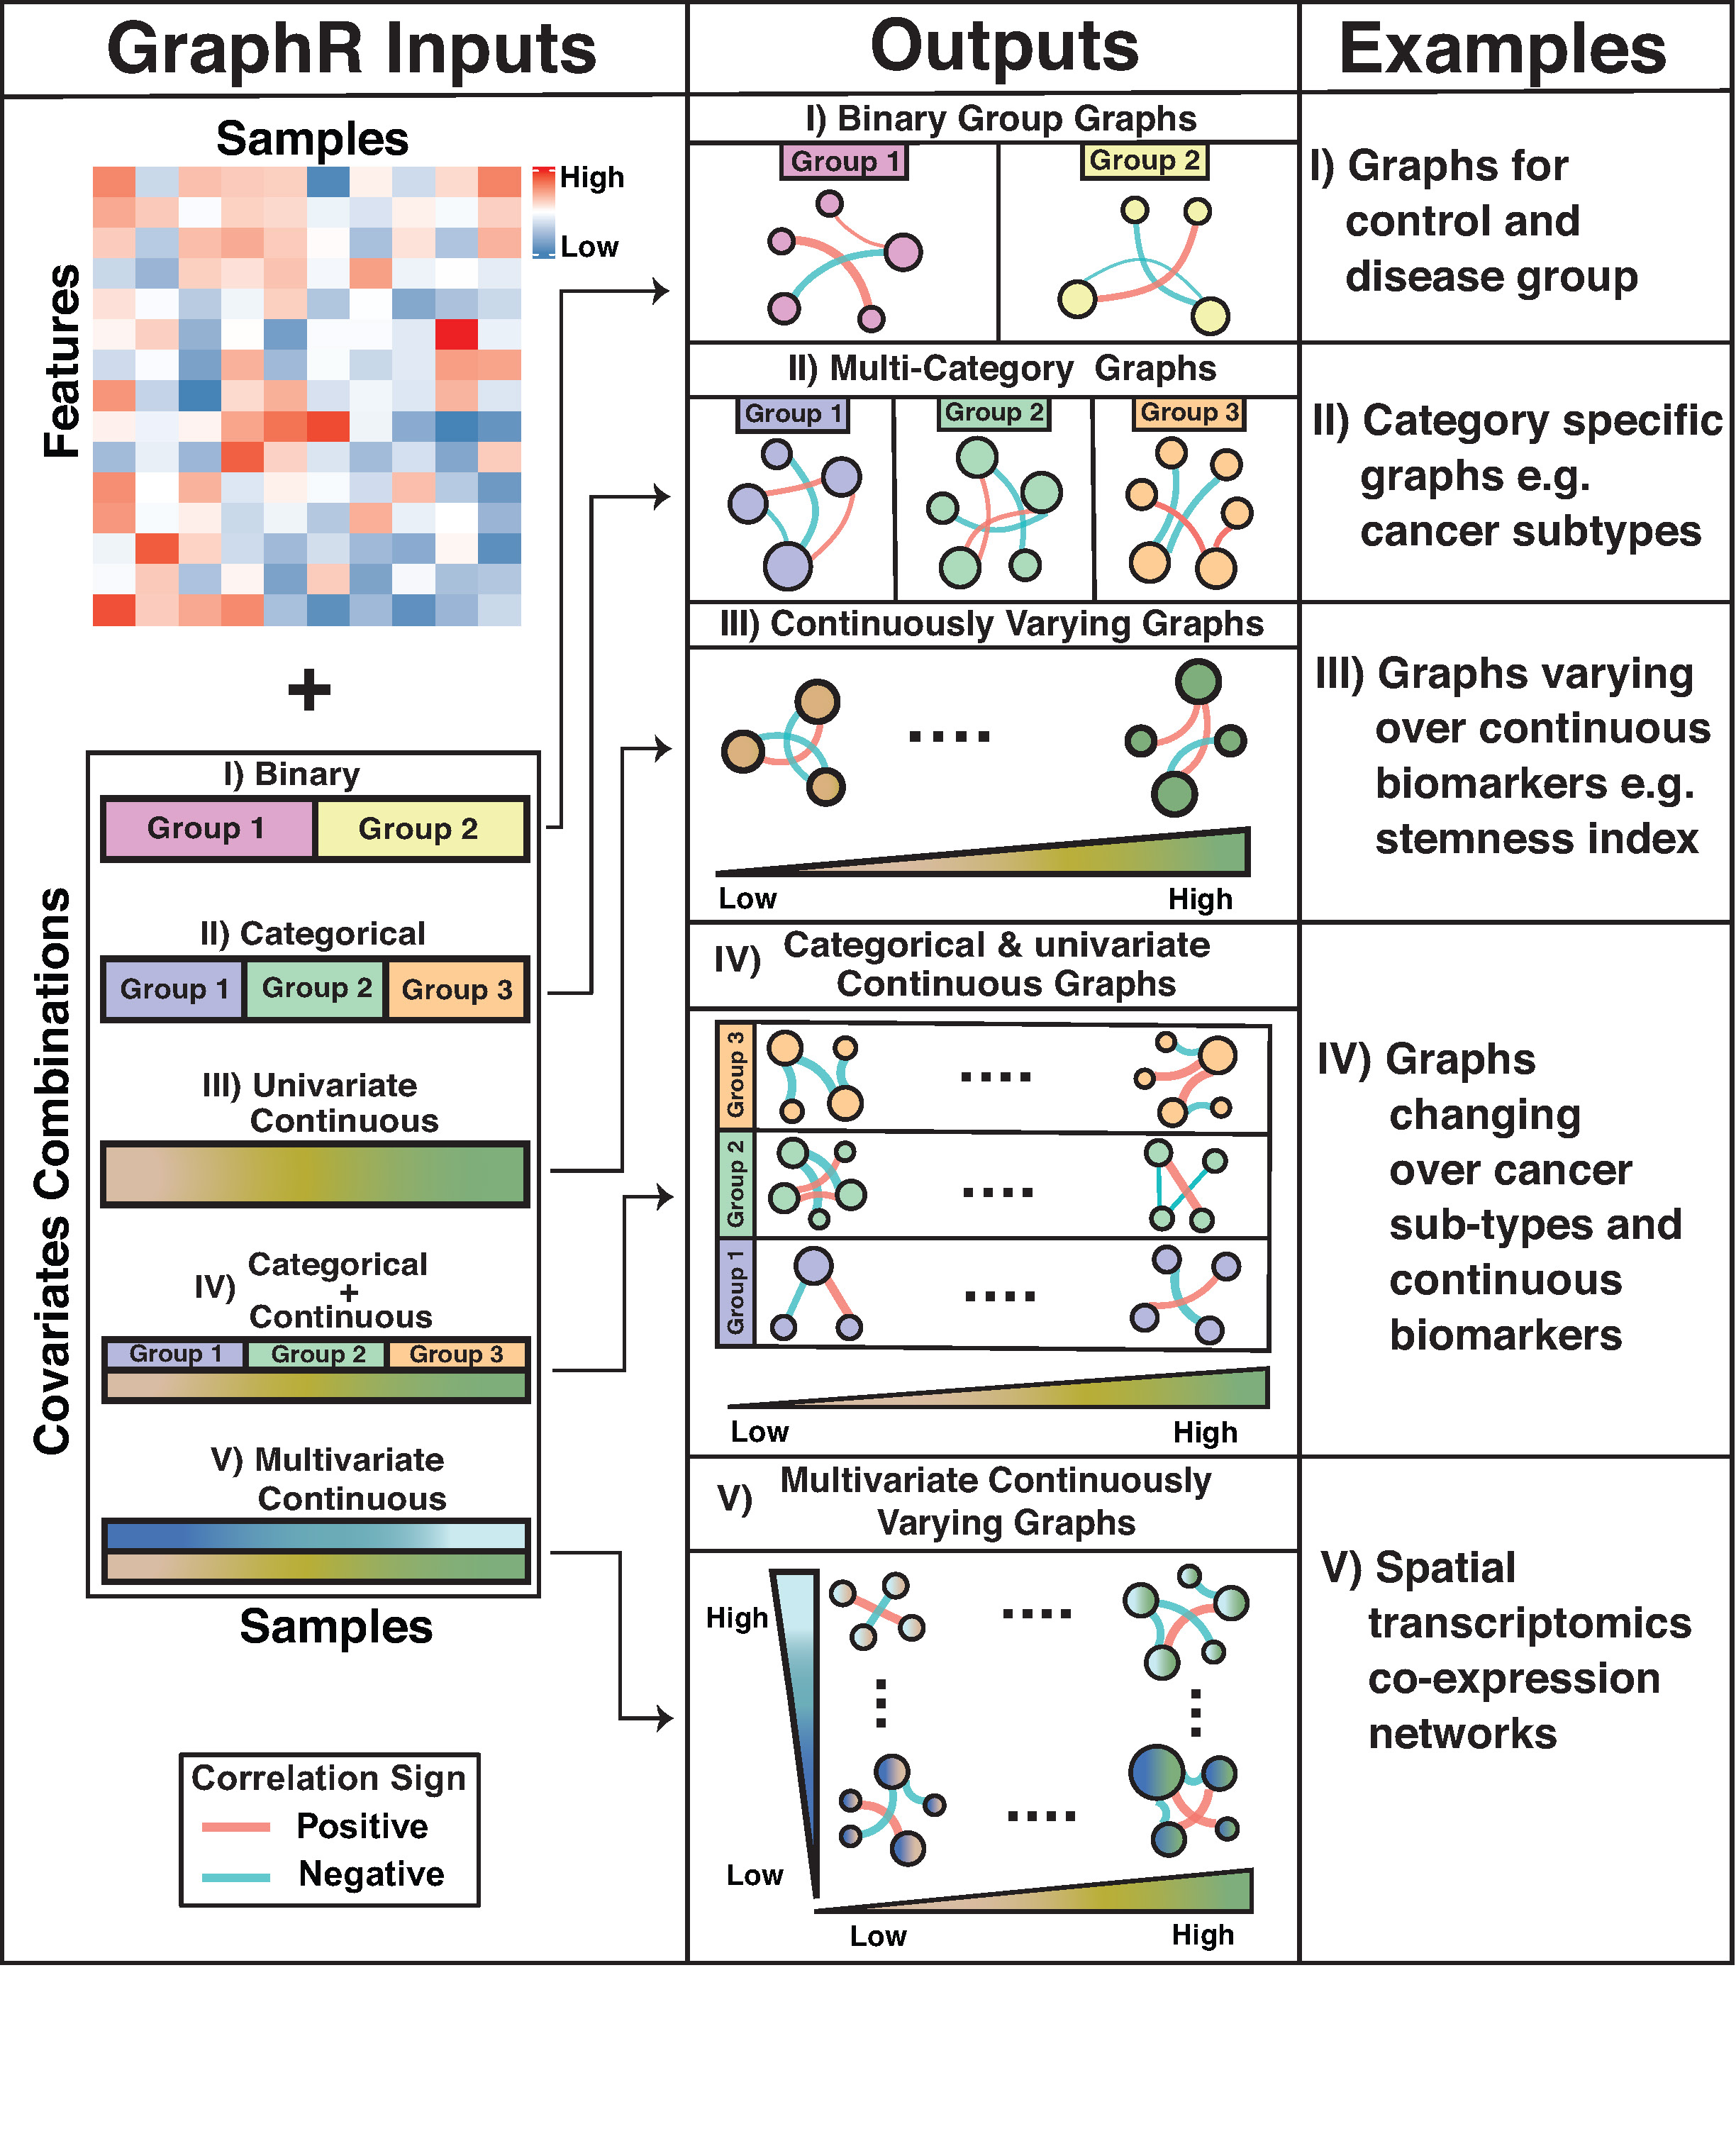
Network modeling are widely used in biomedical research, aiming to estimate and visualize complicated dependency structures in various fields and at different level. Graphically, networks compromise a set of variables (nodes) and relationships among nodes which are referred as edges. Under the assumption that: (1) edges represent partial correlation between nodes; (2) nodes follow Gaussian distribution, leading to a Gaussian graphical models (GGM, Lauritzen (1996)). GGM can be represented as a multivariate Gaussian distribution, usually with a sparse precision matrix of which a zero entry is equivalent to conditional independence. Most current probabilistic GGM-based methods assume homogeneous samples which limits the applicability of these models to incorporate heterogeneity across samples that is routinely present in many scientific contexts. We propose a flexible and computationally efficient approach called Graphical Regression (GraphR) which allows for covariate-dependent graphs and enables incorporation of sample heterogeneity. The Figure below provides an overview of the GraphR method.
Here we provide supplementary materials for Probabilistic Graphical Modeling under Heterogeneity, which are organized as following:
- In Section A, we provide a detailed introduction for mean-field variational Bayes method and the derivation of the methodology.
- In Section B, additional simulation results for undirected and directed settings are discussed.
- In Section C, we present the additional results from the PAM50 protemoics dataset.
- In Section D, more results from stemness and age based breast cancer data are provided.
- In Section E, we added further analysis from pan-gynecological breast cancer data.
- In Section F, additional results from from spatial transcriptomics breast cancer data are presented.
- In Section G, we layout the implementation related details of the GraphR package.