Chapter 4 Results
This section presents my results. I begin by showing barcode plots for several specific sessions of congress, and then move on to a systematic exploration of how the persistent homology has changed over time.
4.1 Persistent Homology of Specific Congresses
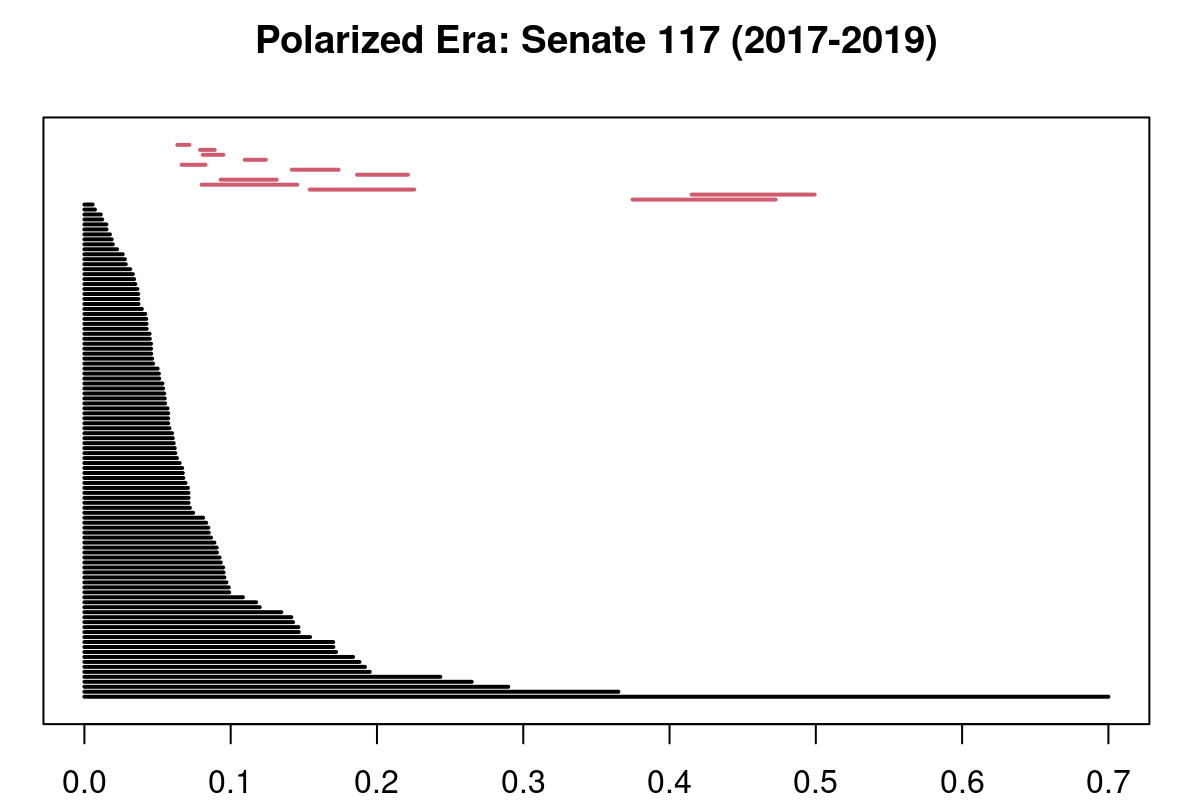
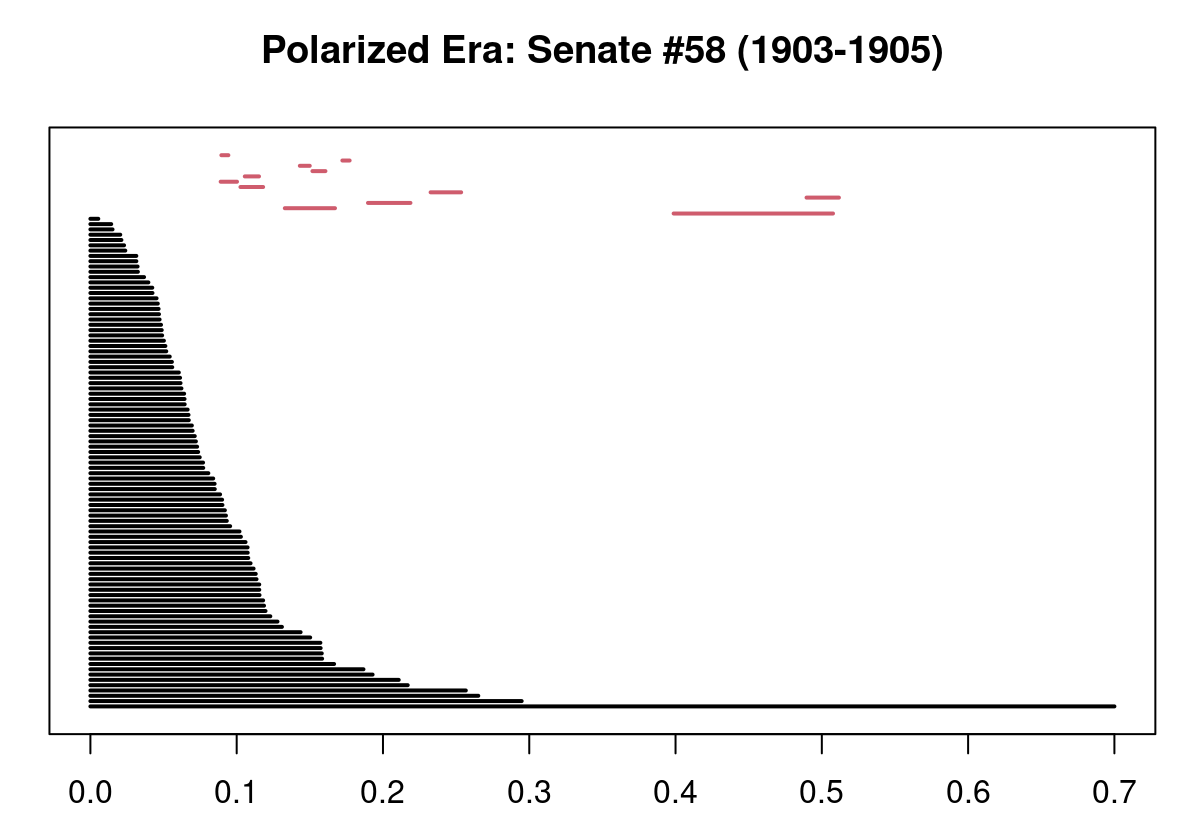
To illustrate my methodology, I begin by showing barcode results for a few specific senate sessions from polarized and unpolarized eras.
Two Polarized Eras
An Unpolarized Era
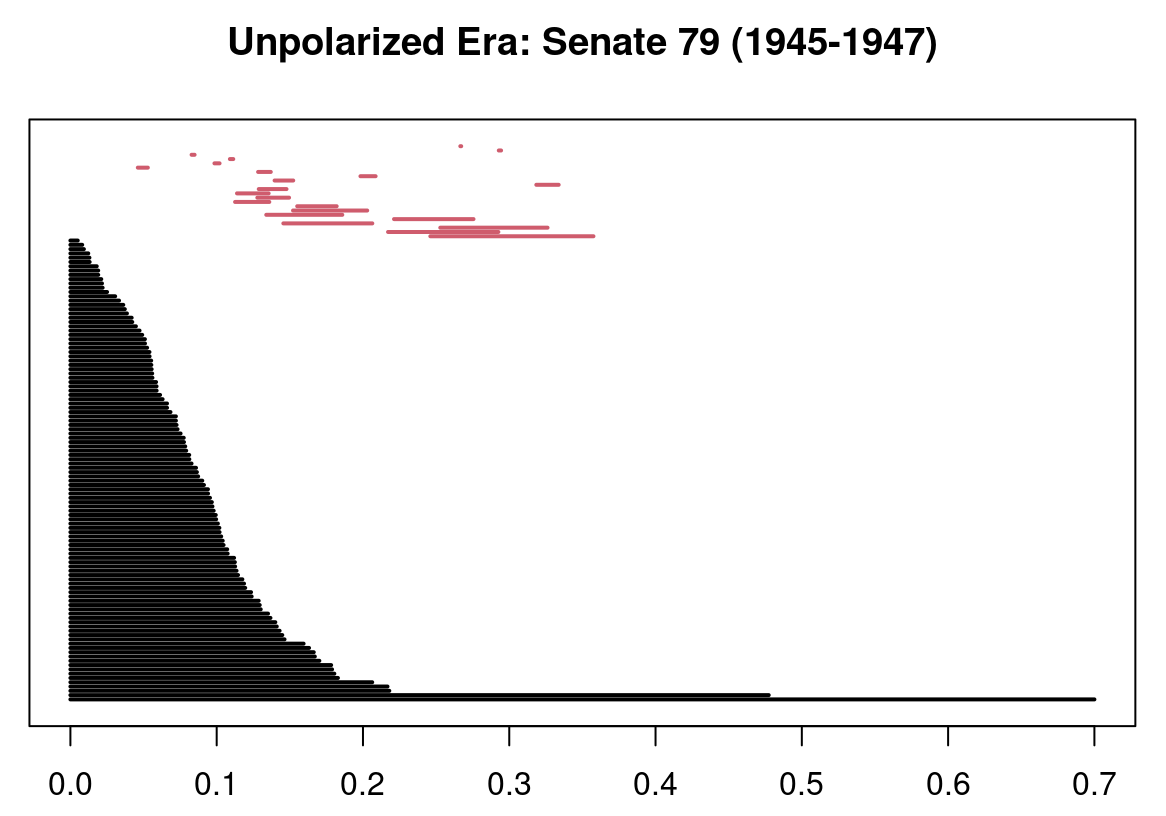
As we can see, there are appear to be noticeable differences between the homology of polarized and unpolarized congresses, but a more systematic approach is needed to see if this holds in general.
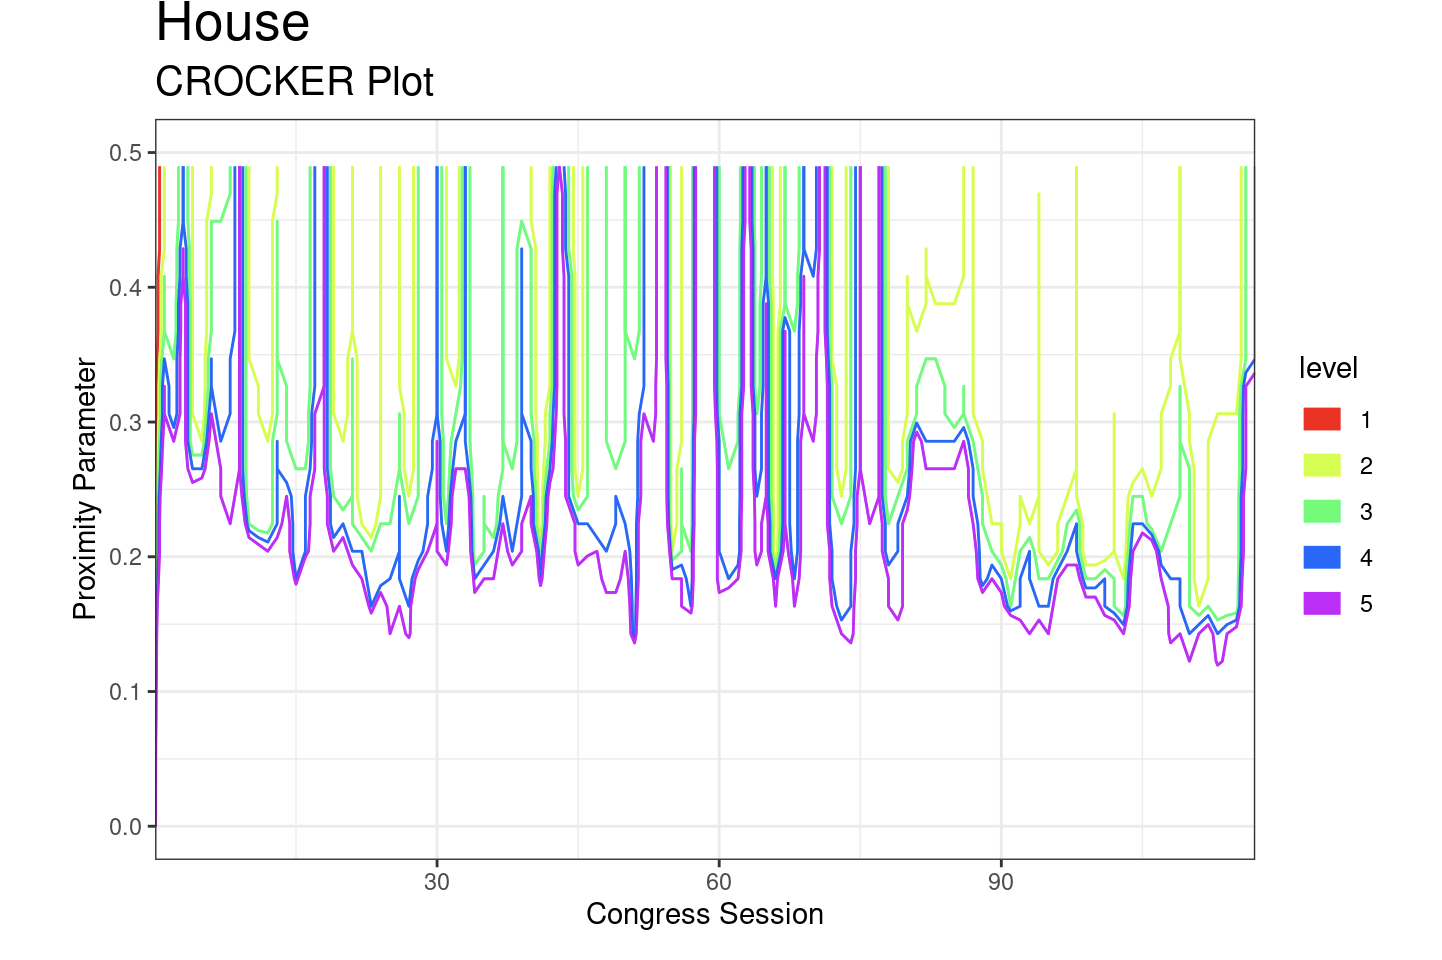
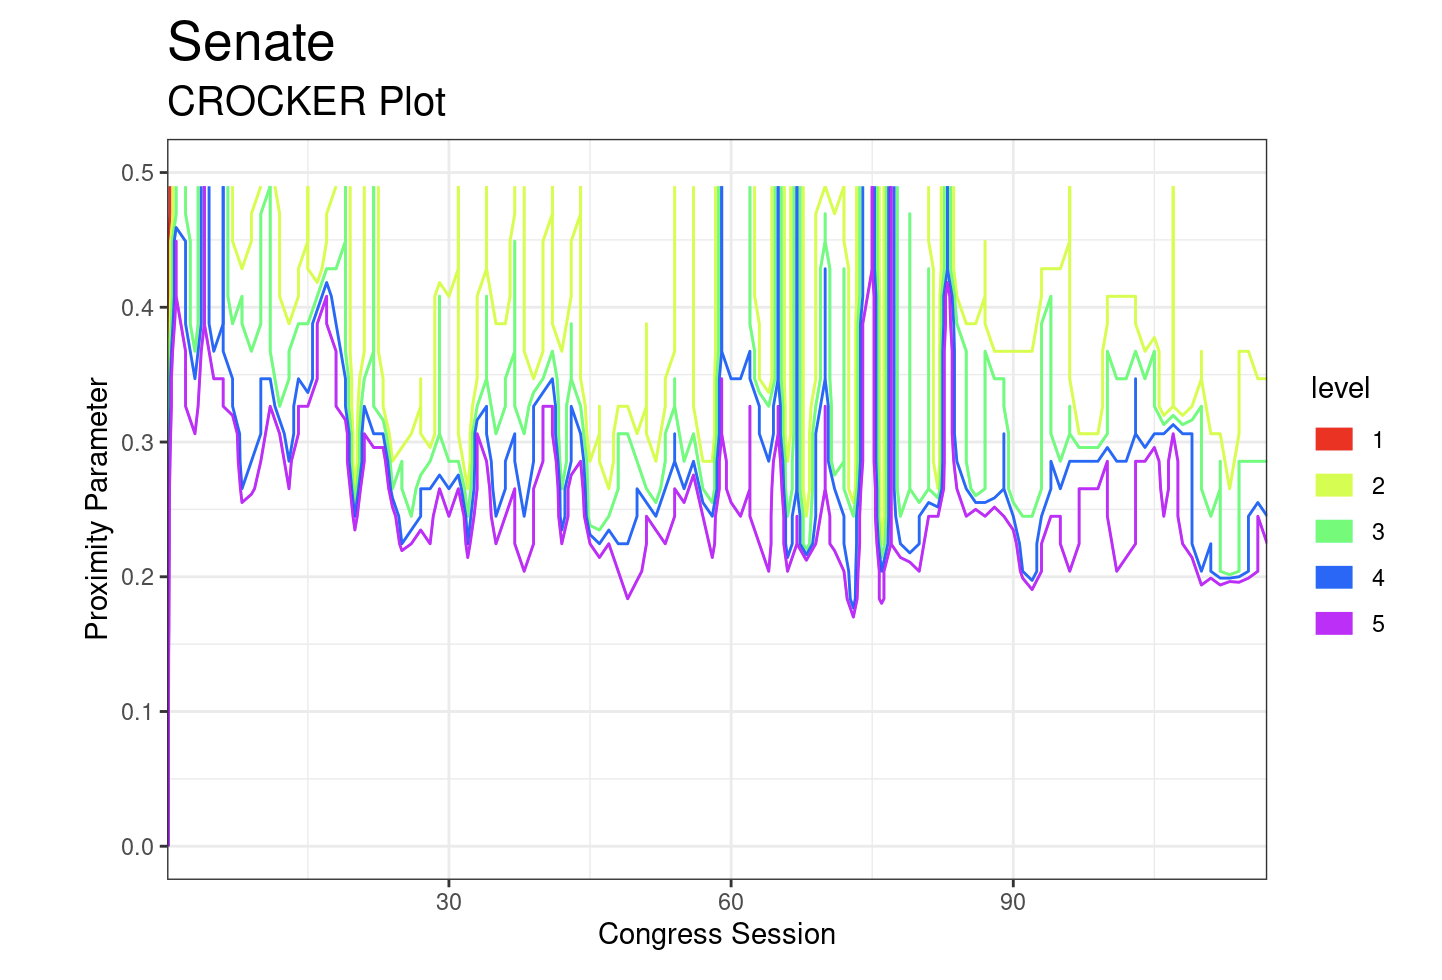
4.2 CROCKER Plot
The CROCKER plots for the house and senate are shown in the two figures below. One finding of particular note is that 3, 4 and 5 connected components persist for a much broader range of parameter values in the unpolarized era, whereas 2 connected components are a more central feature in the polarized era. Additionally, while we observe a much clearer pattern in the senate data than the house (possibly due to having fewer data points), we see a similar trend in both bodies.
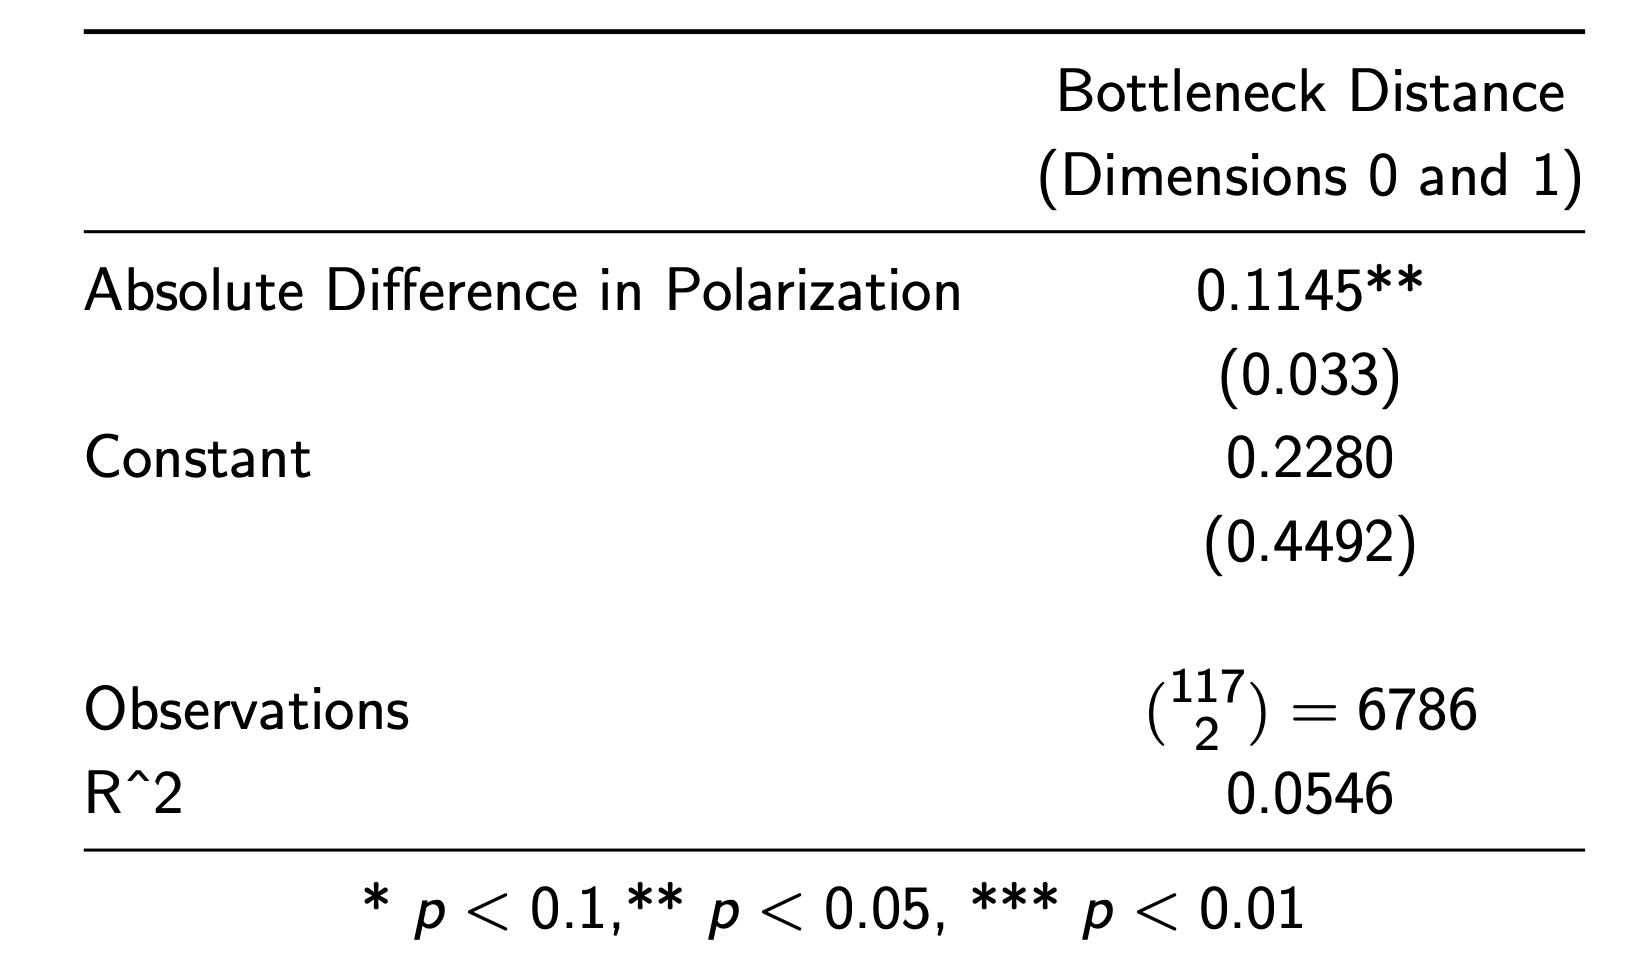
4.3 Bottleneck Distance
Finally, I present my regression results for bottleneck distance and absolute difference in polarization. As shown in the table below, there is a positive and significant relationship between bottleneck distance and absolute difference in polarization. This result suggests that congress sessions with similar polarization scores along traditional measures are more close together homologically.