Chapter 3 Data Science on the CCPS Team
3.1 What is data science?
Translation of raw data into insight, actionable intelligence.
Can usefully divide the work into stages of data, analytics, and communications.
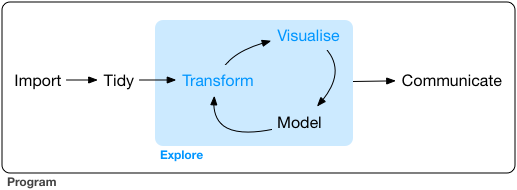
Data: acquiring, organizing, managing, curating data (= symbols representing some measurements about the world); reformating and staging data to make it ready for analysis. - In practice, these activities absorb ~ 80% of the time of a working data scientist. (Your best friend is a good data manager!) - Hence the value of data standards: the more consistency in the way meaning is represented in data, the less time, tedium, and expense spent on data mapping and transformations.
Analytics: statistics, machine learning, modeling, other techniques for extracting summary intelligence from data. - In general, data science practitioners don’t work on developing new techniques, nor on writing code to efficiently implement techniques. Those are specializations. Most of the work involves identifying the appropriate techniques, and the right software to implement those techniques, given the data and the goals. In some cases, work will be done in close collaboration with domain area specialists, e.g., climate scientists.
Communications: creating visualizations, narratives, etc., to reveal complexity, to convey insights. Also includes the creation of reports, dashboards, other data products.
Doing data science requires a mix of skills: computing; statistics and other analytics; visual design and communications.
3.2 Data science projects and products
The overall mission of the Cooper Center is to leverage the resources of UVA in public service to Virginia and beyond. We have a particular focus on providing assistance to state and local officials, and to other community stakeholders. A substantial share of this work involves generating and delivering insights based on analysis of data.
3.2.1 Decision tools and dashboards
The DMME Dashboard
The SolTax tool; the SolDev tool
CTE Trailblazers dashboards: growth; gaps
3.2.2 Publications
Virginia decarbonization studies
Virginia Local Tax Rates survey
Virginia Energy Almanac
CTE Trailblazers publications: cluster briefs, longer reports
Academic publications
Student-led projects and publications
3.2.3 Research
Energy systems modeling
Virginia Paid Family and Medical Leave analysis
Many others, including those in collaboration with colleagues across UVA and beyond: * Hurricane evacuation (with Engineering) * Negative emissions * Carbon sequestration risks * …
3.4 Working collaboratively in a team
When working on a personal project, such as a student assignment, it is typically not so necessary to assure that others can access, learn from, critique, reproduce, and build on your work.
In a team setting, it is mandatory.
We have adopted tools, processes, workflows to try to assure that your own work can be used by others, and vice versa.
3.5 Reproducible workflows
Essential for us that workflows be reproducible, auditable, transparent.
3.5.1 The concept of reproducibility
Idea: when you present your results, you present all of the data and the code that another practitioner (of reasonable skill) would need to reproduce your work.3
We are very much a “reproducible workflow” shop. In ideal practice this means:
If you generate a report or other data product, you should be able to reproduce it entirely by re-running your code. If you were to delete your report, you should be able to regenerate it exactly, simply by re-running your code. This process should require no manual inputs from you, no cutting-and-pasting.
If you provide someone else with your code and your data, they should be able to reproduce your report by running your code on their machine. This should be true even if they are using a different type of machine, with a different operating system and directory structure. They should not need to edit your code, make manual inputs, or perform any cut-and-paste operations.
3.5.2 How we create reproducibility in practice
These conditions are ideals. In practice, we want to get as close as we can, within reason. Many of the tools that we use, and work processes we adopt, are designed to make our workflows hew closely to this ideal of full reproducibility.
R Markdown is designed specifically to enable the generation of reports and other products reproducibly.
Git and Github enable frequent backup of code and other files, and collaboration between colleagues without losing version control.
Cloud servers for maintaining files and databases help assure that our work is available to each other, properly backed up and curated, and organized in a structured way to facilitate reuse, without loss of version control.
We seek to avoid as much as possible exchanges of the form, “I don’t know why my code won’t work on your machine. It runs just fine on mine!”
In particular: except possibly in the course of single work session, you should never have work-related data or code that exists only on your own machine. Ever. Your work, including data and code, should always be backed up to resources that are accessible by other team members.
We distinguish reproducibility versus replicability. Your work is reproducible if someone else can regenerate exactly your same results, using your data and your code. Your research results are replicable if another researcher can get essentially the same results when applying your techniques to different but comparable data.↩︎