Chapter 3 Week 8 – Oct 28 2021 class meeting
This week, our goals are to…
Practice collecting qualitative data using interviews.
Code qualitative data systematically to identify themes.
Interpret multivariate linear regression results, especially coefficients, \(R^2\), p-values, and confidence intervals.
Calculate predicted values and residual errors from linear regression models for individual observations.
3.1 Before class
3.1.1 Checklist – Complete by Oct 28 2021
By our class meeting on Thursday, October 28, 2021, you should complete the following tasks:
- Watch follow up video to last week’s Quantitative Activity (embedded below).
- Complete last week’s in-class Quantitative Activity, if you have not already
- Qualitative Assignment #2
- Quantitative Assignment #2
This is everything you need to do before we meet for class. If anything is unclear or you have any questions do not hesitate to email Anshul at akumar@mghihp.edu or contact me by phone.
It is fine to work with others on the assignments, but make sure you state who you worked with at the top of your assignment.
3.1.2 Follow-up video on Quantitative Activity
Please watch this follow-up video. It will also help you with this week’s quantitative assignment.
You can also watch the video above directly on YouTube: https://youtu.be/PG09QMcSdaM.
Please ask me any questions you have about this procedure!
3.1.3 Qualitative Assignment #2
Due by the start of class on October 28 2021.
Please type your assignment in a word processor. Do not print it out, but be ready to share them on your computer screen or by email during class. Also submit your completed assignment document in the appropriate D2L dropbox.
3.1.3.1 Part 1 – Practice Interview
Interview for 30 minutes the person that was assigned as your interviewee during the most recent class session. Use the interview questions that your group drafted in class.
Please remember to audio-record the interview, if the interviewee is willing (if not, that’s fine; just take great notes).
Note that if you conduct your interview over Zoom and record it, you can activate a setting that will attempt to transcribe the meeting for you. If you want, you can use Zoom to transcribe and then just double-check the transcript, instead of typing it all yourself. This is not always an acceptable transcription method in all research (be sure to check with your IRB or institution rules), but it is acceptable for our class. Note that you must record to the cloud (not your own computer) for this to work.
Also be sure to respect the privacy of your interviewee by avoiding highly personal or invasive follow-up questions.
Keep in mind that anything you share when you are the interviewee might be shared in class.
3.1.3.2 Part 2 – Transcribe
Listen to the recording of the interview that you conducted and transcribe (type onto your computer) a 15-minute segment of that interview. It does not have to be the first 15 minutes. It can be whatever 15 minutes are most useful. You can also do more than 15 minutes if you want, but I think you’ll find that it’s pretty tedious.
Your transcript should approximately resemble a movie, play, or TV script, with indications for who is speaking, non-verbal interactions/communications, and potentially time-stamps every 30 seconds or 1 minute. Leave the name of who you interviewed out of the transcript. Someone reading the transcript should not be able to determine who was interviewed.
Don’t forget to read the paragraph above regarding Zoom automatic transcription, if you want to save some time.
The following resources contain some good tips about transcribing effectively:
- Bailey, J. (2008). First steps in qualitative data analysis: transcribing. Family practice, 25(2), 127-131. https://doi.org/10.1093/fampra/cmn003.
- 3 Examples of Transcribed Interviews. October 31, 2018. IndianScribe. Click here.
- Isaac. How to transcribe your research interviews; a DIY guide. March 12, 2014. weloty. Click here.
Like last week, come to class ready to share your interview transcript electronically.
3.1.3.3 Example of qualitative assignment #2 (optional)
Below is an example of this week’s qualitative assignment, just to make sure we all understand the procedure. You don’t need to read this if you feel you already have a good sense of what to do.
Student Aaya is a member of Team A. Student Beep is a member of Team B. Team A is conducting practice research on Team B and Team B is conducting practice research on Team A. Aaya and Beep were paired to interview each other. They meet on Zoom for an hour on Saturday—from 10:00 to 11:00 a.m. After confirming that they are both comfortable with doing so, they record the meeting on Zoom, such that they can both listen later. They also record the hour-long interaction with the audio recorders on their mobile phones, as back-up.
At 10:00 a.m. on Saturday, Aaya asks Beep the interview questions drafted by Team A, for 30 minutes. On Sunday (the next day), Aaya creates a written transcript of 15 minutes out of these 30 minutes during which Beep was answering Aaya’s questions.
At 10:30 a.m. on Saturday, Beep asks Aaya the interview questions drafted by Team B, for 30 minutes. On Sunday (the next day), Beep creates a written transcript of 15 minutes out of these 30 minutes during which Aaya was answering Beep’s questions.
Both Aaya and Beep put their transcripts into Microsoft Word documents and are ready to e-mail or upload those documents at the start of class the following week.
If you notice anything in this example that confused you, might confuse your classmates, or is written incorrectly, please let me know right away at akumar@mghihp.edu.
3.1.4 Quantitative Assignment #2
Due by the start of class on October 28 2021.
Like last week’s quantitative assignment, it may be best to do the following assignment on paper. Also please submit your completed assignment in the appropriate D2L dropbox (photographs of the papers are fine).
3.1.4.1 Part 1 – Finish In-class Activity
If you have not done so already, please complete the in-class quantitative activity that we started in our most recent class meeting.
3.1.4.2 Part 2 – More Linear Relationships and Regression
We’re going to start this assignment by stepping back and looking at the correlation coefficient, another way to determine how related two variables15 are to one another.
Look at the following fitness dataset containing five people. Here are the variables in this data:
WeeklyWeightliftHoursis the number of hours per week the person spends weightlifting.WeightLiftedKGis how much weight the person could lift on the day of the survey.
| Name | WeeklyWeightliftHours | WeightLiftedKG |
|---|---|---|
| Person A | 3 | 20 |
| Person B | 4 | 30 |
| Person C | 4 | 21 |
| Person D | 2 | 25 |
| Person E | 6 | 40 |
Task 1: What is a reasonable research question that we could ask with this data?
Task 2: What is the dependent variable and independent variable for a quantitative analysis that we could do to answer this research question?
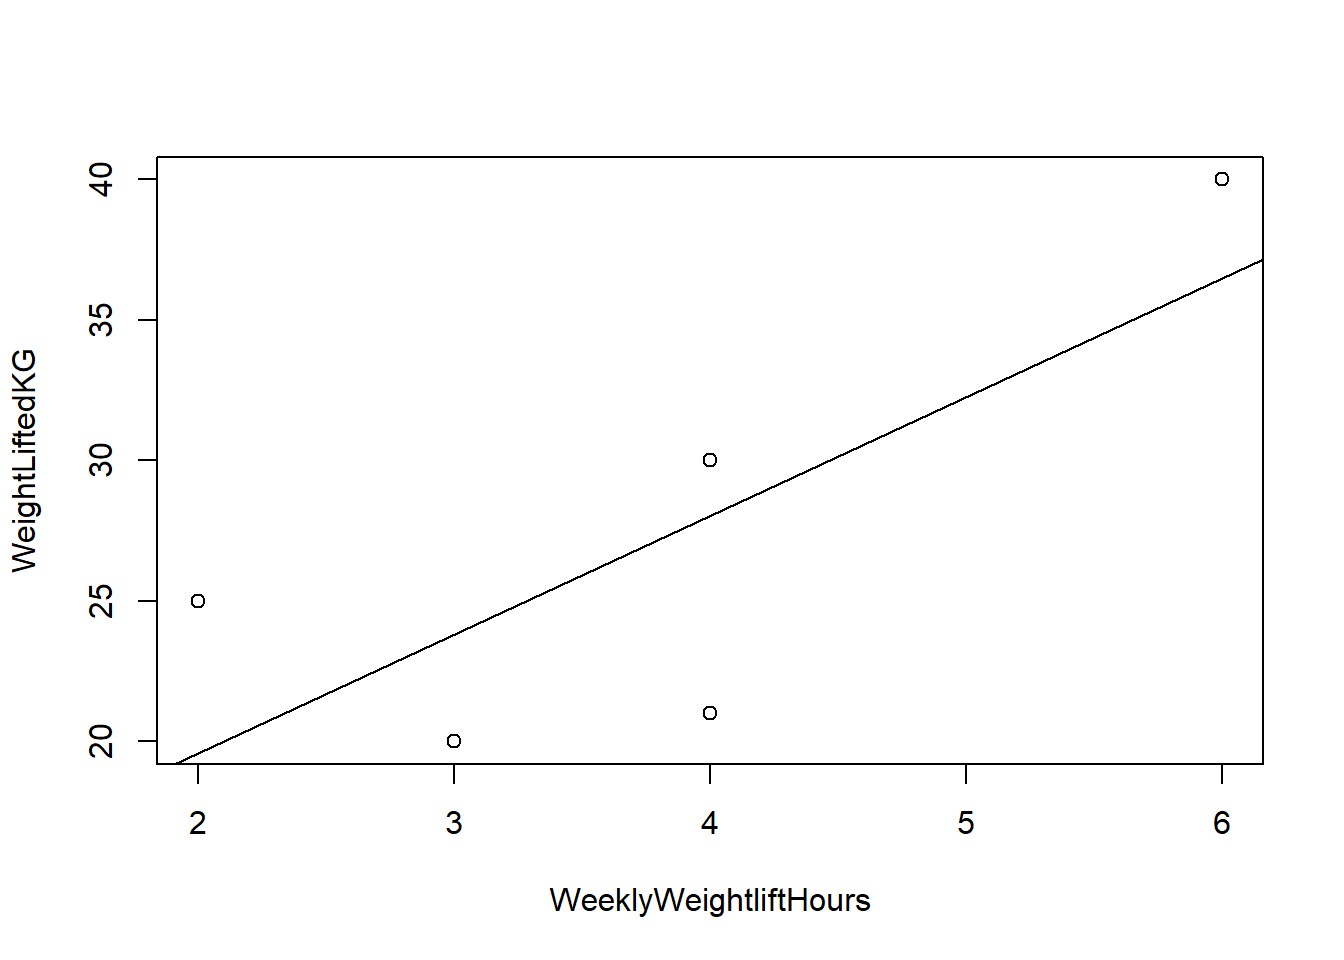
Task 3: What is the correlation coefficient for WeightLiftedKG and WeeklyWeightliftHours? Show all of your work/calculations.
The following resources can help you calculate correlation:
- wikiHow Staff. How to Find the Correlation Coefficient. wikiHow. March 29, 2019. Click here.
- Calculating correlation coefficient r. July 11 2017. Khan Academy. Click here.
- Benedict K. The Correlation Coefficient - Explained in Three Steps. May 1 2014. Click here.
The answer is 0.77. You still need to make sure you do and display the work correctly, even though you now know the correct answer.
And here’s what it looks like visually:
Now let’s look at the linear regression output for this data:
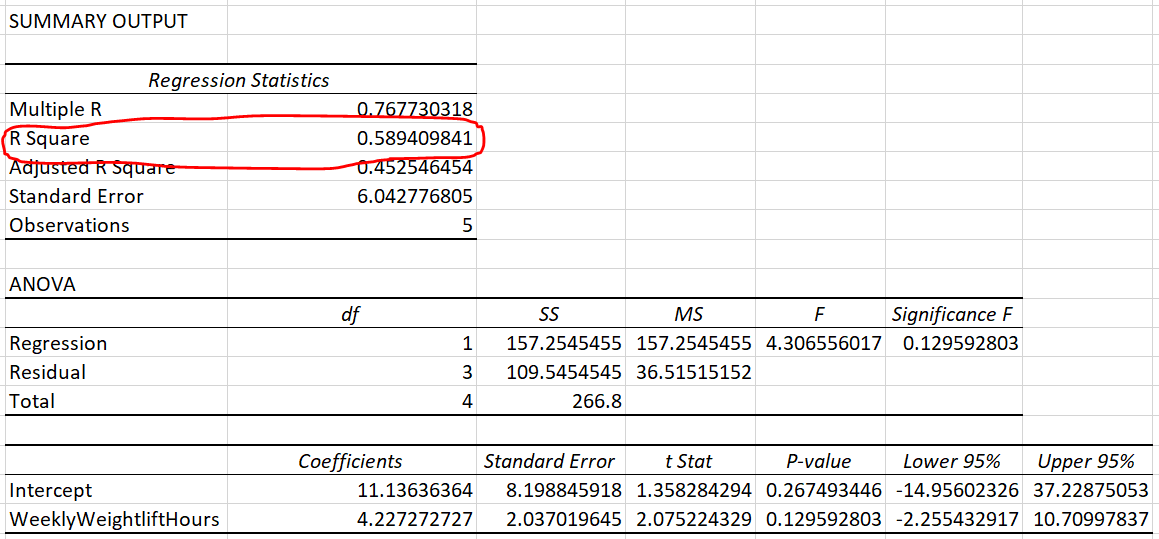
Linear regression result, from Excel
Circled in red, you’ll see R Square is 0.5894. This is the square of the correlation we calculated earlier. See?
\[0.7677^2 = 0.5894\]
R Square can also be written as \(R^2\), R^2, R-squared, or multiple R-squared. It is a measure of how well a regression model fits the data.
Now let’s look at some other data called fitness2 which is less correlated:
| Name2 | WeeklyWeightliftHours2 | WeightLiftedKG2 |
|---|---|---|
| Person F | 3 | 20 |
| Person G | 4 | 30 |
| Person H | 4 | 21 |
| Person I | 1 | 20 |
| Person J | 3 | 35 |
In the fitness2 data above, the two variables of interest are correlated at 0.33.
Here it is visually:
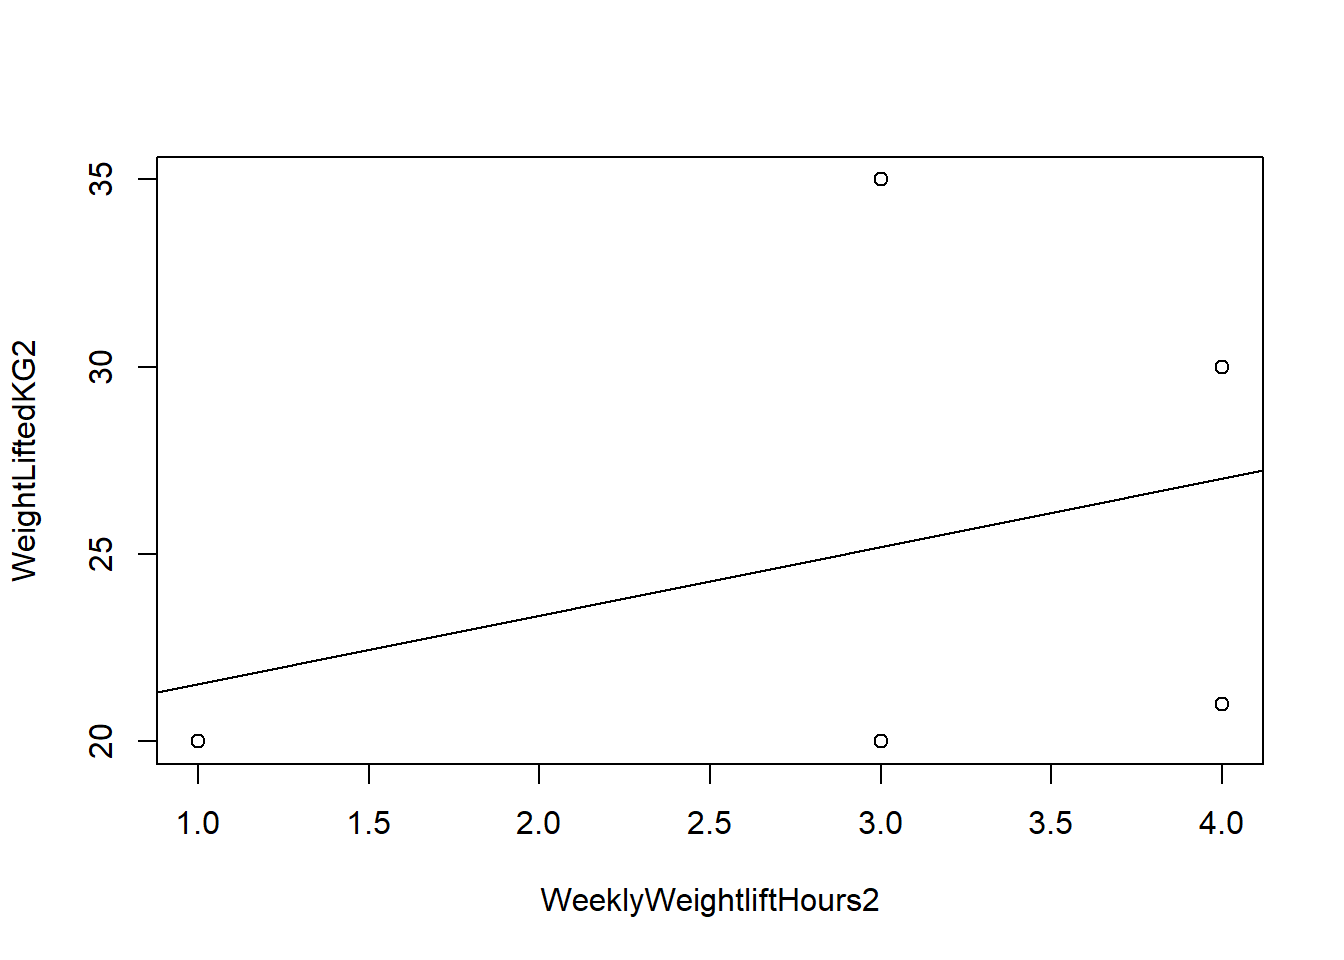
Above (fitness2 data), the two variables are much less correlated with each other than they were in the fitness data before.
Task 4: What would the \(R^2\) be in the regression output for the linear regression on these two variables in the fitness2 data? Don’t forget that you just learned an easy way, above, of how to figure this out without running a regression model.
Now we’re going to learn more about the regression output. First, watch the following video for a review, if you would like:
- Interpreting computer regression data. July 12 2017. Khan Academy. Click here.
Let’s step back and think about why we do regressions. Of course, we do them to see if the dependent variable and independent variables are associated with each other statistically, but we also do them to find out if the trends that we see in our data are (or are not) similar to those in the population at large.
Consider the datasets above about weightlifting. Let’s say we wanted to know about the hours spent lifting and weight lifted in Boston. So then people in Boston would be our population of interest. The five people in the fitness dataset are five people that we surveyed out of this population. These five people are our sample. These are important terms to remember. Our goal is to use the sample (the data that we do have) to learn whatever we can about the population as a whole.
When we did the regression above, we found that an additional hour of weightlifting is associated with an additional 4.227 predicted additional kilograms of weight lifted. But that’s only for our sample of five people. What about all of Boston? That’s where inference comes in. Inference is when you use your sample to attempt to figure stuff out about your whole population. And this is what the Standard Error, t Stat, P-value, Lower 95%, and Upper 95% in the regression output are all about.
To reiterate, we have our regression line for the five people. You saw this line drawn in the scatterplot earlier when we were talking about correlations. But what would the line look like for the entire population of Boston? Would it look the same or would the slope be different? If we want to know the true slope of the regression line in the population in all of Boston (the statistical relationship between hours spent lifting and weight lifted), we have to look at the other columns of the regression output and use inferential statistics.
Inferential statistics tell us how similar (or not) our sample of five people is to the entire population from which it was drawn (which in this case is the population of Boston, we are pretending).
First, watch the videos and skim the pages below. In some places, the slope of the regression line is referred to with the Greek letter beta. Just keep in mind that this just means the slope of the line.16
- Dave Your Tutor. Simplest Explanation of the Standard Errors of Regression Coefficients - Statistics Help. August 23 2015. Click here.
- Interpreting Regression Output. Princeton University Library. Click here.
- Jim Frost. How to Interpret P-values and Coefficients in Regression Analysis. Click here.
- How To Interpret Regression Analysis Results: P-Values & Coefficients? April 11 2017. Statswork. Click here.
When we do a regression and get an estimate of a slope of the relationship between Y and X, there are two possibilities:
In the population from which the sample is drawn, there is no true relationship between Y and X. The slope is 0. As you have more or less of X, Y doesn’t change at all. This is called the null hypothesis.
In the population from which the sample is drawn, there is a true, non-zero relationship between Y and X. This is called the alternative hypothesis.
If the p-value of your regression estimate is less than 0.05 (or 5%), then (assuming your regression meets other conditions that we will discuss later) you can conclude that Scenario #2 above is correct and that the estimate is trustworthy for the population. In statistical jargon, this is called rejecting the null hypothesis because our analysis had sufficient evidence to make us 95% certain that the alternate hypothesis is true. 1-p = level of certainty about the alternate hypothesis.
Now look again at this regression output:
Linear regression result, from Excel, once again
Task 5: In the output above, what is the p-value for the WeeklyWeightliftHours coefficient (estimate) of 4.227? What does this p-value mean for the question of whether the true population regression line also has a slope of 4.227?
Task 6: In the output above, what do we get when we divide the coefficient for WeeklyWeightliftHours by its standard error?
Now we will turn to the 95% confidence interval for the relationship between WeightLiftedKG and WeeklyWeightliftHours in the population (not just our sample of five people). This is where the Lower 95% and Upper 95% columns in the regression output become relevant. I argue that these are the two most important pieces of information in the entire regression output, in addition to \(R^2\).
Task 7: The computer is approximately 95% confident that the slope of the relationship between WeightLiftedKG and WeeklyWeightliftHours in the population (not just our sample of five people) is no lower than what number?
Task 8: The computer is approximately 95% confident that the slope of the relationship between WeightLiftedKG and WeeklyWeightliftHours in the population (not just our sample of five people) is no higher than what number?
Task 9: Looking at your answers to the last two questions, what is the 95% confidence interval of the relationship between WeightLiftedKG and WeeklyWeightliftHours in the entire Boston population (not just our sample of five people)?
Finally, look at this regression table.17 For the regression model on the right (labeled #2), there are three independent variables. The unit of observation is the car. The dependent variable is Price of the car in dollars.
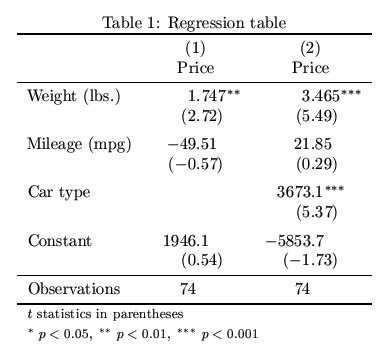
Task 10: For each of the three independent variables, in the table above, explain what this regression table tells us about the relationship between that independent variable and the dependent variable. Make sure you give a separate explanation for each variable and that you take into consideration the standard error and p-value of each estimate.
Note that the relationship(s) of interest for the regression table above can be drawn like this:
The diagram above reminds us that we are interested in the following associations/relationships (and none others) when we look at the regression results above:
Price of carandWeightPrice of carandMileagePrice of carandCar type
We are always interested in the relationship between the dependent variable (Price of car) and each independent variable, in a pair-wise manner. We are not interested in the relationship among the independent variables. That’s why each line in the list above starts with the dependent variable and then ends with a different independent variable. This will become more intuitive to you as you look at more regression results.
You have reached the end of the assignment.
3.2 In class
3.2.1 Schedule
October 28 2021
1:00 p.m. – Brief introduction
1:05 p.m. – Quantitative activity in groups of 2
1:35 p.m. – Qualitative activity (first in subgroups of your team based learning teams to code your transcripts; then as a whole team based learning team to compare coding results). Anshul will interrupt each team for 15 minutes to review the quantitative activity (Anshul will visit each team for 15 minutes, one after the other).
2:50 p.m. – End of class
3.2.2 Quantitative Activity
Please do this activity in groups of 2. Even though you are working in groups, each student should do the tasks below on their own computer.
In your assignment due today, we looked again at the fitness dataset, copied here:
| Name | WeeklyWeightliftHours | WeightLiftedKG |
|---|---|---|
| Person A | 3 | 20 |
| Person B | 4 | 30 |
| Person C | 4 | 21 |
| Person D | 2 | 25 |
| Person E | 6 | 40 |
We did the following linear regression on this data:
Linear regression result, from Excel
We can write down the equation for this line, which we can figure out from the regression table above:
\[WeightLiftedKG = 4.227*WeeklyWeightliftHours + 11.136\]
This is the same as writing:
\[y = 4.227x + 11.136\]
What is the predicted value (also called fitted value) of WeightLiftedKG for Person A? To get this, we have to plug the value of the independent variable(s)18 into the regression equation above:
\[WeightLiftedKG = 4.227*3 + 11.136 = 23.8\]
Our regression model predicts that someone who weightlifts for three hours per week is capable of lifting 23.8 kilograms. But in reality, the person in our data (Person A) who weightlifted for three hours per week can truly only lift 20 kilograms. So there is some error in our regression model! The error for Person A is \(20-23.8 = -3.8\). This is called Person A’s residual.
Task 11: Calculate the residual for the other four people in the data.
When we ask the computer to do a linear regression, it finds the regression line that makes the residuals as small as possible. This process is called OLS (ordinary least squares) linear regression. OLS is a term that you might hear statistics people say.
Let’s look again at the correlation of WeightLiftedKG and WeeklyWeightliftHours, as you already did in your homework assignment:
## [1] 0.7677303And now let’s look at the correlation between the fitted values and the actual values of the dependent variable in our regression:
## [1] 0.7677303It’s the same!! So the correlation of the predicted and actual values of the dependent variable always tells us how well our regression model fits the data.
The square of the correlation above is equal to the R-squared in our regression output above!
A higher value means that the regression model fits the data better.
Remember:
Correlation tells us how related the data are to each other. If the data are highly correlated, we can likely use X to predict Y. And the data points (the dots) on the scatterplot will appear to be pretty linear. If the data are not highly correlated, the data will appear more dispersed and you may not even be able to tell what the relationship is between X and Y just via visual inspection.
Slope is the predicted relationship between X and Y. Slope is the steepness of the regression line.
In the assignment you completed before today’s class, you were given the regression output by me. Now, you will practice generating it on your own!
Task 12: Copy and paste the data below into Excel.
Copy and paste this data into Excel:
| Name | WeeklyWeightliftHours | WeightLiftedKG |
|---|---|---|
| Person A | 3 | 20 |
| Person B | 4 | 30 |
| Person C | 4 | 21 |
| Person D | 2 | 25 |
| Person E | 6 | 40 |
Task 13: Run the regression on your own computer in Excel. The image below may help you do this. Be sure that you have selected the Residuals option.
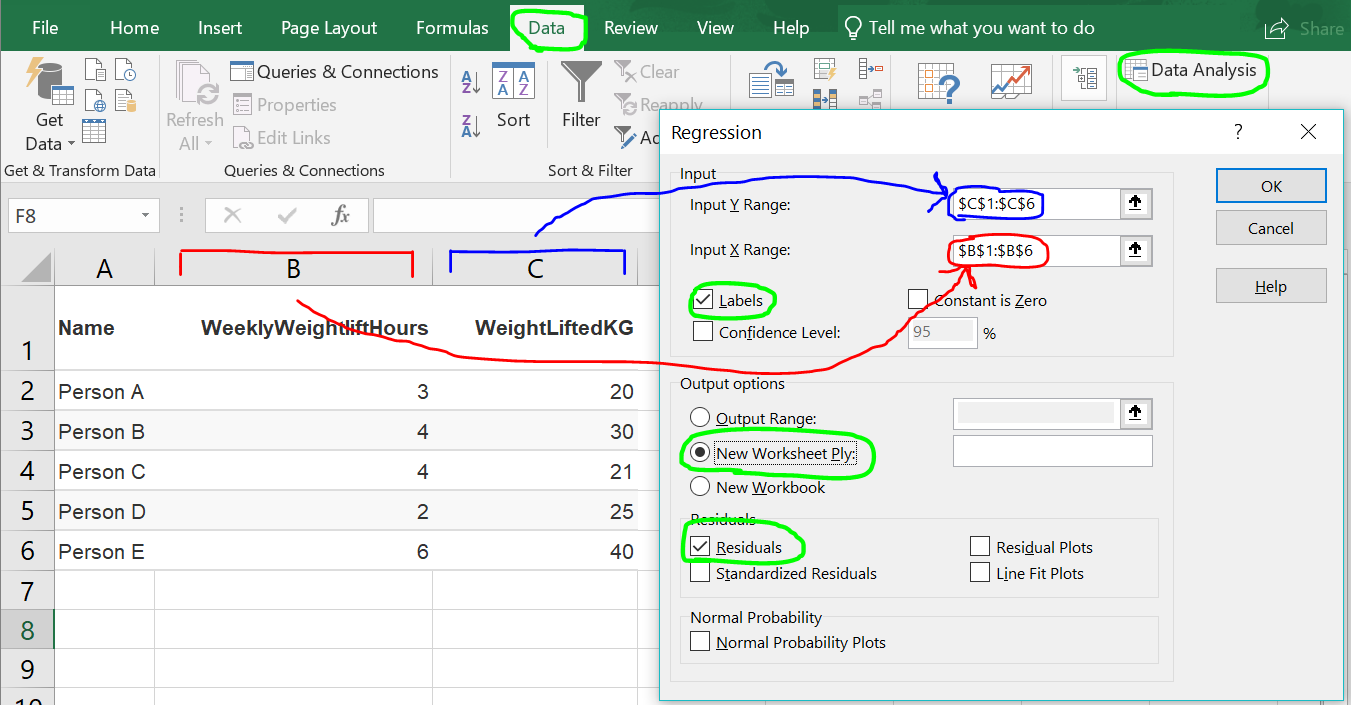
How to configure your OLS linear regression in Excel
Task 14: Double-check to make sure that your regression output is the same as the output I displayed above. You may need to reformat the columns a bit to make it more readable.
Task 15: Scroll to the bottom of your regression output. You should see a list of residuals in the RESIDUAL OUTPUT section. The computer should have calculated a residual for each observation (person) in your data. Do these calculated residual values match the residual values that you calculated yourself earlier in this activity? (They are supposed to match).
Please come back to the main Zoom room and/or alert Anshul when you have completed this activity.
3.2.3 Qualitative Activity
As a reminder, here are the research questions and pairings for our practice qualitative research project:
| Team | Research question | Team being studied |
|---|---|---|
| Locus Pocus | What are certain coping methods used to combat the challenges faced by first-year genetic counseling students? | Nucleo-tides |
| Nucleo-tides | What are some of the factors prospective GC students consider when ranking different programs? | Locus Pocus |
| Genie Beanies | What is the impact of childhood experience of genetic counseling students on wanting to become a genetic counselor? | MJK: Master Jenetic Kounselors |
| MJK: Master Jenetic Kounselors | What was your experience as a prospective student interviewing for genetic counseling graduate programs that use a holistic admission method? | Genie Beanies |
Today, you will work in groups of two or three for this qualitative activity, with other members of your own team. This likely means that within each team there will be a group of three and a group of two. Each person in your group should have come to class with a transcript of at least 15 minutes of an in-depth interview pertaining to your research question.
Task 16: Working together, code each of the transcripts in your small group (containing two or three people). Do one transcript at a time. Use Microsoft Word or a similar word processor19 and put the codes in comments on the side. Highlight sections of text and then add the codes into comments that refer to that text. Some tips and information about qualitative coding is below.
This is not necessarily a quick process, which is fine. Do not rush your coding of the transcripts.
Be sure to think about your research question and how what you are reading relates to it, as you code your transcripts. The whole purpose of this qualitative project is to answer your research question.
Skim the following resources as fast as you can:
- Skim just the five-step process in this article: Yi, Erika. Themes Don’t Just Emerge — Coding the Qualitative Data. July 23 2018. Medium. Click here.
- Only pages 3–5 in Chapter 1 (start at the section called “What is a Code?”): “An Introduction to Codes and Coding” in Saldaña, J. (2015). The coding manual for qualitative researchers. Sage. Click here.
Most of the time, a section of text will just have one or no codes assigned to it, but a section may have multiple codes in some cases, which is fine.
You will be using inductive, rather than deductive codes. This means that you do not know the codes you want to use beforehand. Instead, you will let the data “tell” you which codes to use.
These resources would be good to look at later, if you want, regarding coding qualitative data:
- Elliott, V. (2018). Thinking about the Coding Process in Qualitative Data Analysis. The Qualitative Report, 23(11), 2850-2861. Retrieved from here. PDF: Click here.
- Qualitative coding. cessda Training. Click here.
Task 17: For each transcript, make an inventory of all of the codes you used and—for those that aren’t self-explanatory—what they mean. If you are in a group of three, you will end up with three such lists of codes, one list for each transcript. You may find it easier to make this inventory of codes as you code the interview rather than at the end.
Task 18: Reconvene with your entire team-based learning team of five people.20 You will have five sets of codes from five transcripts. Compare the lists of codes to each other. Which codes appear in many or multiple interviews? Which codes only appear in one interview? Answering these questions will help you understand whether these five interviewees all agree about some topics, if they fall into two or more groups/viewpoints/camps regarding an issue, or if you simply do not have enough information yet to draw conclusions (which would be highly reasonable since you only interviewed five people).
Task 19: Working as a group of five (your entire team-based learning team), quickly create a short memo or bullet-list of a) what you learned so far about your research question and b) what you would need to investigate further or follow-up about, if you were doing more interviews.21
Task 20: Email this memo to akumar@mghihp.edu and make sure that all members of your team are copied on the message. Please put “GC621 Qualitative Project Coding Memo - [Team name]” in the subject line.22
If you finish this activity early, please inform Anshul.23
Remember that a variable is another name for a column of data. Just a set of measured/collected numbers or characteristics.↩︎
We have also referred previously to the slope as m (as in mx+b), \(b_1\) (as in \(b_1x + b_0\)), coefficient, and coefficient estimate.↩︎
In this case there’s only one.↩︎
Typically we would use a coding software that is specifically designed for qualitative coding, but I decided not to have you do that for now just to save time.↩︎
If you are participating in the class in a virtual setting, you may need to request that an instructor moves you from one breakout room to another↩︎
You’re not actually going to do more interviews for this class project, but in a real research project that’s what you would do!↩︎
One team member should do this on behalf of the whole team.↩︎
If you are participating virtually and you are in a breakout room, please come back to the main meeting room at this time.↩︎