Chapter 6 Final Words
For it’s own sake, knowing how to properly scale the charts for visualization or using the linear parameteric approach- determining the sign of the slope of the trend line whether positive or negative, could be a real time saver and a true champion in the area of accuracy for determining whether KPI trends have degraded or improved.
This could also very much play at the heart of a killer app, especially for teams or departments who are on the close watch of their BSC targets - where every variation in the KPI trend must be accounted for.
Lastly, if the principle is adopted on a large scale, enterprise grade automation project, the time savings and the accuracy of this one liner code should send shockwaves to the teams committed to agile practices.
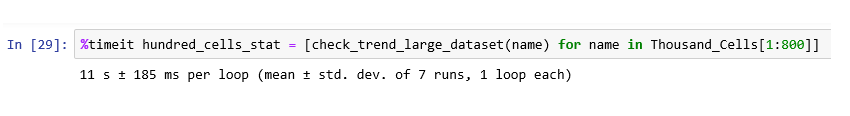
(It’s a code tested to run over 800 cells to check the KPI trend with a run time of 11s)