Chapter 5 Applications
Some significant applications are demonstrated in this chapter.
5.1 Improving the Excel Visual
See the suggested transformation and use of the trendline. You can optionally show the trendline equation by changing the settings at the trendline options.
![]()
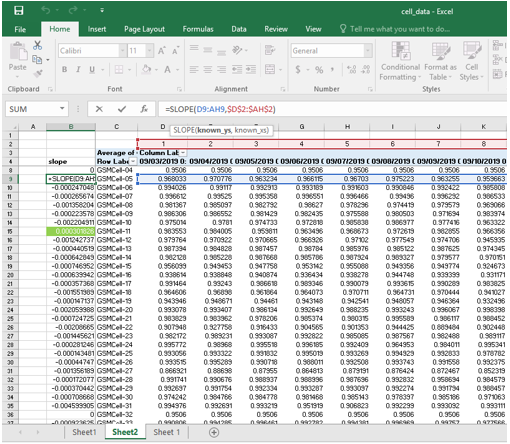
5.2 Slope Function in Excel
You can set up your data and use the Slope Excel function on an additional column just beside your pivot table.
\[m=SLOPE(known ys,known xs)\]
Note that for the parameter knownxs I have to introduce on top of the table a range of Integers 1:30 to represent the 30 days of the month.
The sample data is available for download here.