Secchi Depth
Interagency Ecological Program Spring Season report
Background
- Organisms in this ecosystem are adapted to high turbidity conditions, and reductions in turbidity can have many negative ecological effects.
- Higher values for Secchi depth indicate lower turbidity.
- Secchi depth is measured monthly by DWR’s Environmental Monitoring Program by dropping a black-and-white disk in the water until it disappears.
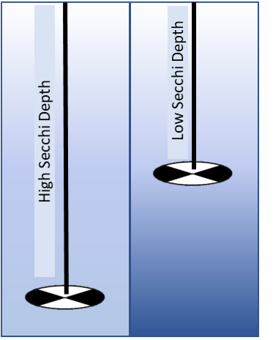
Figure 2: image of a secchi disk
Secchi Depth by Region
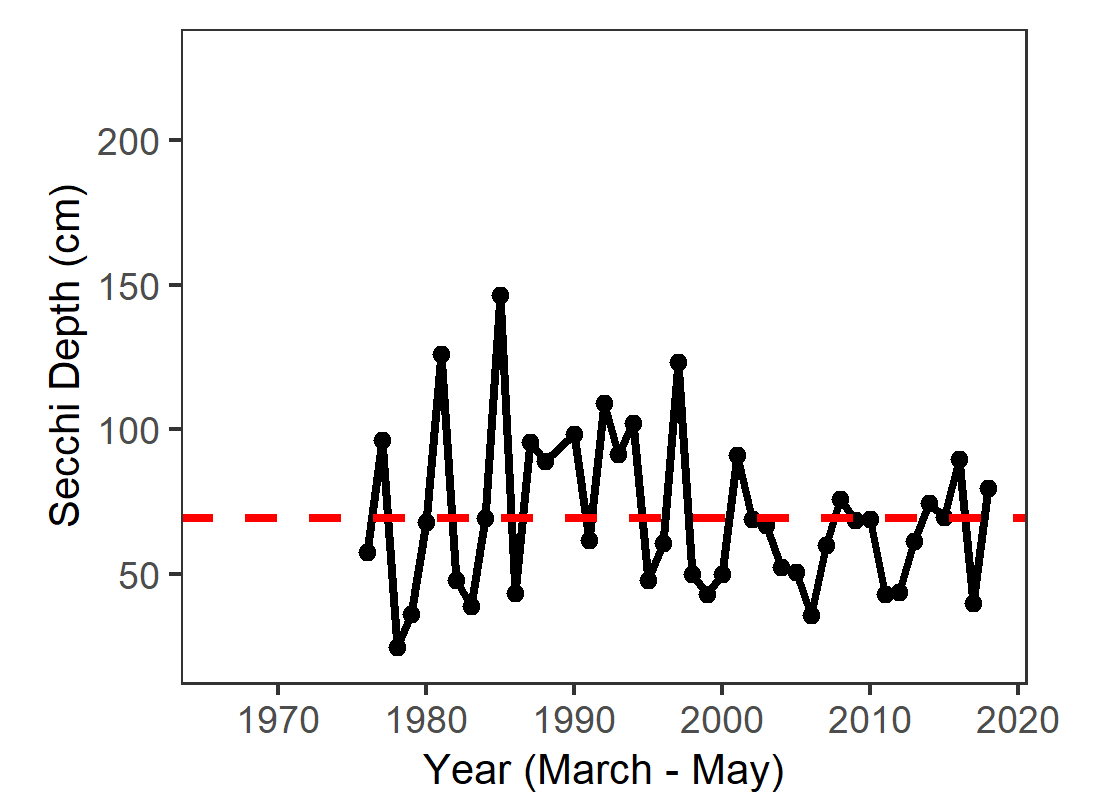
Figure 3: Graph of average spring secchi depth in San Pablo Bay from 1975 to 2018. Values range from 10 to 150.
In 2018, San Pablo bay was close to the long-term average.
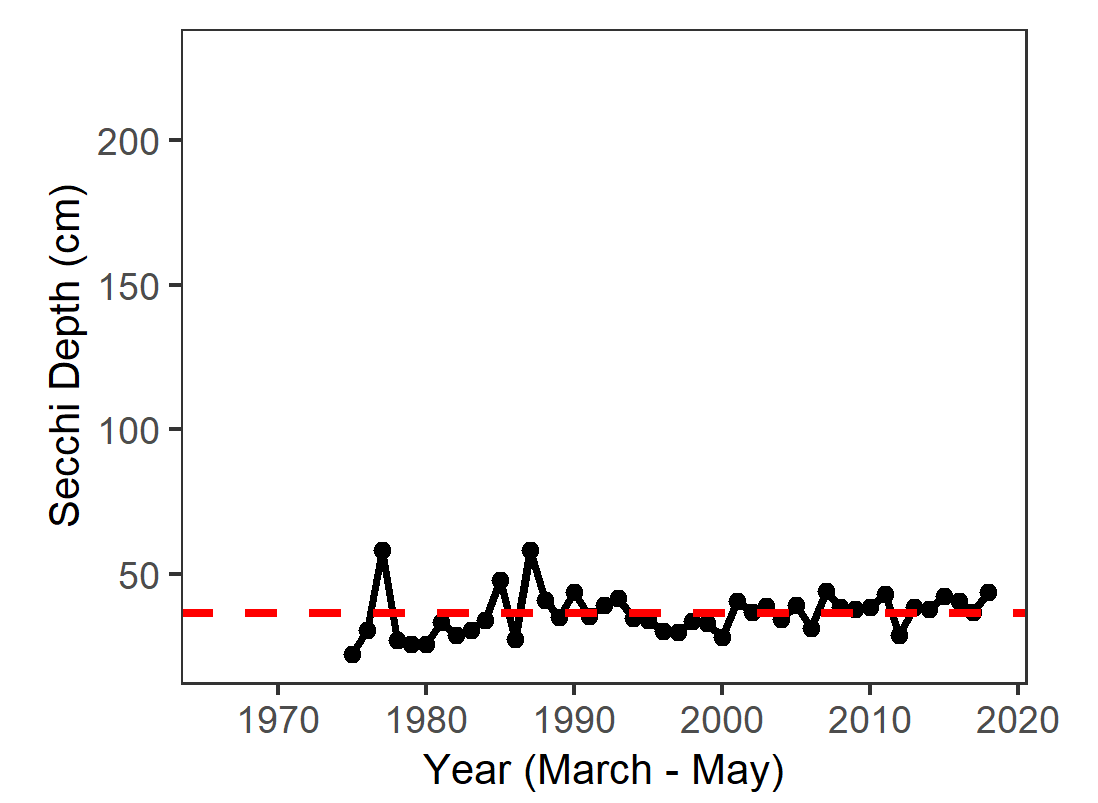
Figure 4: Graph of average spring secchi depth in Suisun from 1975 to 2018. Values range from 10 to 60.
In 2018, Suisun Bay was also close to the long-term average
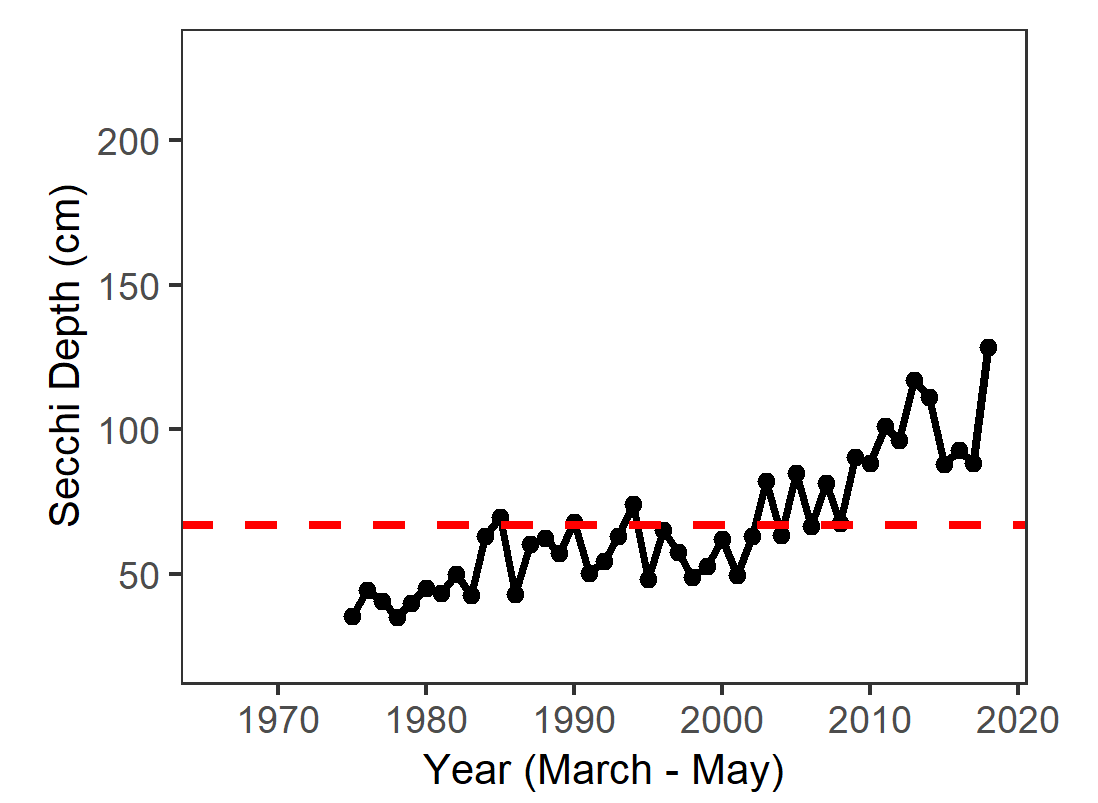
Figure 5: Graph of average spring secchi depth in the Delta from 1975 to 2018. Values range from 25 to 120 and have been increasing since the year 2000.
In 2018, the Delta was much clearer than average, the clearest Spring on record.
For more information see: Schoellhamer, D. H. 2011. Sudden clearing of estuarine waters upon crossing the threshold from transport to supply regulation of sediment transport as an erodible sediment pool is depleted: San Francisco Bay, 1999. Estuaries and Coasts 34(5):885-899.