Chlorophyll
Interagency Ecological Program Spring Season report
Background
- Chlorophyll is an indicator of phytoplankton production, which is low during the Spring.
- Phytoplankton are the base of the pelagic food web. It is sampled monthly by DWR’s Environmental Monitoring Program.
- The invasion of the clam Potamocorbula amurensis caused a decline in phytoplankton and zooplankton after 1986 – especially in Suisun Bay.
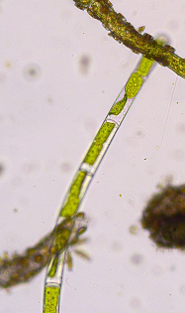
Figure 10: picture of phytoplankton
Average Spring Chlorophyll by Region
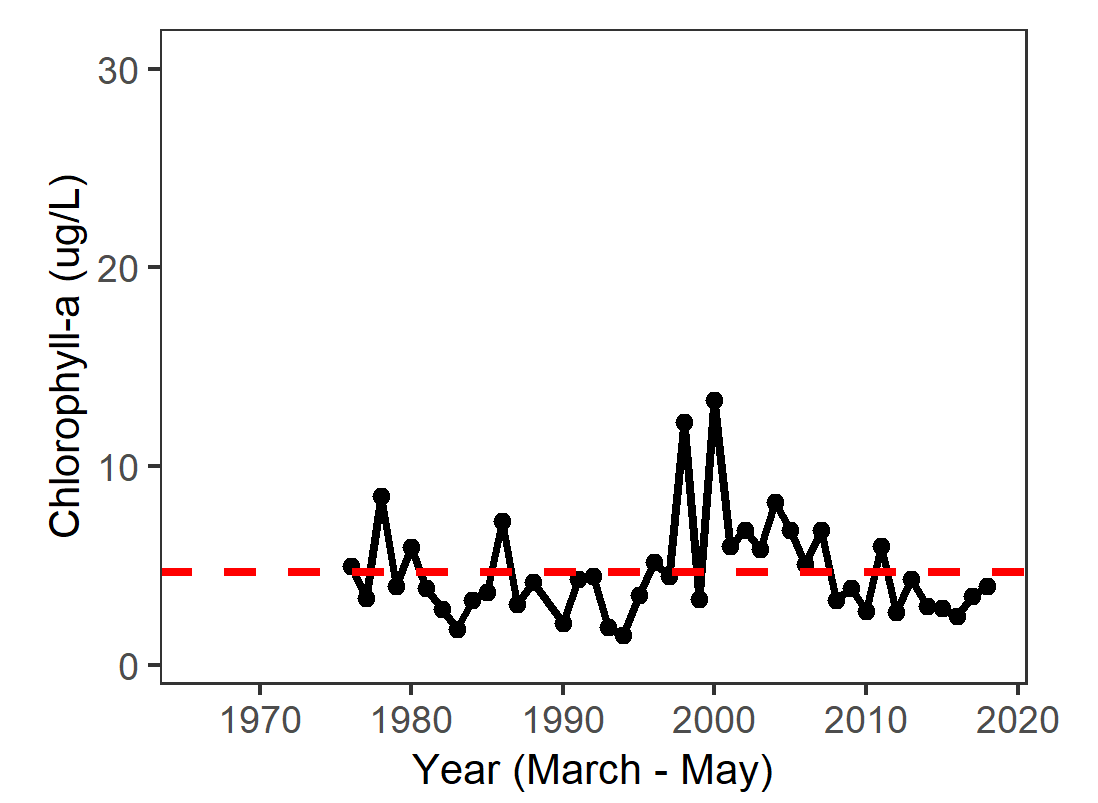
Figure 11: Graph of average spring chlorophyll in San Pablo Bay from 1975 to 2018. Values range from 4 to 15.
In 2018, San Pablo Bay chlorophyll was similar to the long-term average.
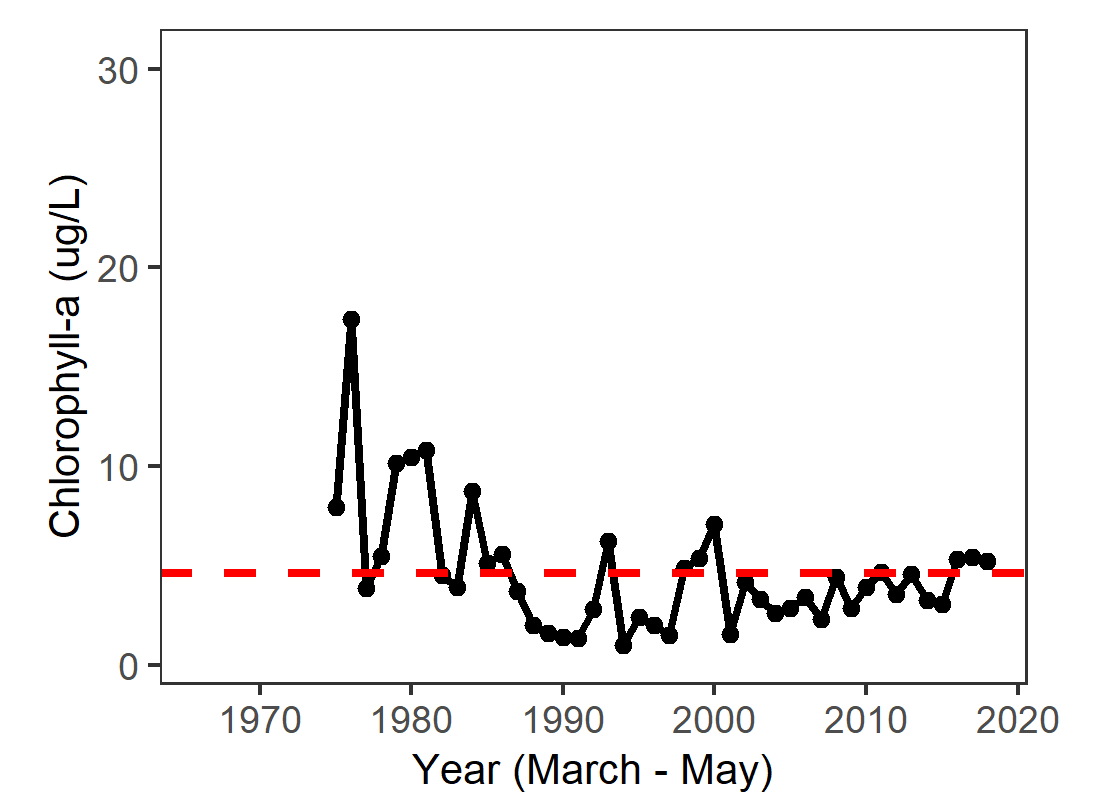
Figure 12: Graph of average spring chlorophyll in Suisun from 1975 to 2018. Values range from 2 to 19.
In 2018, Suisun Bay chlorophyll was also about average.
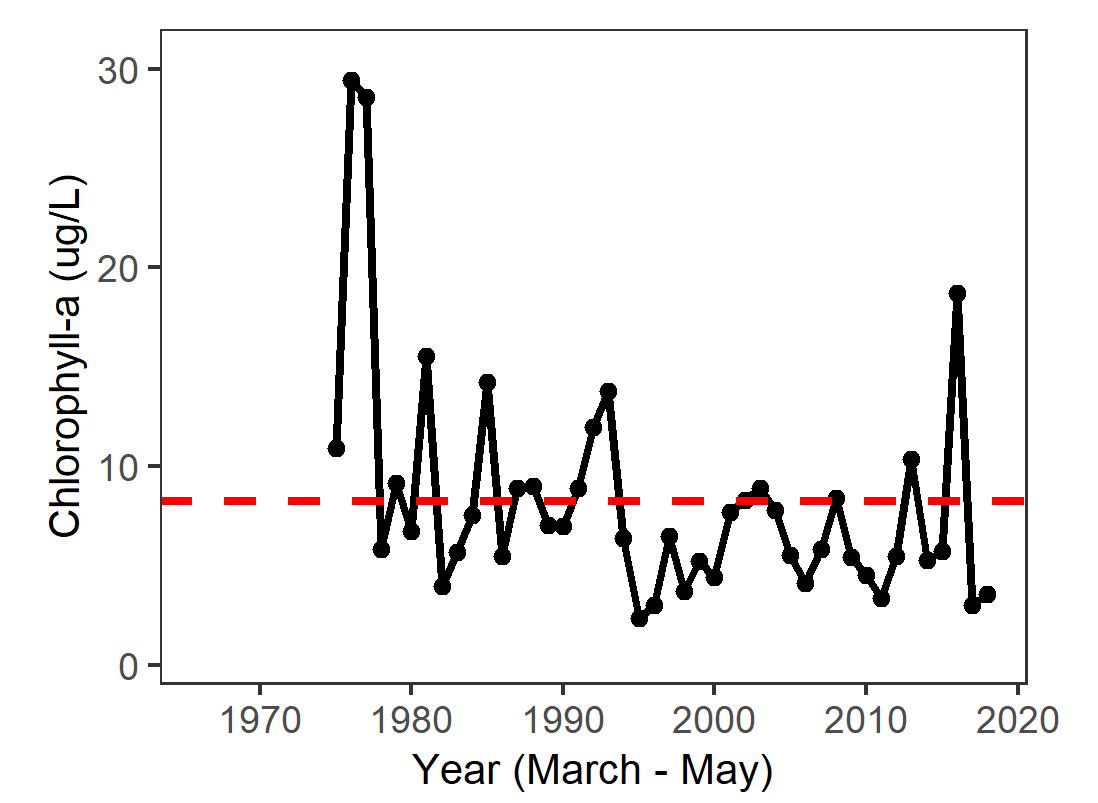
Figure 13: Graph of average spring chlorophyll in the Delta from 1975 to 2018. Values range from 3.5 to 29.
In 2018, the Delta had lower clorophyll than average.
For more information see: Cahoon, T. and T. Brown. 2018. Phytoplankton, Chlorophyll-a and Pheophytin-a Status and Trends 2017. IEP Newsletter 32(1):14-20.