Chapter 5 How many respondents are enough?
It’s common to think: “We surveyed everyone in this department, therefore the results we see must be correct.” However, how people responded to surveys depends on many factors—such as mood the date the survey is taken, recent events in life and in work, changes in organizational structure, and any number of other factors—and many internal surveys are given only once a year. Thus, survey results are really a sample of attitudes and opinions, subject to random events and natural fluctuations.
Typical practice at some companies is to expose summary results for groups with six or more people. While this helps preserve some anonymity, it does not include enough responses to ensure the overall response is stable. Comparisons over time or across groups that are not based on stable results can lead to conclusions about differences that may or may not reflect reality.
In this context, stable means that the data accurately represent true changes (or lack of change) in the question at hand. It’s basically impossible to distinguish natural variation from real change when you have small numbers of respondents. As a result, the National Center for Health Statistics, for example, does not publish results with less than 20 distinct cases or responses.
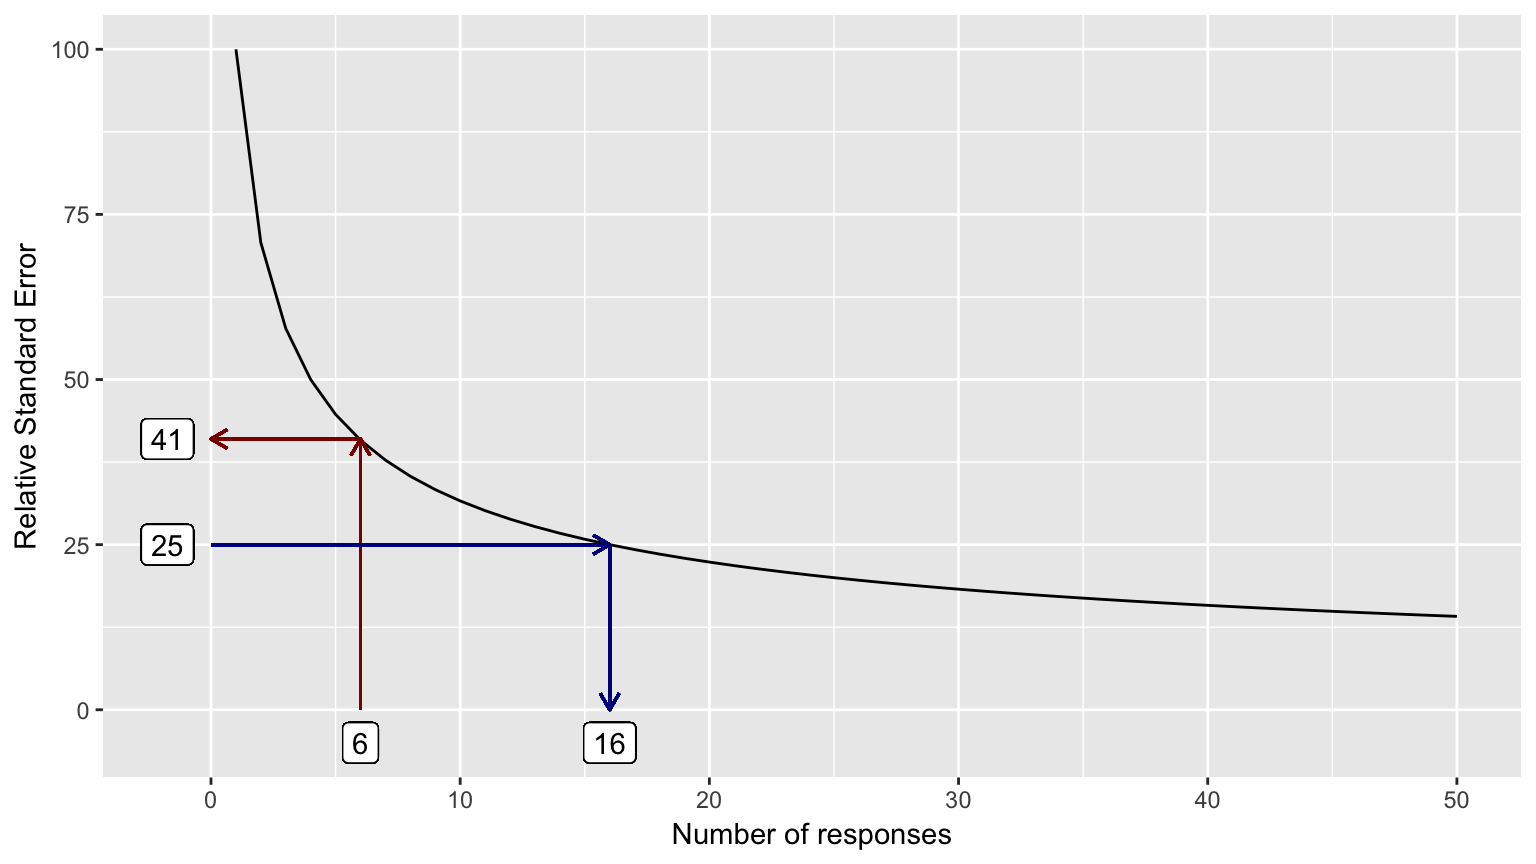
The relative standard error (RSE) is the metric used to evaluate whether you have enough values for the results to be stable. The standard error is an estimate of the likely difference between the results and the true value (which in surveys, even of complete populations, can’t be known exactly due to the reasons mentioned above). The relative standard error is the standard error expressed as a percent of the measure or number of responses, which is a constant function: \(\frac{1}{\sqrt{responses}} * 100\). This function can be seen in the graph on the next page.
Generally, you want RSE values less than 20-25% to have some confidence that your results are stable.
The RSE-response count function is shown in Figure 10. The RSE associated with the use of six responses is marked with dark red, and the response count associated with an RSE of 25% is marked with dark blue.
x = seq(1:50)
rse = data.frame(x = x, y = (1 / sqrt(x)) * 100)

# Figure 10
ggplot(rse, aes(x = x, y = y)) +
  geom_line() +
  geom_segment(aes(x=6, y=0, xend=6, yend=41), color="darkred", arrow = arrow(length = unit(0.25, "cm"))) +
  geom_segment(aes(x=6, y=41, xend=0, yend=41), color="darkred", arrow = arrow(length = unit(0.25, "cm"))) +
  geom_label(aes(x=6, y=-5), label = "6") +
  geom_label(aes(x=-1.75, y=41), label = "41") +
  geom_segment(aes(x=16, y=25, xend=16, yend=0), color="darkblue", arrow = arrow(length = unit(0.25, "cm"))) +
  geom_segment(aes(x=0, y=25, xend=16, yend=25), color="darkblue", arrow = arrow(length = unit(0.25, "cm"))) +
  geom_label(aes(x=16, y=-5), label = "16") +
  geom_label(aes(x=-1.75, y=25), label = "25") +
  xlab("Number of responses") +
  ylab("Relative Standard Error")