Chapter 2 Compare different model fits
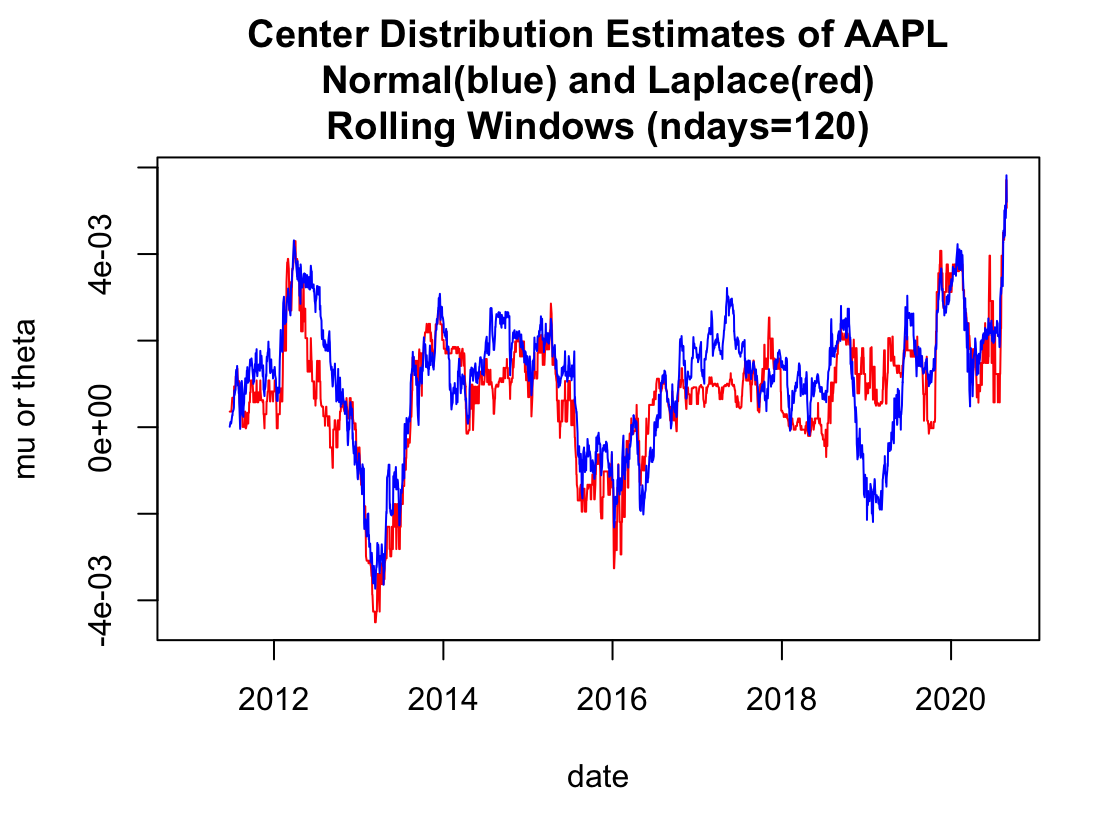
What is each point?
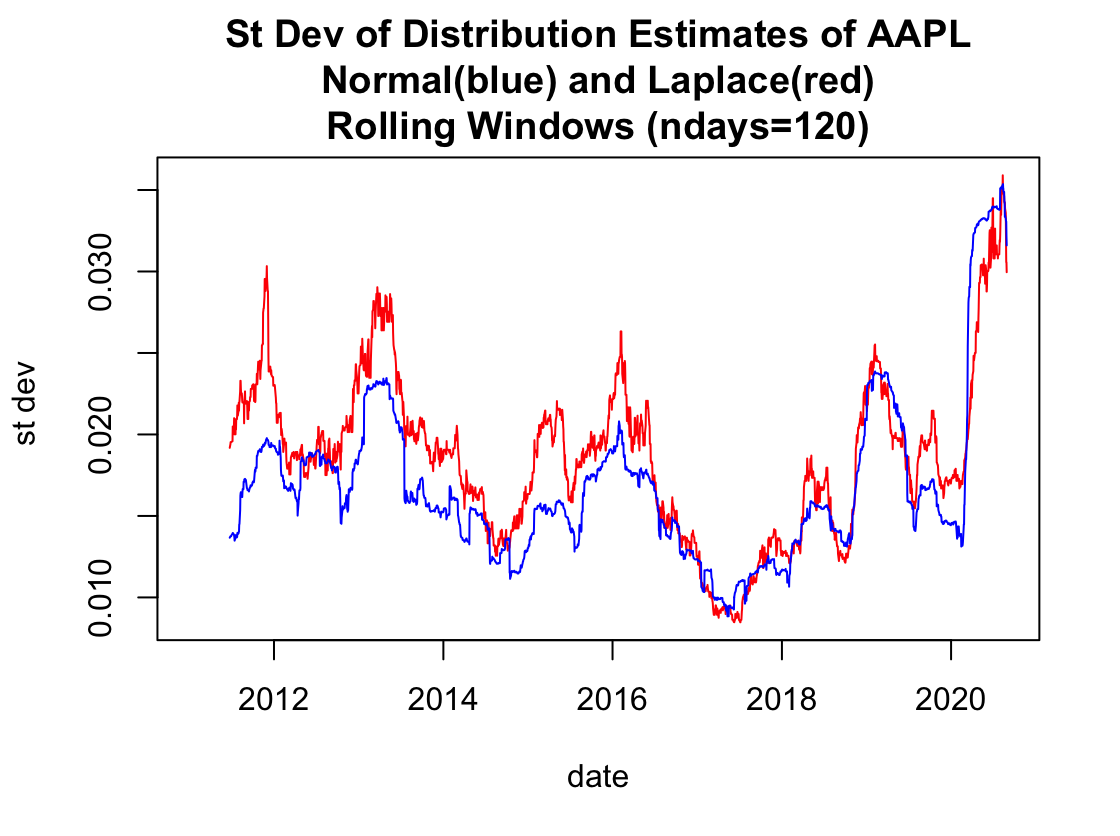
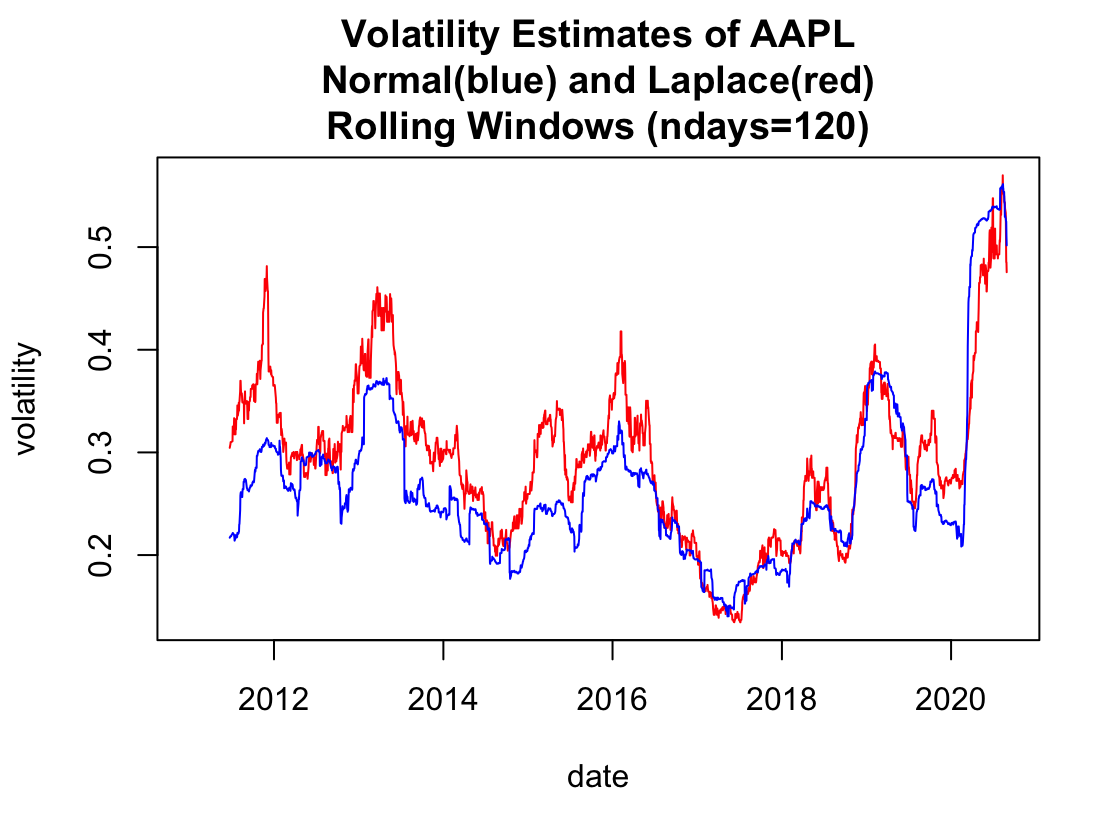
You will find that standard deviation is the same as volatility
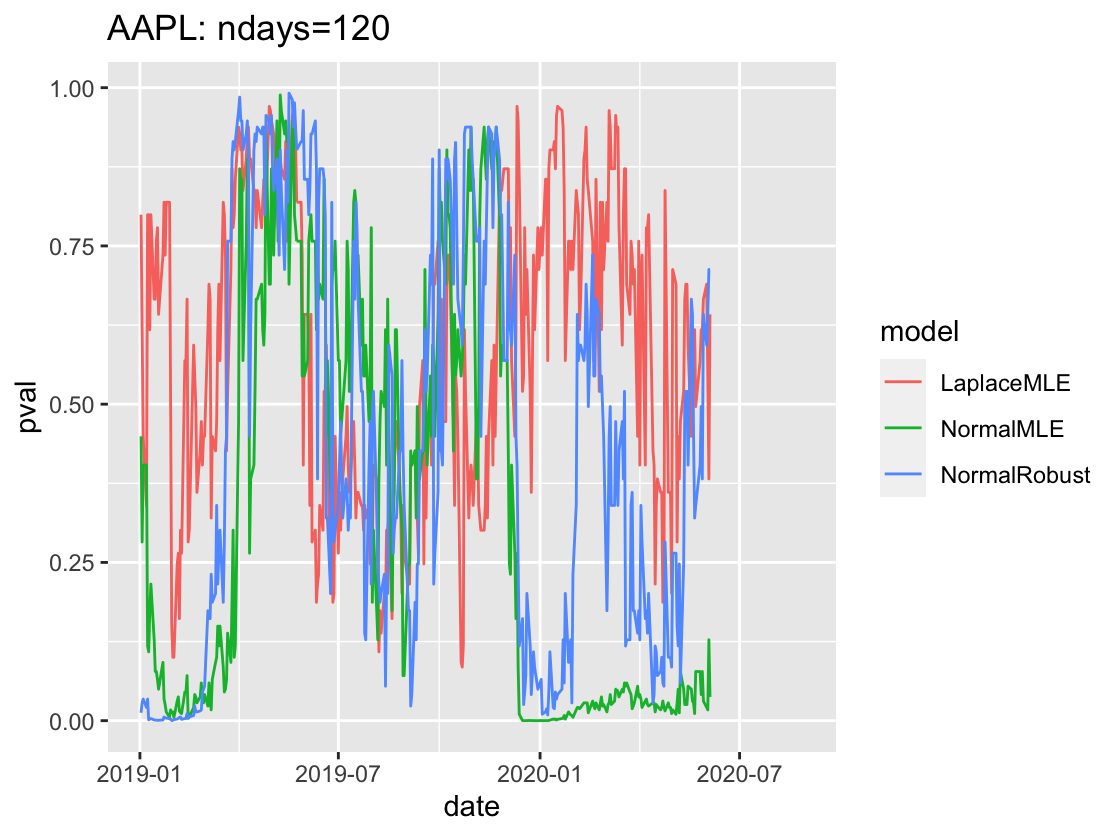
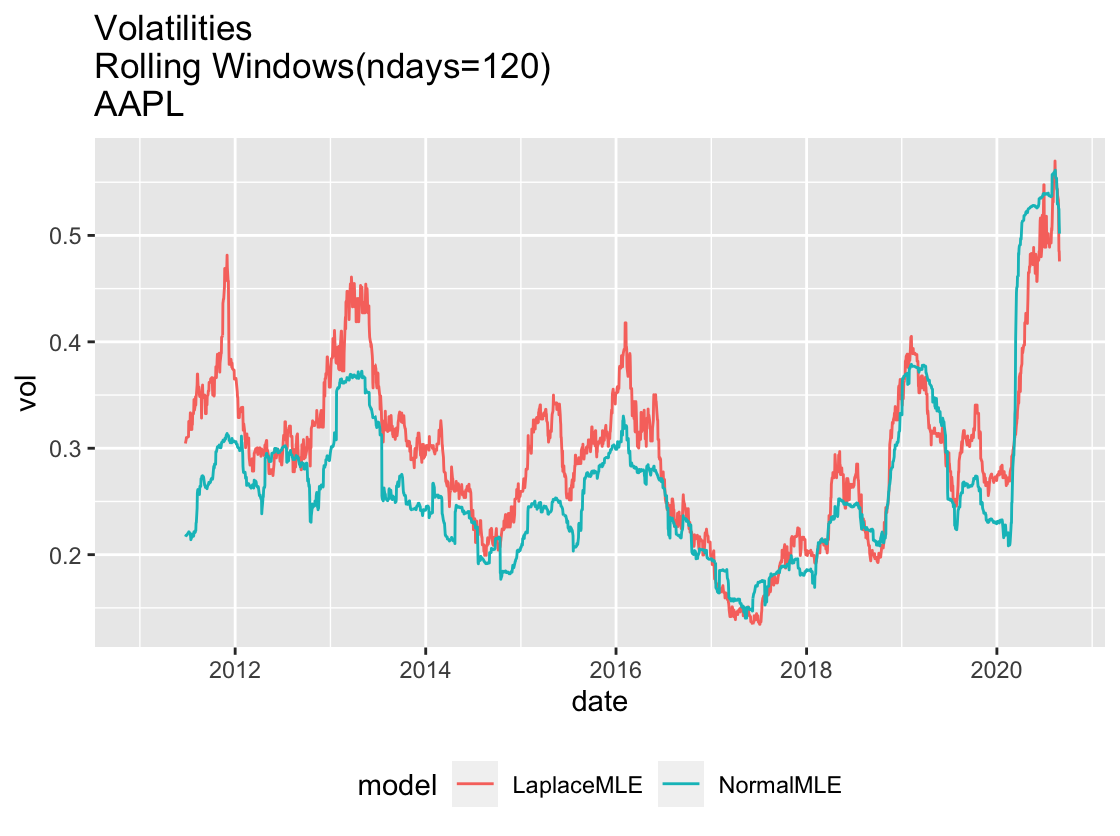
We can also use ggplot2 to create a better looking plot. The data is the same as previous one.
To see which model performs better, simply compare the p-value.