Chapter 4 From Victor SCHOTT (IES21199)
4.1 Code chunk 1 for HW1
4.1.1 head() is a function in base-R that display only the first 6 observations
head(iris)## Sepal.Length Sepal.Width Petal.Length Petal.Width Species
## 1 5.1 3.5 1.4 0.2 setosa
## 2 4.9 3.0 1.4 0.2 setosa
## 3 4.7 3.2 1.3 0.2 setosa
## 4 4.6 3.1 1.5 0.2 setosa
## 5 5.0 3.6 1.4 0.2 setosa
## 6 5.4 3.9 1.7 0.4 setosa4.2 Code chunk 2 for HW1
4.2.1 tidying the raw data into the tidy data using pivot_longer() and separate() functions in the tidyr package
library(tidyverse)## Warning: le package 'tidyverse' a été compilé avec la version R 3.6.3## -- Attaching packages --------------------## v ggplot2 3.3.2 v purrr 0.3.4
## v tibble 3.0.1 v dplyr 1.0.2
## v tidyr 1.1.0 v stringr 1.4.0
## v readr 1.3.1 v forcats 0.5.0## Warning: le package 'ggplot2' a été compilé avec la version R 3.6.3## Warning: le package 'tibble' a été compilé avec la version R 3.6.3## Warning: le package 'tidyr' a été compilé avec la version R 3.6.3## Warning: le package 'readr' a été compilé avec la version R 3.6.3## Warning: le package 'purrr' a été compilé avec la version R 3.6.3## Warning: le package 'dplyr' a été compilé avec la version R 3.6.3## Warning: le package 'stringr' a été compilé avec la version R 3.6.3## Warning: le package 'forcats' a été compilé avec la version R 3.6.3## -- Conflicts ---- tidyverse_conflicts() --
## x dplyr::filter() masks stats::filter()
## x dplyr::lag() masks stats::lag()iris %>%
pivot_longer(cols = -Species, names_to = "Part", values_to = "Value") %>%
separate(col = "Part", into = c("Part", "Measure"))## # A tibble: 600 x 4
## Species Part Measure Value
## <fct> <chr> <chr> <dbl>
## 1 setosa Sepal Length 5.1
## 2 setosa Sepal Width 3.5
## 3 setosa Petal Length 1.4
## 4 setosa Petal Width 0.2
## 5 setosa Sepal Length 4.9
## 6 setosa Sepal Width 3
## 7 setosa Petal Length 1.4
## 8 setosa Petal Width 0.2
## 9 setosa Sepal Length 4.7
## 10 setosa Sepal Width 3.2
## # ... with 590 more rows4.3 Code chunk 3 for HW1
4.3.1 transforming our data using group_by() and summarize() functions in the dplyr package
4.3.2 Because we created the Part variable in our tidy data,
4.3.3 we can easily calculate the mean of the Value by Species and Part
iris %>%
  pivot_longer(cols = -Species, names_to = "Part", values_to = "Value") %>%
separate(col = "Part", into = c("Part", "Measure")) %>%
group_by(Species, Part) %>%
summarize(m = mean(Value))## `summarise()` regrouping output by 'Species' (override with `.groups` argument)## # A tibble: 6 x 3
## # Groups: Species [3]
## Species Part m
## <fct> <chr> <dbl>
## 1 setosa Petal 0.854
## 2 setosa Sepal 4.22
## 3 versicolor Petal 2.79
## 4 versicolor Sepal 4.35
## 5 virginica Petal 3.79
## 6 virginica Sepal 4.784.4 Code chunk 4 for HW1
4.4.1 visualizing our data using ggplot() function in the ggplot2 package
iris %>%
  pivot_longer(cols = -Species, names_to = "Part", values_to = "Value") %>%
  separate(col = "Part", into = c("Part", "Measure")) %>%
  ggplot(aes(x = Value, color = Part)) + geom_boxplot()
You can label chapter and section titles using {#label} after them, e.g., we can reference Chapter 2. If you do not manually label them, there will be automatic labels anyway, e.g., Chapter 6.
Figures and tables with captions will be placed in figure and table environments, respectively.
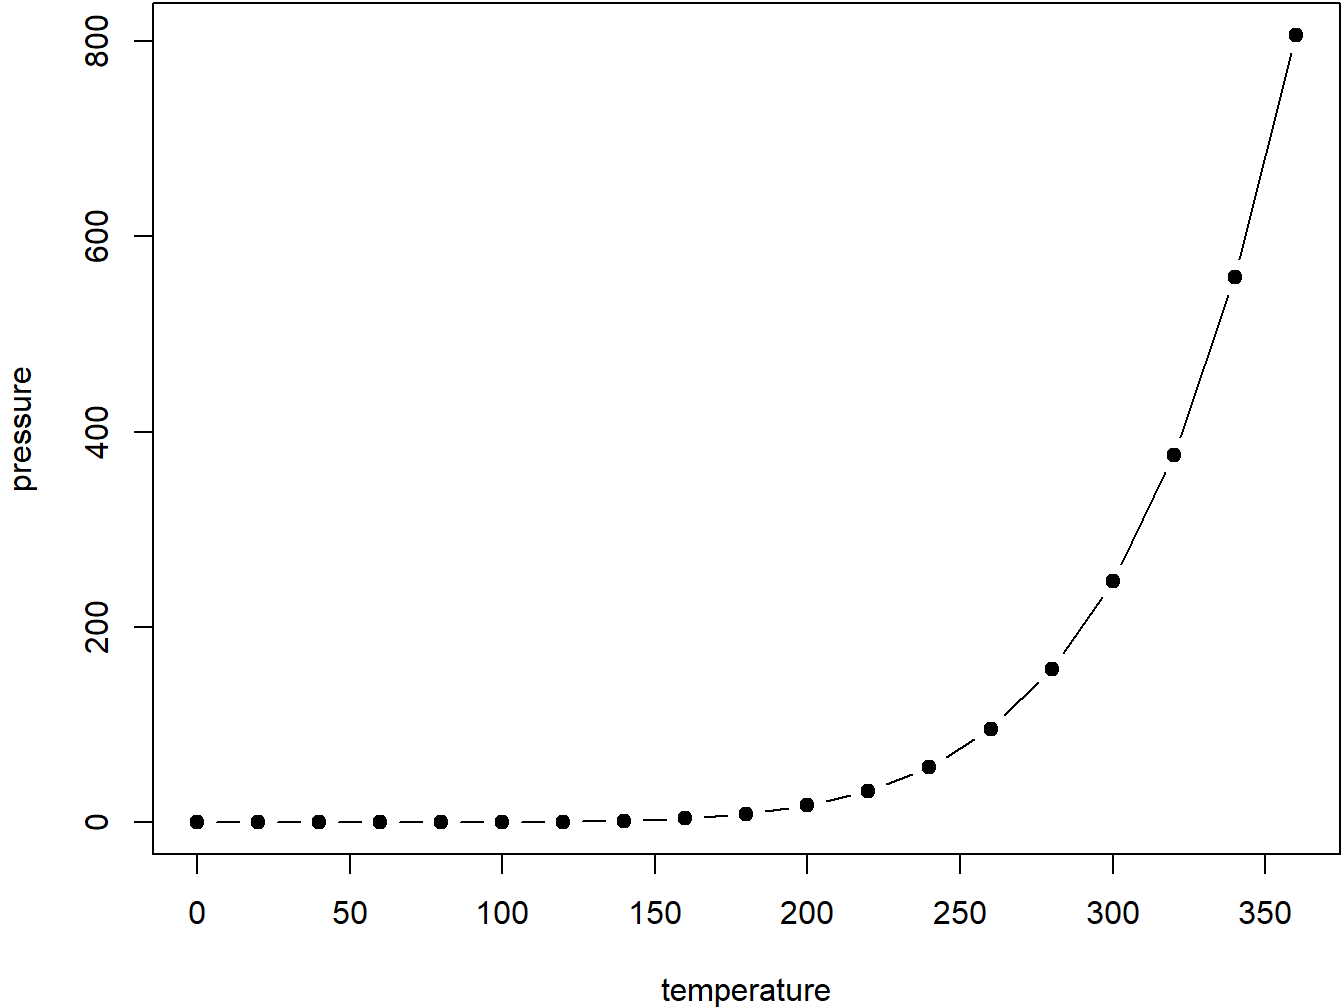
par(mar = c(4, 4, .1, .1))
plot(pressure, type = 'b', pch = 19)
Figure 4.1: Here is a nice figure!
Reference a figure by its code chunk label with the fig: prefix, e.g., see Figure 4.1. Similarly, you can reference tables generated from knitr::kable(), e.g., see Table 4.1.
knitr::kable(
  head(iris, 20), caption = 'Here is a nice table!',
  booktabs = TRUE
)| Sepal.Length | Sepal.Width | Petal.Length | Petal.Width | Species |
|---|---|---|---|---|
| 5.1 | 3.5 | 1.4 | 0.2 | setosa |
| 4.9 | 3.0 | 1.4 | 0.2 | setosa |
| 4.7 | 3.2 | 1.3 | 0.2 | setosa |
| 4.6 | 3.1 | 1.5 | 0.2 | setosa |
| 5.0 | 3.6 | 1.4 | 0.2 | setosa |
| 5.4 | 3.9 | 1.7 | 0.4 | setosa |
| 4.6 | 3.4 | 1.4 | 0.3 | setosa |
| 5.0 | 3.4 | 1.5 | 0.2 | setosa |
| 4.4 | 2.9 | 1.4 | 0.2 | setosa |
| 4.9 | 3.1 | 1.5 | 0.1 | setosa |
| 5.4 | 3.7 | 1.5 | 0.2 | setosa |
| 4.8 | 3.4 | 1.6 | 0.2 | setosa |
| 4.8 | 3.0 | 1.4 | 0.1 | setosa |
| 4.3 | 3.0 | 1.1 | 0.1 | setosa |
| 5.8 | 4.0 | 1.2 | 0.2 | setosa |
| 5.7 | 4.4 | 1.5 | 0.4 | setosa |
| 5.4 | 3.9 | 1.3 | 0.4 | setosa |
| 5.1 | 3.5 | 1.4 | 0.3 | setosa |
| 5.7 | 3.8 | 1.7 | 0.3 | setosa |
| 5.1 | 3.8 | 1.5 | 0.3 | setosa |
You can write citations, too. For example, we are using the bookdown package (Xie 2020) in this sample book, which was built on top of R Markdown and knitr (Xie 2015).