第 2 章 Layers
每個圖形都可想成是一層一層疊上去——每一層使用不同的geometric object。

2.1 Data and mapping
範例資料:mpg
library(dplyr)
library(ggplot2)
data("mpg")
mpg %>% head
## # A tibble: 6 x 11
## manufacturer model displ year cyl trans drv
## <chr> <chr> <dbl> <int> <int> <chr> <chr>
## 1 audi a4 1.80 1999 4 auto(l5) f
## 2 audi a4 1.80 1999 4 manual(m… f
## 3 audi a4 2.00 2008 4 manual(m… f
## 4 audi a4 2.00 2008 4 auto(av) f
## 5 audi a4 2.80 1999 6 auto(l5) f
## 6 audi a4 2.80 1999 6 manual(m… f
## # ... with 4 more variables: cty <int>, hwy <int>,
## # fl <chr>, class <chr>使用
data=mpg, mapping=aes(x=cyl)2.2 ggplot(): 定義畫布
定義「共用」data與mapping。也有點像是放上畫布
canvas<-ggplot(data=mpg,mapping=aes(x=cyl,y=cty))
canvas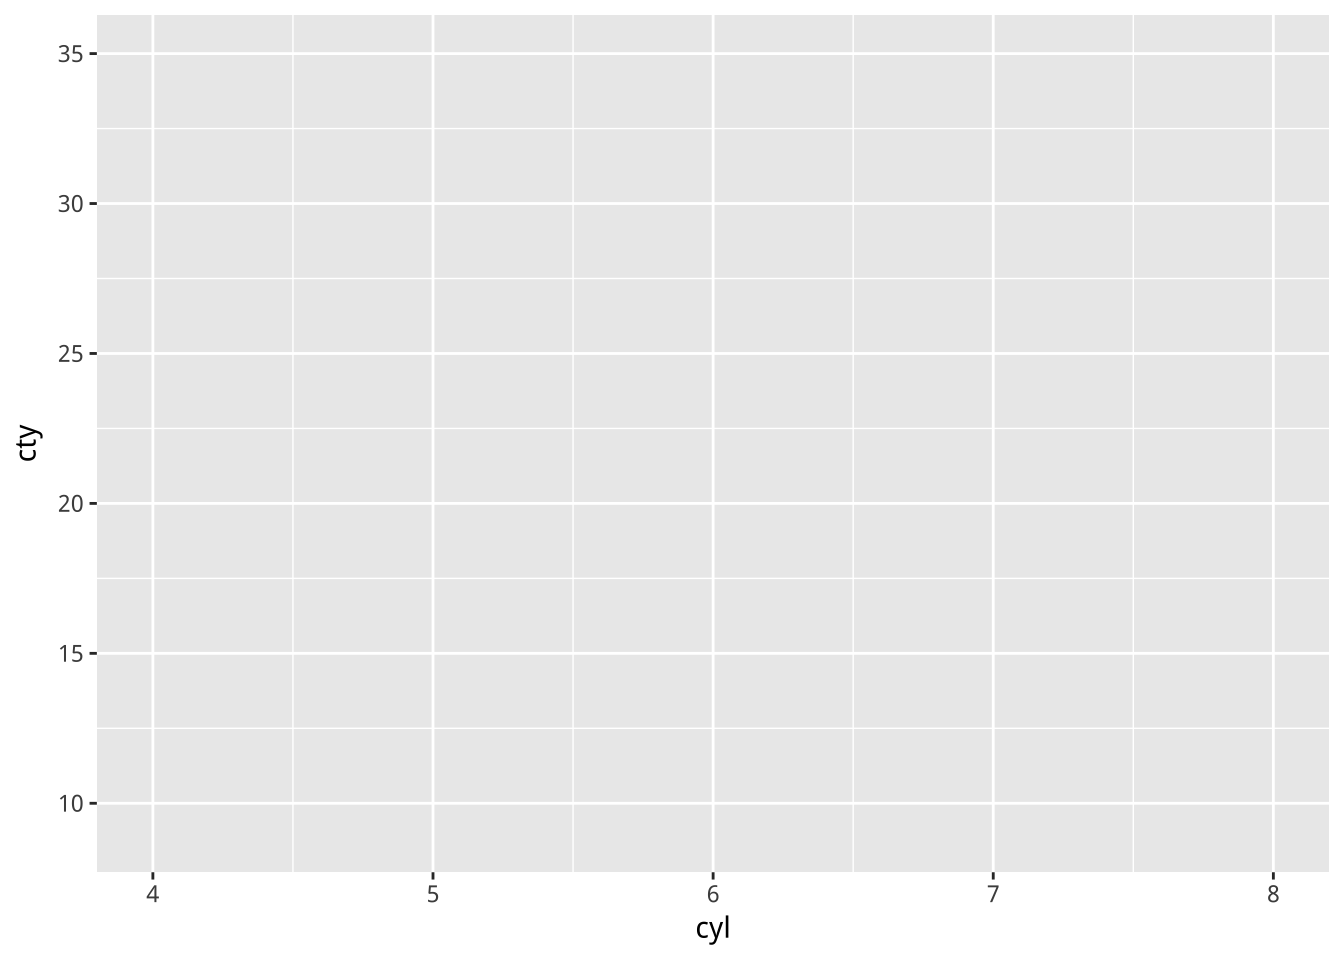
圖 2.1: 定義畫布
除非後面加上的層圖有另外定義,否則它們會共用mpg資料集與以cyl為定義的x軸。
- 這表示後面的層圖不一定要延用它們。
2.3 GEOMS: 定義畫上的幾何圖形
Two variables
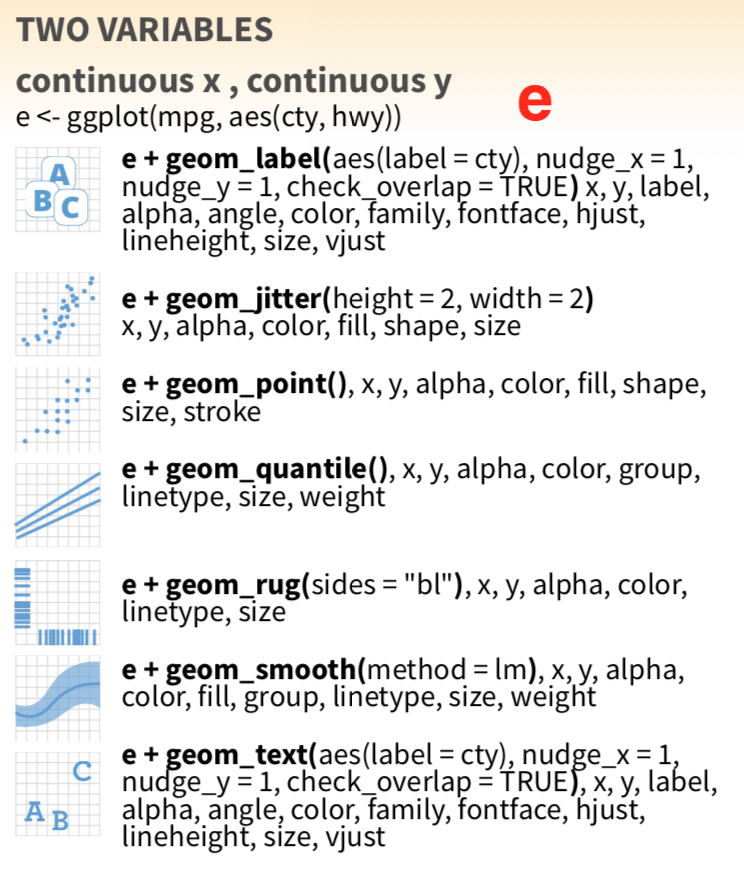
範例: geom_point
e <- ggplot(mpg, aes(cty, hwy))
e + geom_point()
不定義共同data與mapping, 在每個geom各別定義。
e2 <- ggplot()
e2 + geom_point(mapping=aes(cty, hwy),data=mpg)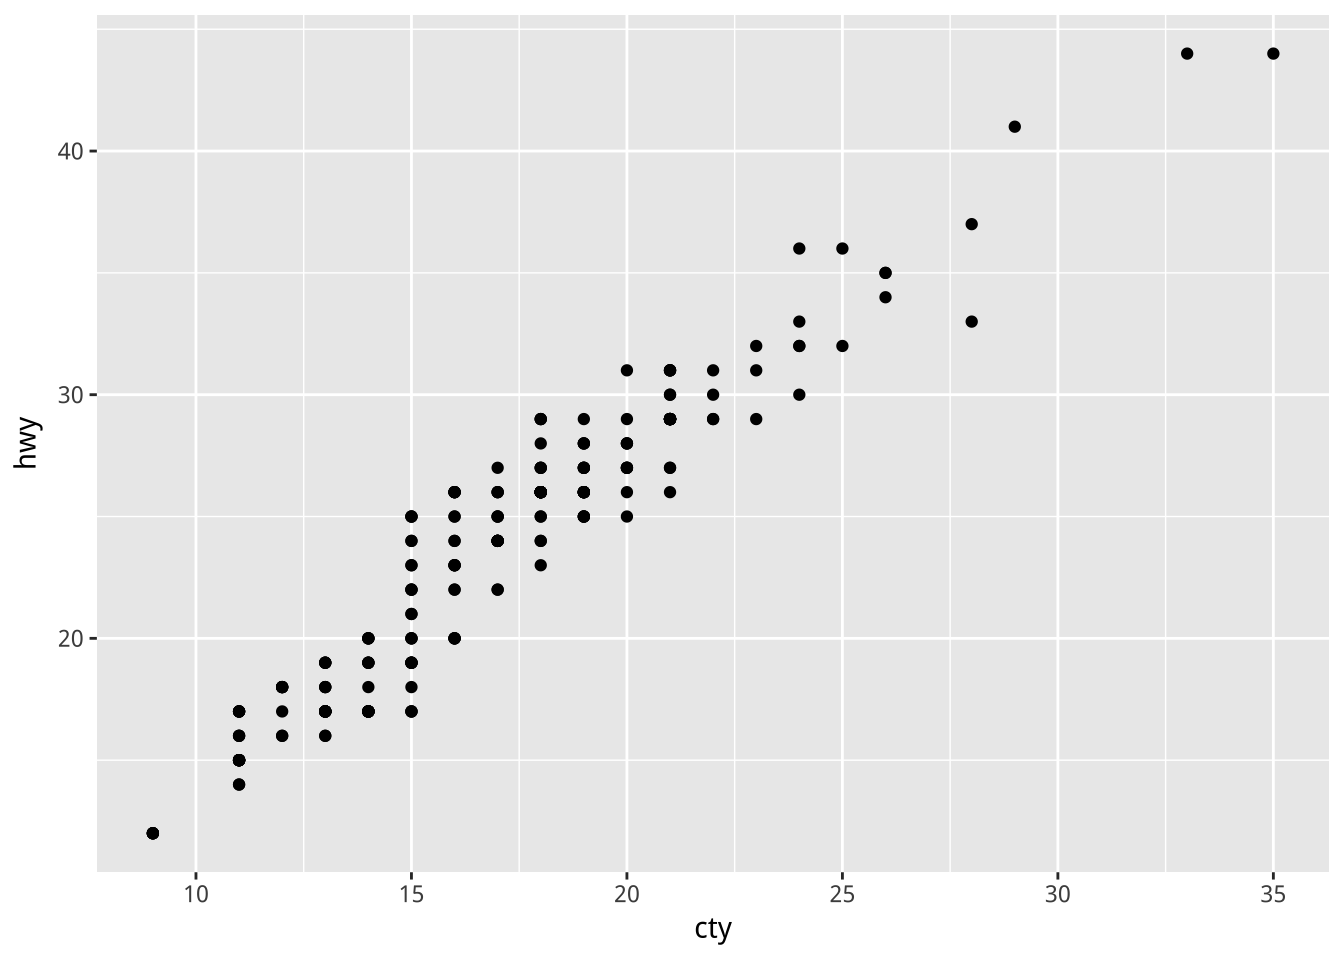
注意mapping在前, data在後,所以如果要省略mapping=與data=, 前後順序不能錯。
範列:層疊
e + geom_point() +
  geom_smooth()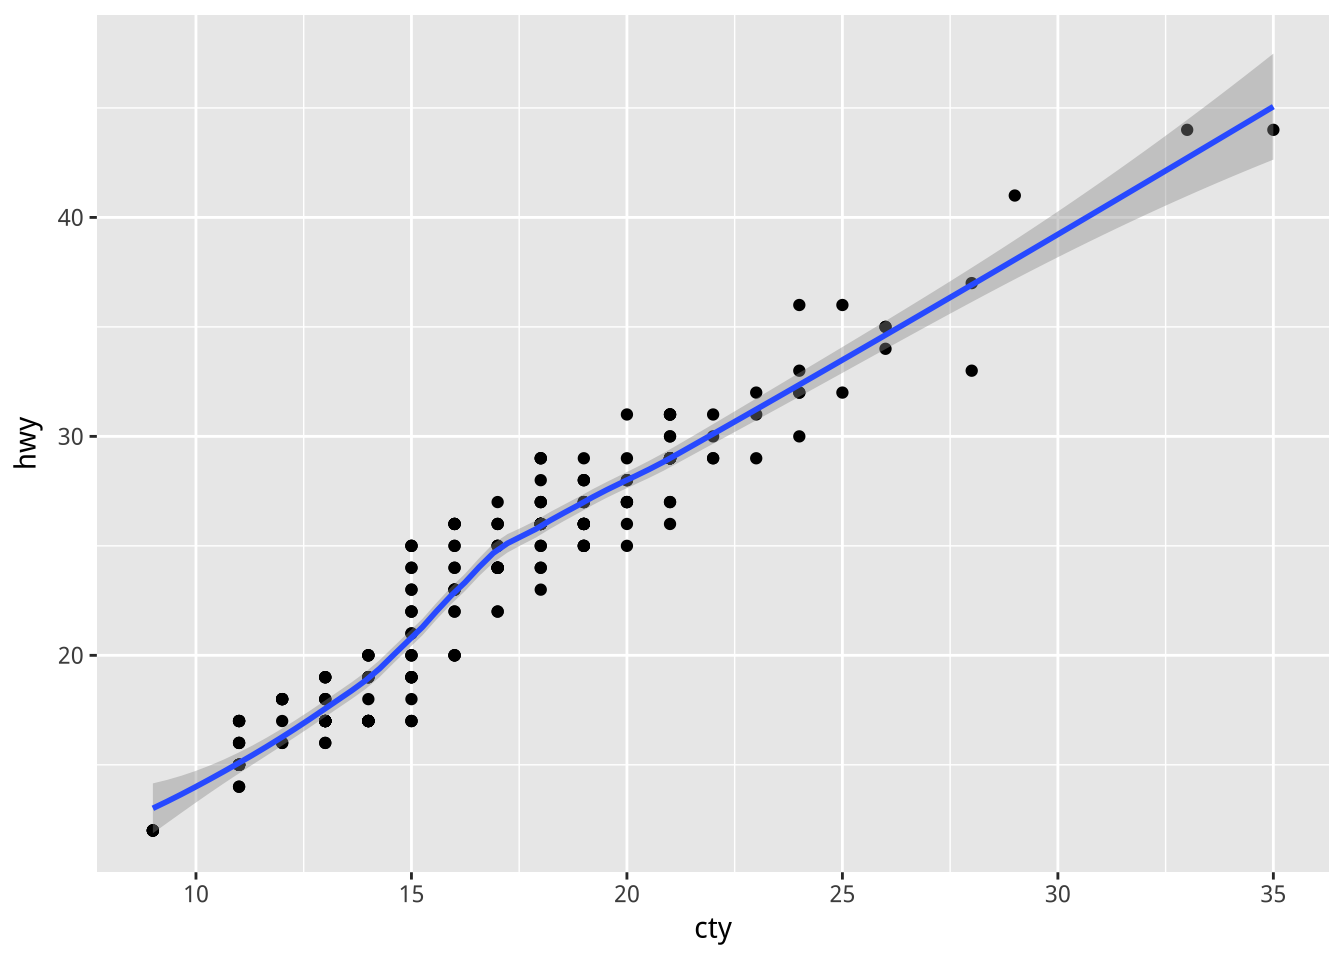
Q:下面層疊會有什麼問題?
e2 + geom_point(mapping=aes(cty, hwy),data=mpg)+
  geom_smooth()
2.4 幾何圖形裡的美感:aesthetic
mapping=aes(...)裡的aes是aesthetic(美感)的縮寫。
ggplot(mpg)+
  geom_point(aes(x=cty,y=hwy))
mapping裡的美感
讓每個點依它所屬的車型(class)而填上不同顏色:
Q:下面兩者的差異是何原因?
ggplot(mpg)+
  geom_point(aes(x=cty,y=hwy,color=class))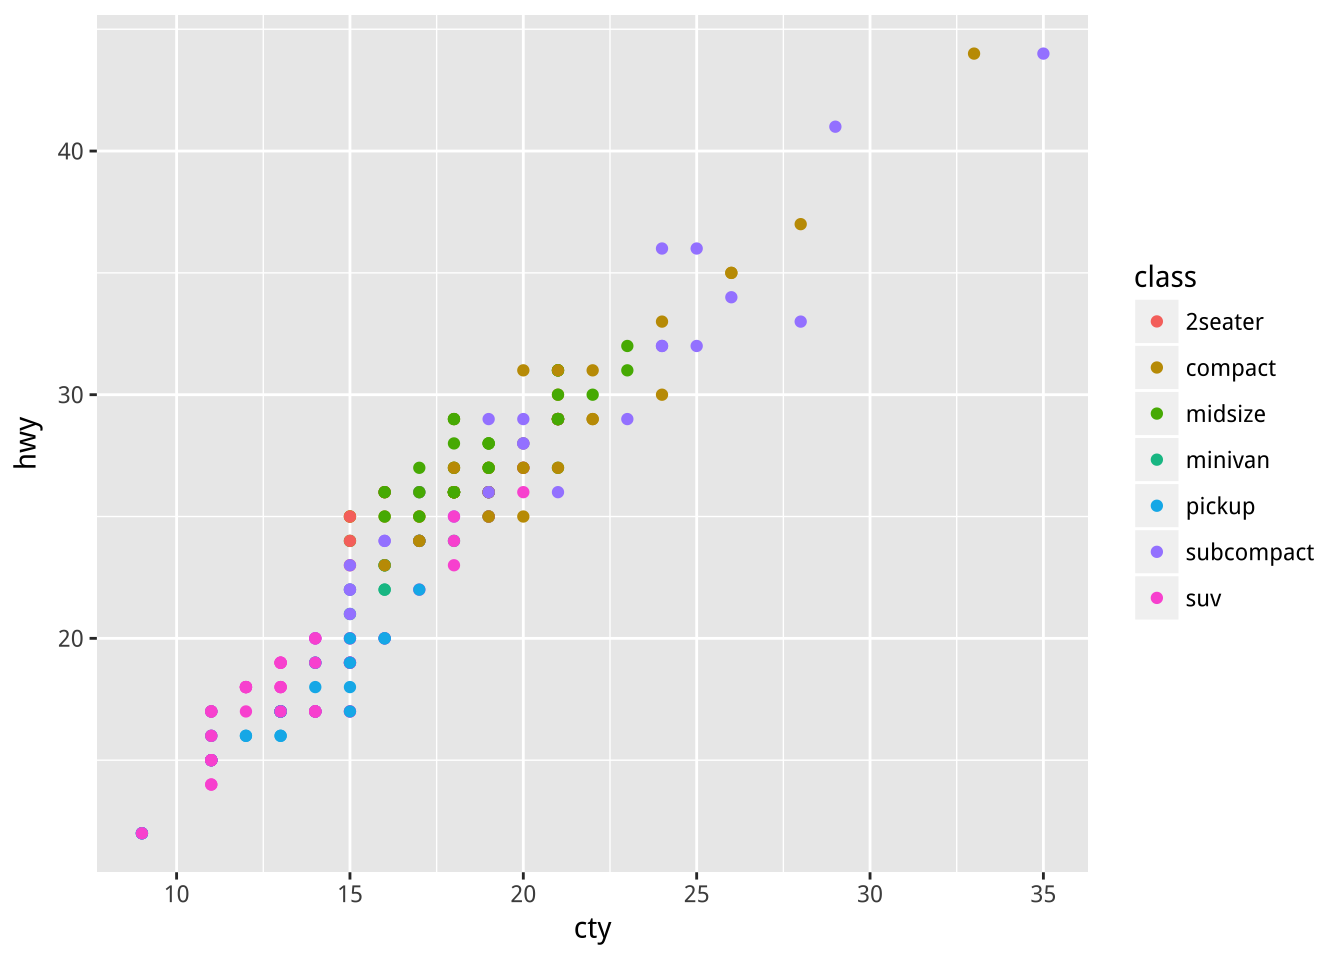
ggplot(mpg)+
  geom_point(aes(x=cty,y=hwy,color=cyl))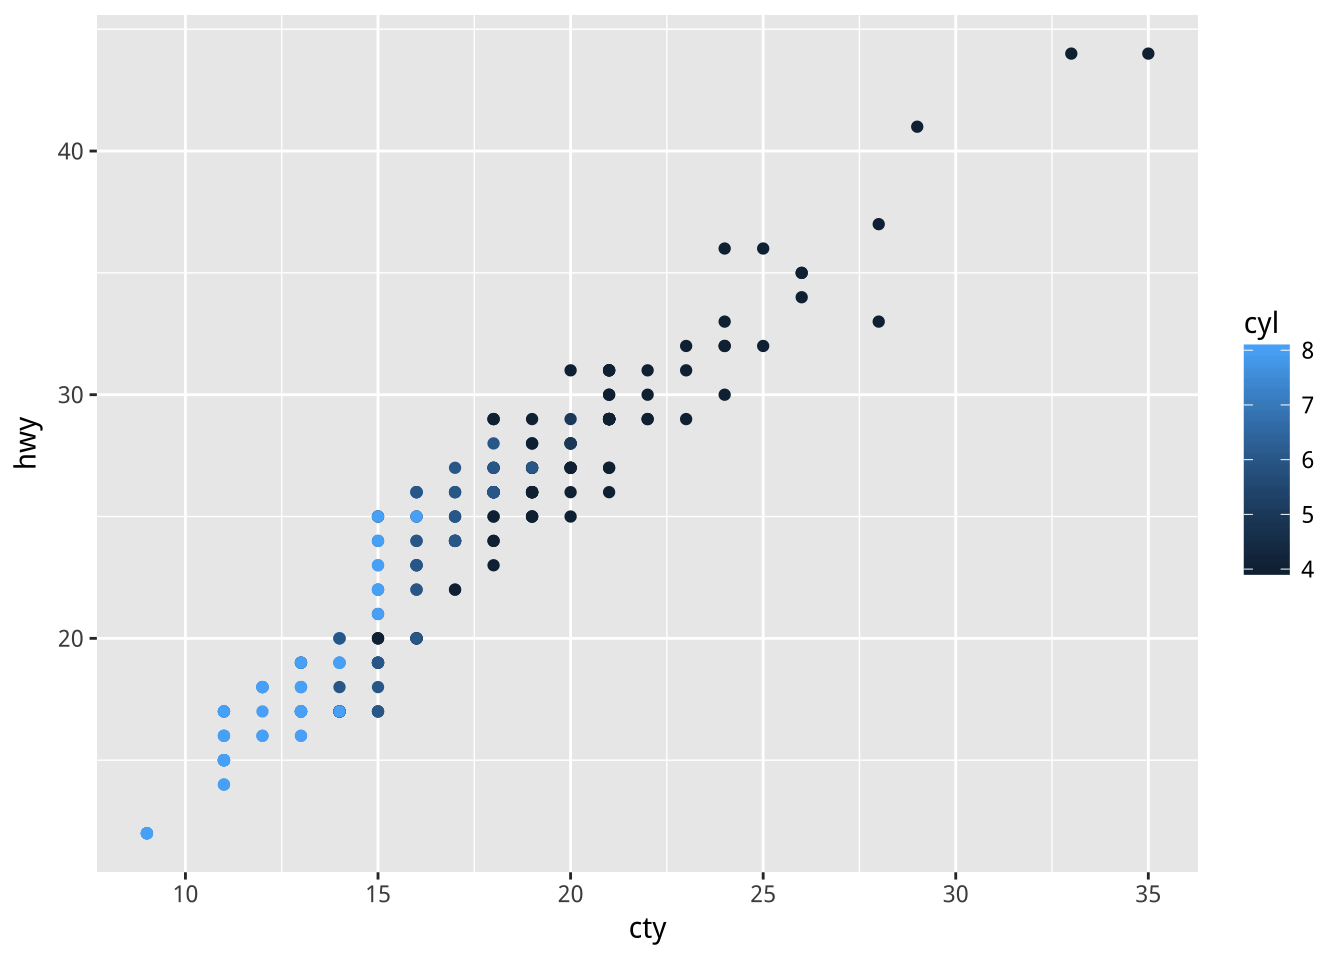
mapping外的美感
美感設計也不一定要依資料變化,如:
ggplot(mpg)+
  geom_point(aes(x=cty,y=hwy),color="red")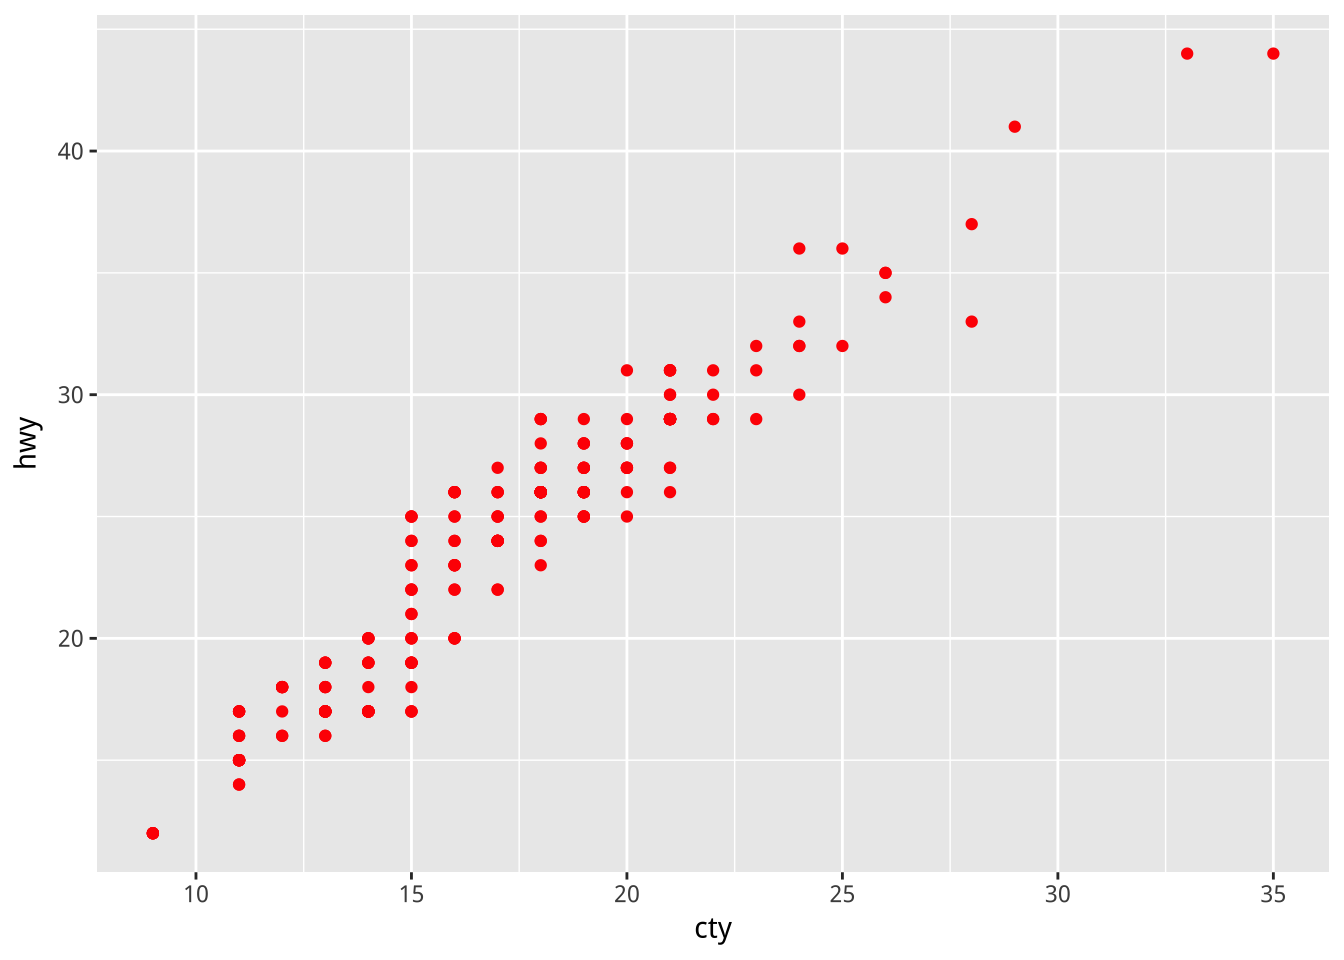
geom_point()為例,它還有:- color
- alpha:透明度
- fill: 填色
- shape: 形狀
- size
- stroke: 筆觸粗細(圓點的外圈粗細)
One variable
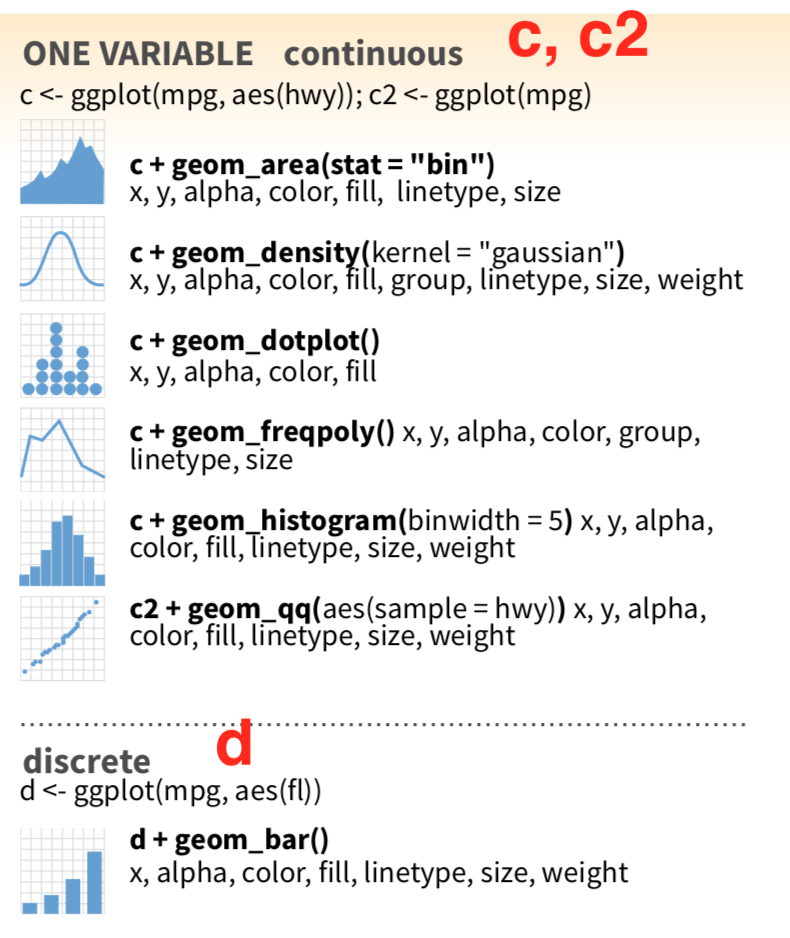
其他GEOM介紹
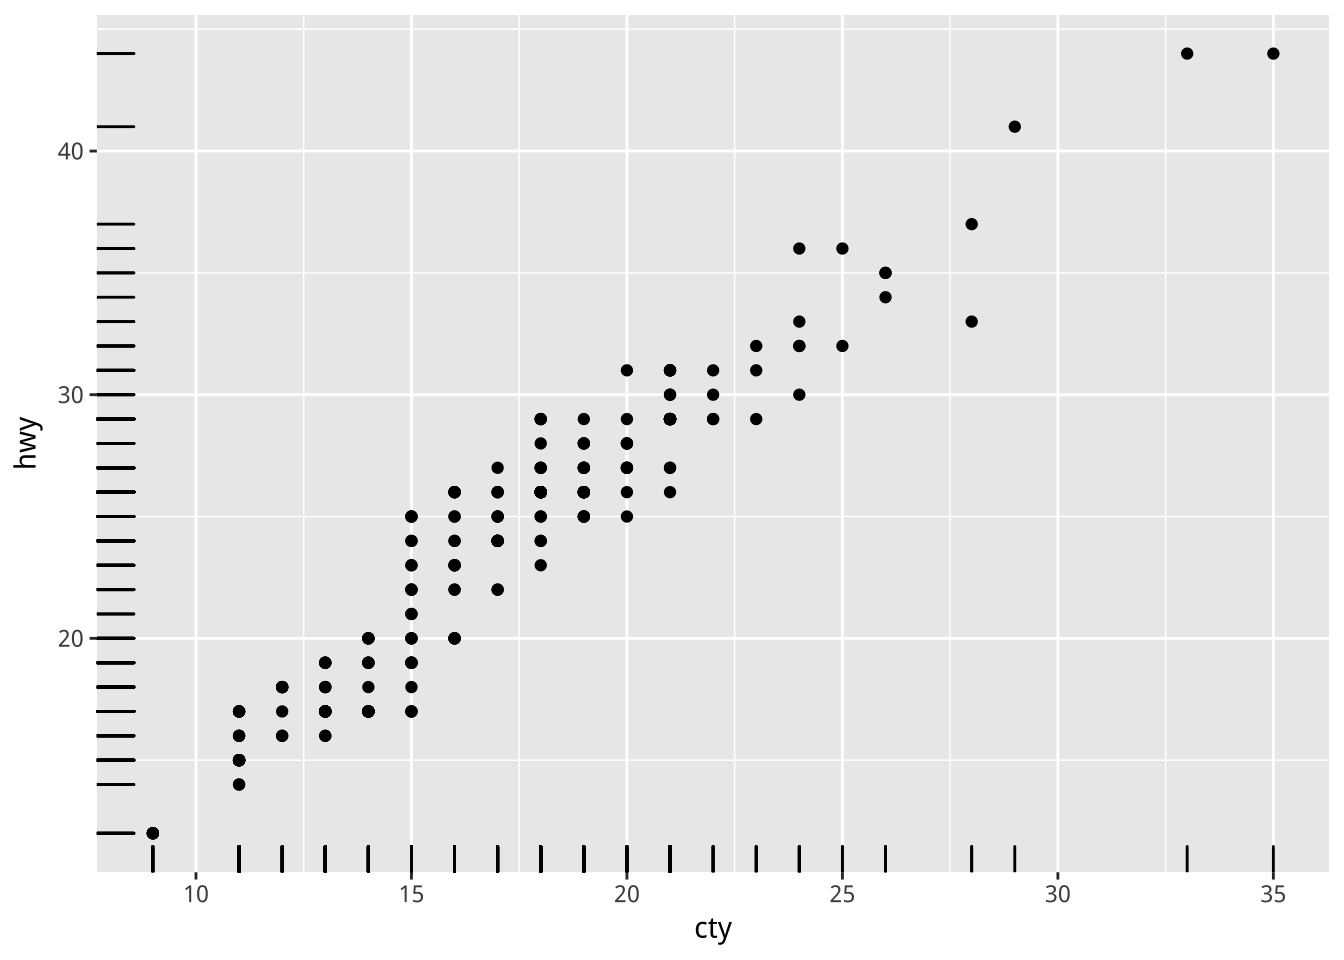
範例:離散圖+地毯圖
e + geom_point() + geom_rug(sides = "bl")