1 Measuring Output and Prices
1.1 GDP, CPI and PCE
In an economy, X and Y are two final goods, their unit price and quantity are given in the following table:
| Period | Qx | Px | Qy | Py |
|---|---|---|---|---|
| 1 | 50 | 4 | 100 | 3 |
| 2 | 100 | 6 | 60 | 6 |
Calculate nominal GDP for each period.
Use year 1 and 2 as base year separately to calculate real GDP for each period.
Calculate chained-dollar real GDP.
Calculate GDP deflator for each period.
Calculate CPI (consumption price index) for each period.
Calculate PCE price index (Personal Consumption Expenditures chain-type price index) for it.
1.2 Price distortion
GDP and price index use market value for computation. However there are various price distortions, especially those from the government. Please discuss how price distortions affect GDP and price index as well as its impact on real GDP and the calculation of inflation rate.
Guaranteed price for rice.
In 2002 Taiwan joined WTO, Europe and the US request Taiwan government to impose a tax rate on Taiwan’s red-labeled rice wine as high as those imported Whisky and Brandy. As a result, rice wine price increased.
In 1970s the US government imposed a so-called incomes policy which suppressed prices and wages.
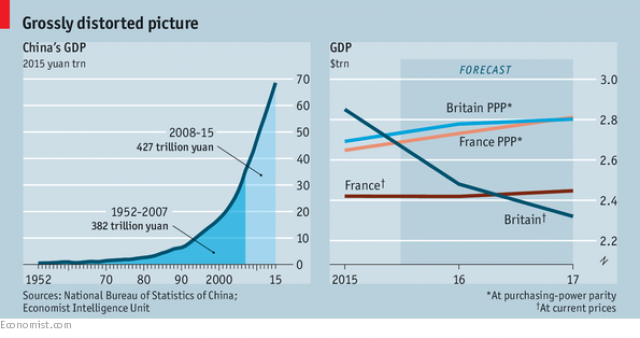
1.3 GDP based on purchasing power parity (PPP GDP).
For the same basket of goods, it may cost USD 100 in the U.S. but only NTD 1000 in Taiwan. Suppose both countries only produce this kind of basket every year.
In year 1, both countries produce the same 10000 units of basket. What are their nominal GDP?
Suppose the exchange is NTD 30 for USD 1. If we convert Taiwan’s year 1 nominal GDP to USD directly, what would be Taiwan’s GDP in USD? Does it make sense to convert this way?
How would you compare GDP across these two countries?
1.4 Privatization
What would happen to GDP when government privatizes its business?
1.5 The Economist.
- “Why it is so difficult to measure inflation”
“Econometrics: It is not easy to compare the size of economies—even across the Channel”
weekly GDP figures do not exist and would be hideously volatile if they did.
Because GDP represents a flow of goodies over time, it makes sense to value it at the exchange rates that prevailed during that time. It seems odd, in contrast, to reprice what happened last year at an exchange rate that arose only last week
This is not to deny that the pound was overvalued. Its strength was rooted not in the international appeal of British goods but in the widespread appeal of British assets—including gilded homes and gilt-edged securities. Foreign purchases of these assets added little directly to British output (because GDP includes only newly built homes and factories, not financial securities or pre-existing properties or companies sold to new owners). But these buyers did bid up the currency in which GDP was priced.
The combination made Britain an expensive place to visit: all told, its prices were about 16% higher than France’s last year, according to the World Bank and the IMF. As it happens, if similar items were priced similarly in both countries (bringing their purchasing power into parity with each other), France’s GDP would have been almost the same size as its neighbour’s in 2015, even before Britain’s recent setbacks and indignities.