R for Solving Social Problems
2021-09-03
Chapter 1 Data Analysis for Solving Social Problems
1.1 Types of Data Analysis
Before talking about R and social problems, let’s talk about the types of data analysis first.
@leek2015question categorized data analysis into the 6 types as presented in the table below, and emphasized “mistaking the type of question being considered is the most common error in data analysis.”
| Types of Data Analysis | Questions being asked |
|---|---|
| Descriptive data analysis(기술통계분석) | seek to summarize(요약) the measurement in a single data set without further interpretation(e.g., US Census) |
| Exploratory data analysis(탐색적자료분석) | search for discoveries(발견), trends, correlations, or relationships between the measurements to generate ideas or hypotheses(e.g., The four-star planetary system Tatooine) |
| Inferential data analysis(추론분석) | quantify whether an observed pattern will likely hold beyond the data set in hand or in population(모집단)(e.g., a study of whether air pollution correlates with life expectancy in US) |
| Predictive data analysis(예측분석) | predict(예측) another measurement (the outcome) on a single person or unit(e.g., prediction of how people will vote in an election) |
| Causal data analysis(인과관계분석) | seek to find out what happens to one measurement on average if you make another measurement change(인과, e.g., causal relationship between smoking and cancer) |
| Mechanistic data analysis(결정론적관계분석) | seek to show that changing one measurement always and exclusively leads to a specific, deterministic behavior in another(인과, e.g., wing design) |
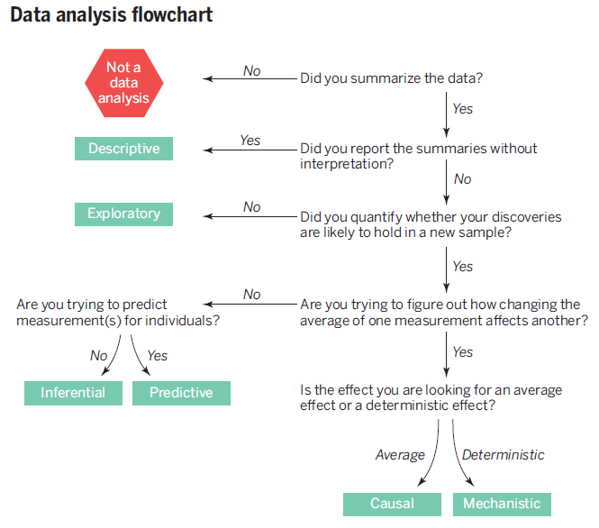
from Leek & Peng (2015)
@leek2015question’s main point is that we should keep in mind the type of question being asked by our own data analysis. In other words, we should say what we can say, not what we want to say.
@leek2015question presents a table showing common mistakes
| Real Question Type | Perceived Question Type | Phrase Describing Error |
|---|---|---|
| Inferential | Causal | Correlation does not imply causation |
| Exploratory | Inferential | Data Dredging (or p-hacking) |
| Exploratory | Predictive | Overfitting(과적합) |
| Descriptive | Inferential | n of 1 analysis |
- @leek2015question mentioned a very important statement that we should keep in mind when we use data science to solve social problems:
“In nonrandomized experiments, it is usually only possible to determine the existence of a relationship between two measurements, but not the underlying mechanism or the reason for it.”
It is known that the best way to investigate causal relationship is to conduct randomized experiments. However, unlike in natural science, it is not easy to conduct randomized experiments in social science because of ethical and practical reasons. The fundamental dilemma of data analysis in social science is that we essentially want to make causal statements in the absence of randomized experiments. Many statistical tools we use are just correlational.
In the field of the philosophy of science, it is usually said that the goals of science is explanation and prediction:
“Historically, social scientists have sought out explanations of human and social phenomena that provide interpretable causal mechanisms, while often ignoring their predictive accuracy. We argue that the increasingly computational nature of social science is beginning to reverse this traditional bias against prediction.” [@hofman2017prediction]
1.2 Causality(인과관계)
Then, what is causality?
- According to @cohen2014applied, X is a cause of Y if
- X precedes Y in time (temporal precedence, 시간의 우선성).
- Some mechanism whereby this causal effect operates can be posited (causal mechanism, 인과기제)
- A change in the value of X is accompanied by a change in the value of Y on the average (association or correlation, 상관관계)
- The effects of X on Y can be isolated from the effects of other potential variables on Y (non-spuriousness or lack of confounders, 다른 대안적 설명의 배제)
- According to @bollen1989structural, the conditions for causal inference are
- For X to cause Y, X must precede Y in time (temporal order)
- For X to cause Y, Y should be isolated from all other influences except X (isolation)
- For X to cause Y, X and Y must be correlated (association)
- According to @cohen2014applied, X is a cause of Y if
Correlation is a necessary condition(필요조건) for causality, not a sufficient condition(충분조건). In order words, correlation does not imply causality(상관관계는 인과관계를 함축하지 않는다).
A randomized experiment is defined by the following three conditions:
- Random assignment of subjects to groups(실험대상의 무작위 할당)
- Each subject have equal probability to be assigned to experimental and control groups.
- Manipulation of an independent(독립변수의 조작)
- Researcher can give treatments(처치) or interventions(개입) to an experimental group.
- Control of extraneous variables(외생변수의 통제)
- Researcher can control variables other than the independent variable that can influence the outcome.
- Random assignment of subjects to groups(실험대상의 무작위 할당)
A randomized experiment allows us to talk about causality because it effectively eliminates alternative explanations and attributes the changes in the outcome solely to the changes in the independent variable(무작위 실험은 다른 대안적 설명을 배제하고 결과값의 차이를 유일하게 종속변수의 차이로 설명한다).
Research can be categorized into experimental(실험연구) and non-experimental studies(비실험연구). In social science, most research are non-experimental, which makes it difficult for us to talk about causality.
1.3 Correlation(상관관계)
- Covariance(공분산) between two variables, \(Cov(X, Y)\), measures the strength and direction of the linear relationship between two variables:
\[Cov(X,Y) = E[(X-\mu_x)(Y-\mu_y)]\]
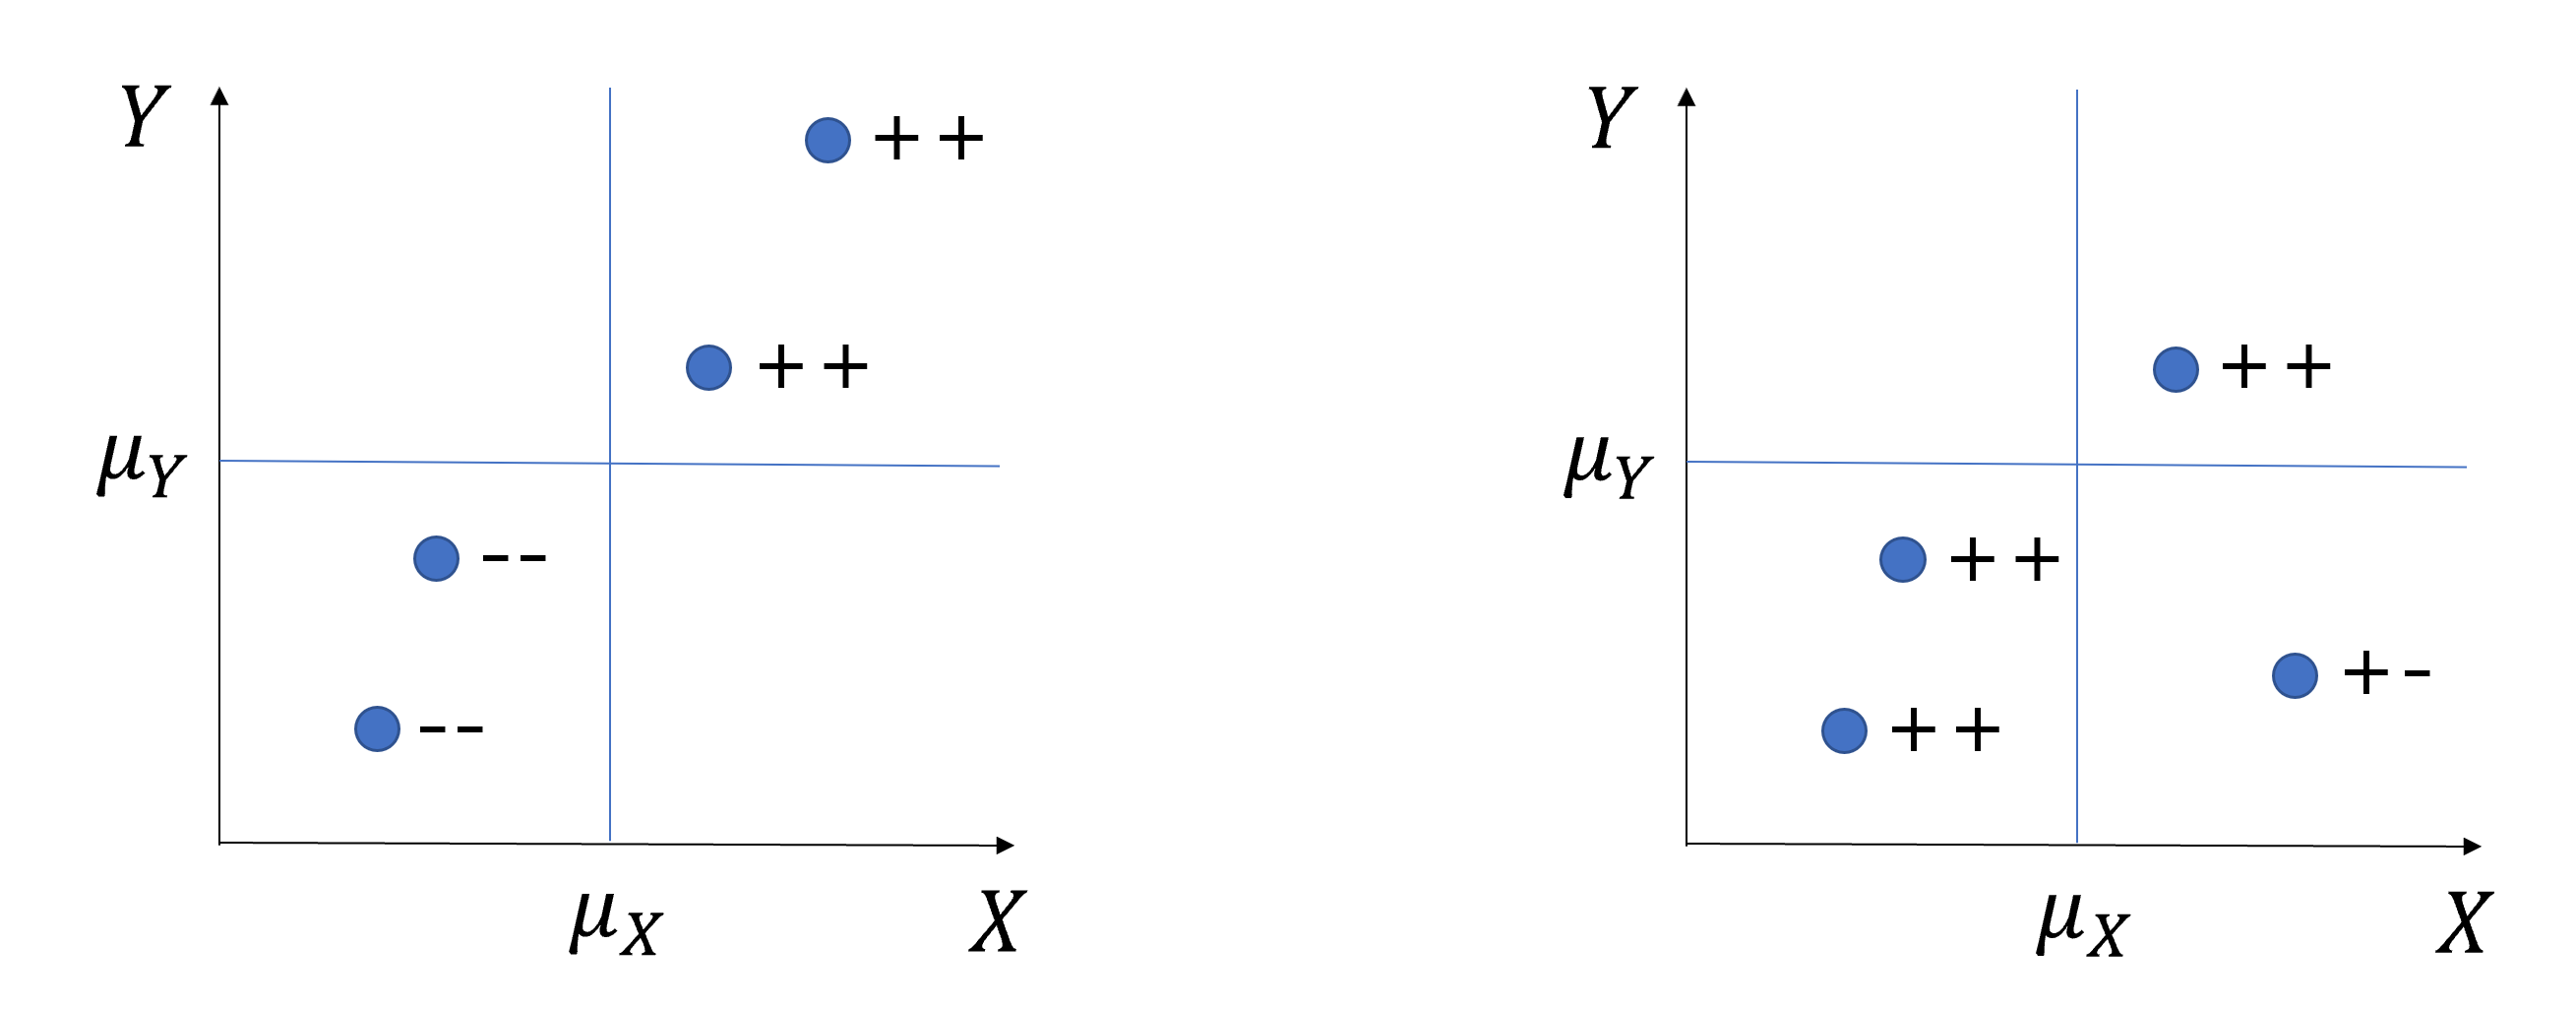
High covariance vs Low covariance
- Because covariance depend on the scale of variables, we need a standardized version of covariance, a correlation coefficient(상관계수):
\[\rho(X, Y) = \frac{Cov(X,Y)}{\sigma_X\sigma_Y}, \text{where } \sigma \text{=standard deviation(표준편차)}\] * Correlation coefficients have values between -1 and 1 (i.e., \(-1\le\rho\le1\)) and the values close to -1 or 1 indicate strong linear relationship.
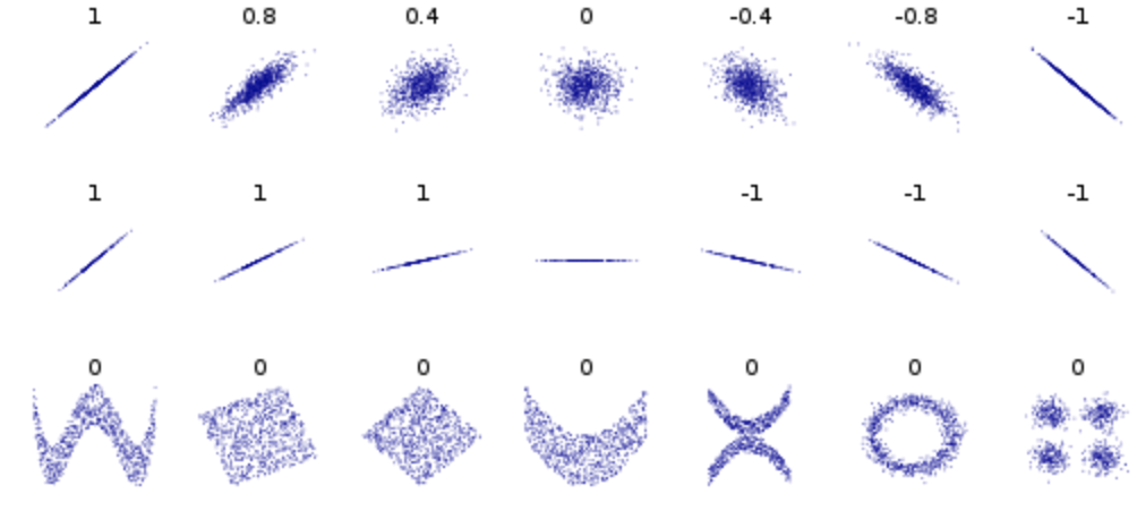
Correlation coefficients (from wiki)
Again, correlation does not imply causality. Here are some fun examples of correlated variables: Spurious correlations
So, what can we do to talk about causality when we cannot conduct randomized experiment in social science?
“In many scientific fields, and especially the social sciences, statistical methods are used nearly exclusively for testing causal theory. Given a causal theoretical model, statistical models are applied to data in order to test causal hypotheses. In such models, a set of underlying factors that are measured by variables X are assumed to cause an underlying effect, measured by variable Y . Based on collaborative work with social scientists and economists, on an examination of some of their literature, and on conversations with a diverse group of researchers, I conjecture that, whether statisticians like it or not, the type of statistical models used for testing causal hypotheses in the social sciences are almost always association-based models applied to observational data. Regression models are the most common example. The justification for this practice is that the theory itself provides the causality. In other words, the role of the theory is very strong and the reliance on data and statistical modeling are strictly through the lens of the theoretical model. The theory–data relationship varies in different fields.While the social sciences are very theory-heavy, in areas such as bioinformatics and natural language processing the emphasis on a causal theory is much weaker.” [@shmueli2010explain]