Chapter 2 Ramen Analysis
2.0.1 Data Set-up
In this analysis, we try to answer the question: “Which instant noodles is the best in the world”
I first read in the ramen-ratings.csv data and did some cleanings to remove non-sensical ratings.
Our data has 2551 ramen products with ratings between \((0, 5]\).
ramen_data_orig <- read.csv("ramen-ratings.csv")
ramen_data <- ramen_data_orig[!is.na(as.numeric(as.character(ramen_data_orig$Stars))) & ramen_data_orig$Stars != 0, ]
ramen_data$Stars <- as.numeric(as.character(ramen_data$Stars))
head(ramen_data)
## Review.. Brand Variety Style
## 4 734 Indomie Mi Goreng Rasa Ayam Panggang Jumbo (Local) Pack
## 5 45 Indomie Mi Goreng Sate Pack
## 6 105 Indomie Special Fried Curly Noodle Pack
## 7 608 Koka Spicy Black Pepper Pack
## 8 47 Indomie Mi Goreng Jumbo Barbecue Chicken Pack
## 9 392 Nissin Yakisoba Noodles Karashi Tray
## Country Stars Top.Ten
## 4 Indonesia 5 \n
## 5 Indonesia 5 \n
## 6 Indonesia 5 2012 #1
## 7 Singapore 5 2012 #10
## 8 Indonesia 5 2012 #2
## 9 Japan 5 2012 #32.0.2 General Statistics from Data
Let’s take a look at some useful statistics calculated from the data.
ramen_summary <- aggregate(ramen_data$Stars, list(ramen_data$Country), mean)
colnames(ramen_summary) <- c("uniq_cnt", "mean_rates")
ramen_summary[, -1] <- round(ramen_summary[, -1], 2)
ramen_summary
## uniq_cnt mean_rates
## 1 Australia 3.14
## 2 Bangladesh 3.71
## 3 Brazil 4.35
## 4 Cambodia 4.20
## 5 Canada 2.49
## 6 China 3.55
## 7 Colombia 3.29
## 8 Dubai 3.58
## 9 Estonia 3.50
## 10 Fiji 3.88
## 11 Finland 3.58
## 12 Germany 3.64
## 13 Ghana 3.50
## 14 Holland 3.56
## 15 Hong Kong 3.80
## 16 Hungary 3.61
## 17 India 3.40
## 18 Indonesia 4.07
## 19 Japan 3.99
## 20 Malaysia 4.15
## 21 Mexico 3.73
## 22 Myanmar 3.95
## 23 Nepal 3.55
## 24 Netherlands 2.48
## 25 Nigeria 1.50
## 26 Pakistan 3.00
## 27 Philippines 3.33
## 28 Poland 3.62
## 29 Sarawak 4.33
## 30 Singapore 4.13
## 31 South Korea 3.82
## 32 Sweden 3.25
## 33 Taiwan 3.73
## 34 Thailand 3.38
## 35 UK 3.04
## 36 United States 3.75
## 37 USA 3.53
## 38 Vietnam 3.222.0.3 Select Country of Interest
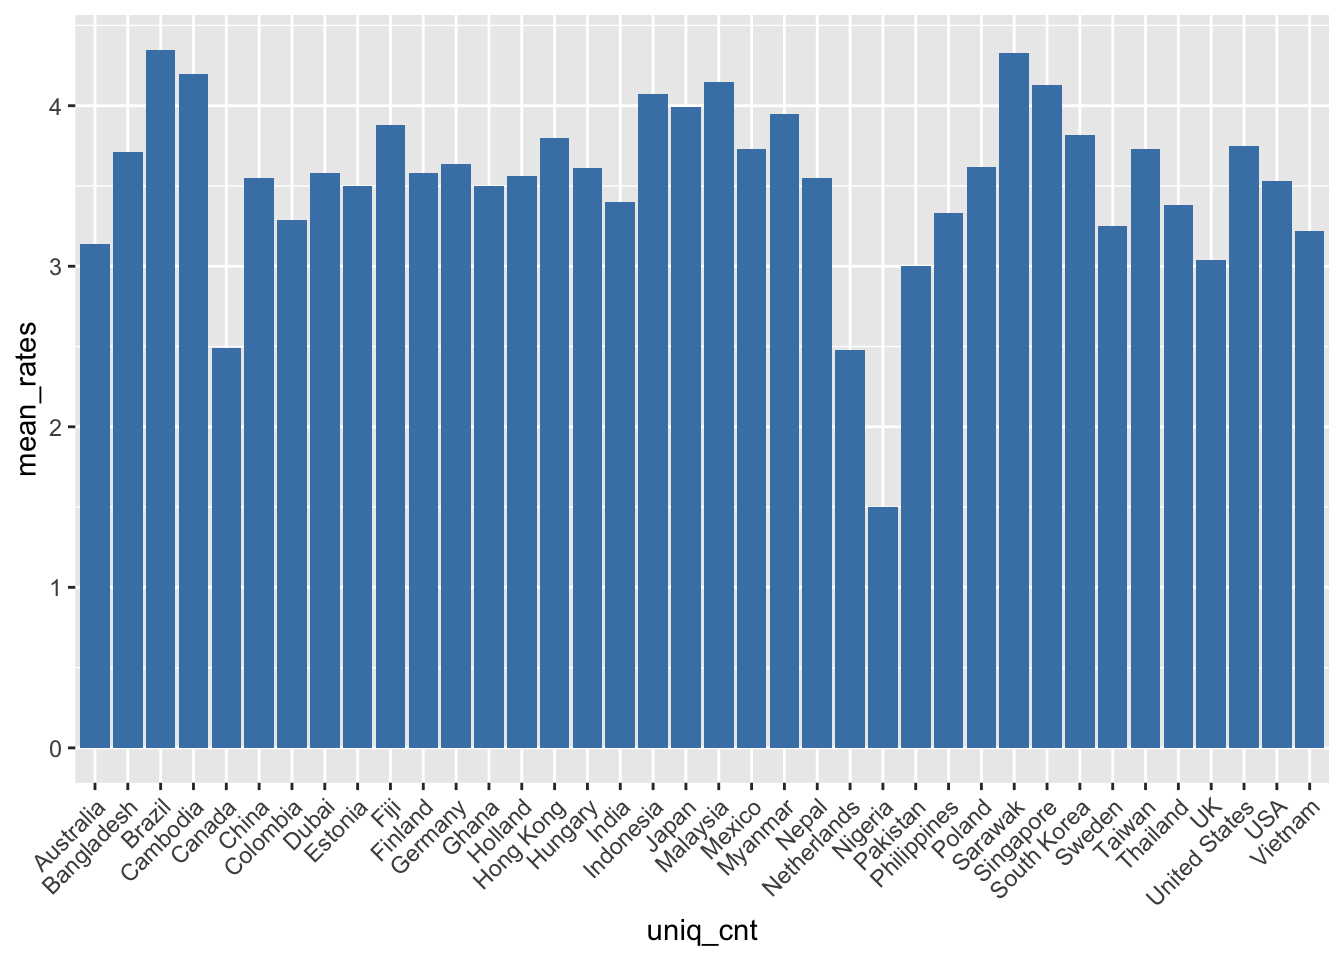
I then continued to select some countries with highly rated instant noodles and also where products can be purchased easily through an online shop.
library(ggplot2)
plot_ramen <- ggplot(ramen_summary, aes(uniq_cnt, mean_rates)) + geom_bar(stat = "identity", fill = "steel blue") + theme(axis.text.x = element_text(angle = 45, hjust = 1))
plot_ramen
2.0.4 Conclusion
This is a very rough analysis that only takes into account rating by countries. As the deadline is approaching, I will keep working on more detailed analysis later next week. This includes searching for key words such as “chicken” and “curry”, if sample sizes are large enough to reduce variance, and analyzing packagings of instant noodles products.