Chapter 5 Campers
Shrish
# Libraries needed
library(dplyr)
library(ggplot2)
library(readr)
library(tidytext)
library(magrittr)
# Importing dataset
setwd('~/workspace/bookdown-demo-main')
camp = read_csv('camp.csv')
wf_for_camp = read_csv('wf.csv')# Filter years from 2019 to 1999
years_camp <- camp %>% select(`Park Name`, `2019`:`1999`)
filtered_camp <- na.omit(years_camp)
df <- data.frame(colSums(Filter(is.numeric, filtered_camp)))
df$Year = c(2019:1999)
colnames(df)[1] ="Visitation"# Plotting visitation vs. Year
ggplot(df, aes(x = Year, y = Visitation)) + geom_point(col = 'red') +
geom_smooth(formula = y ~ x, method = lm, col = 'orange') +
xlab("Year") + ylab('Visitation Number') +
scale_y_continuous(labels = scales::comma)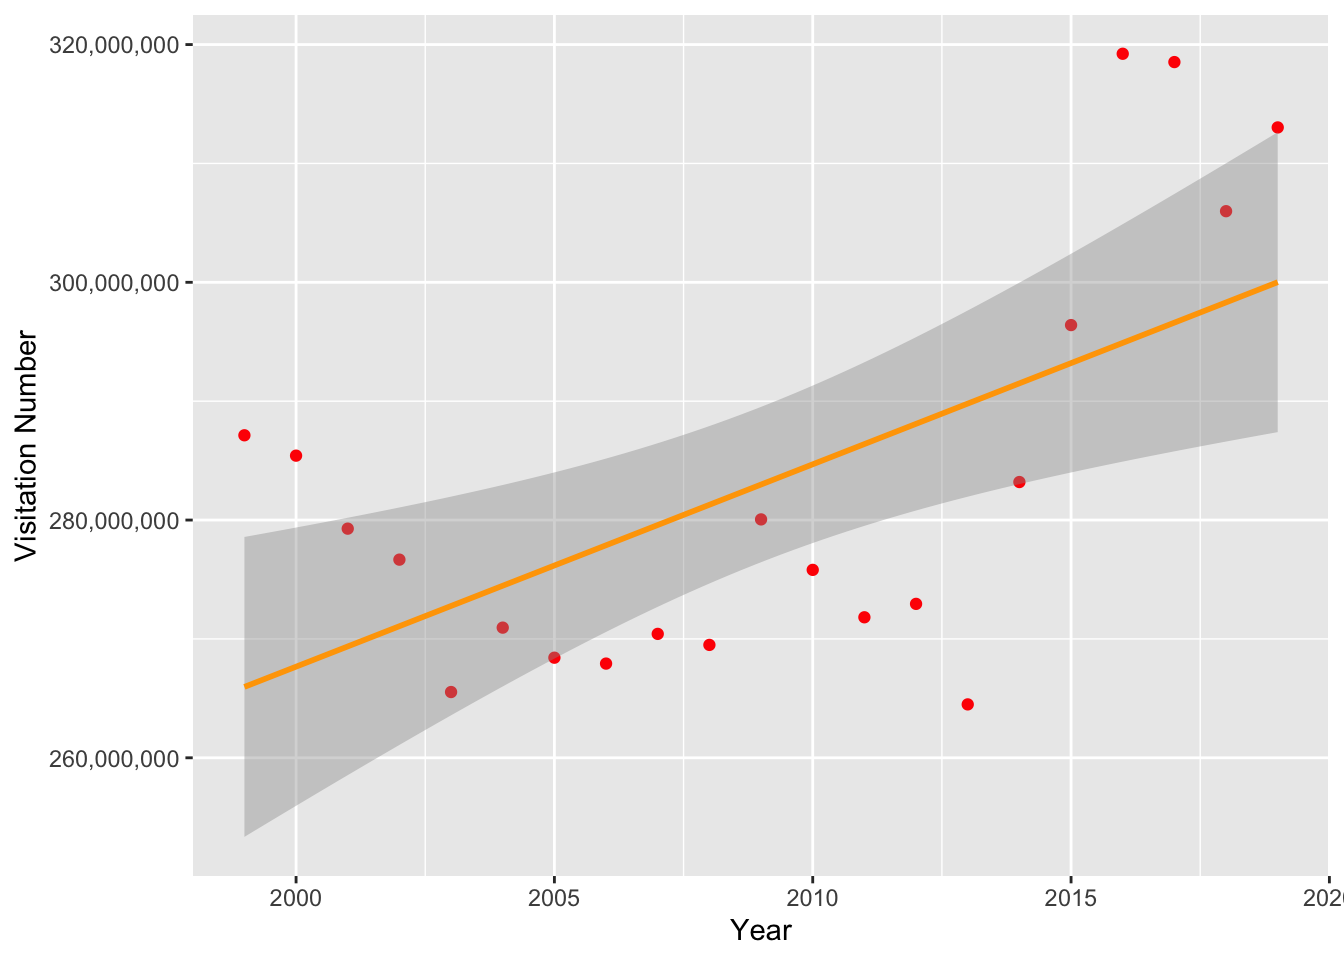 Visitation has been climbing every year. The Pandemic skews this data, which is why it was taken out.
# Preproccesing wildfire dataset
wf2 <- wf_for_camp %>%  filter(Year >= 1999 & Year < 2020)

df_final <- merge(wf2, df, by = 'Year')
# Plotting Visitation and Fires
ggplot(df_final, aes(x = Visitation, y = Fires)) + geom_point(col = 'red') +
geom_smooth(formula = y ~ x, method = lm, col = 'orange') +
xlab("Visitation") + ylab('Fires') +
scale_y_continuous(labels = scales::comma)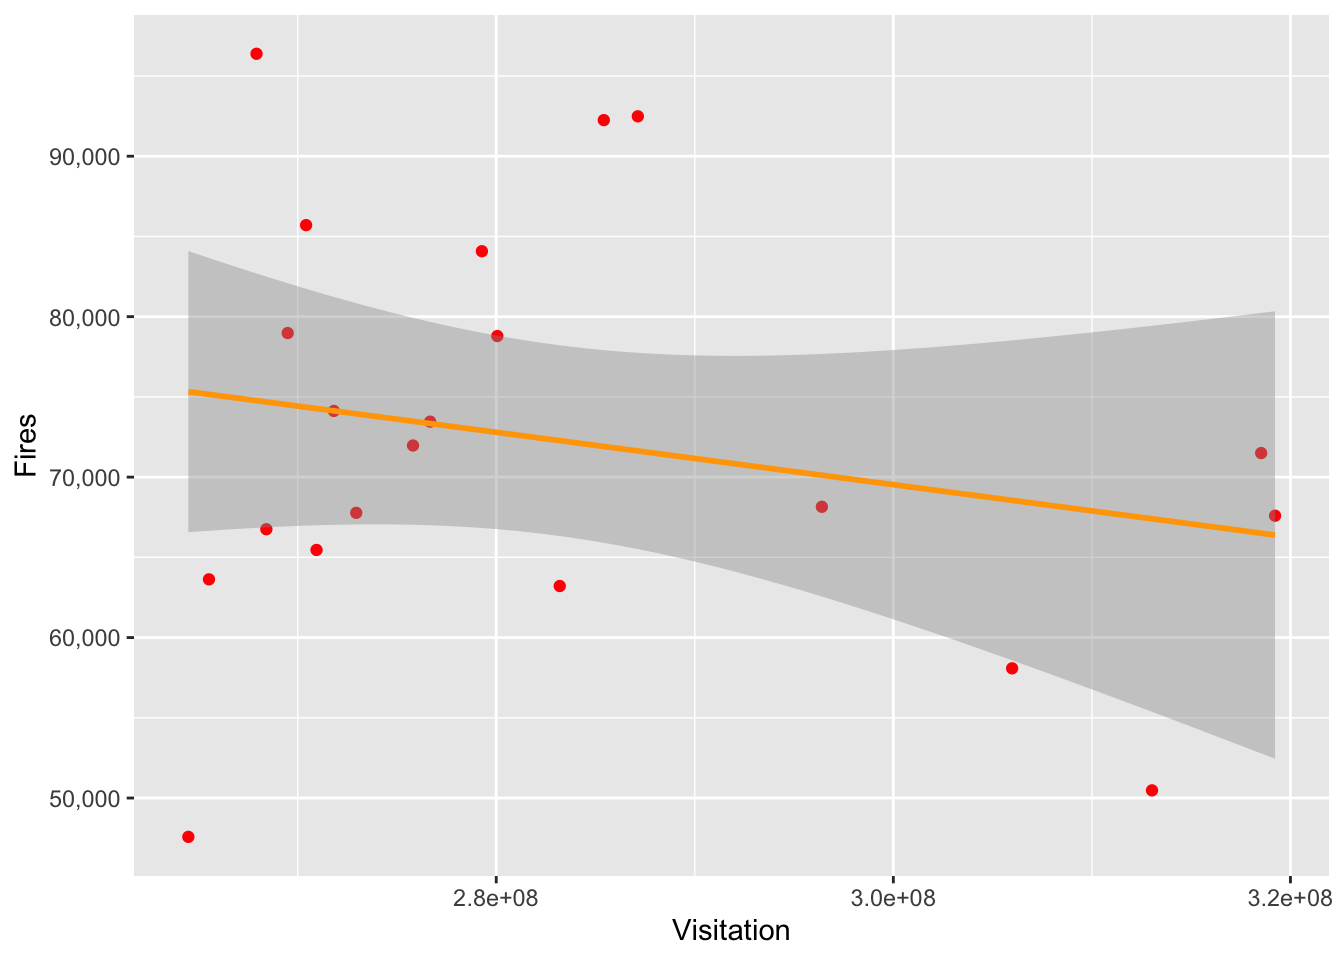 There seems to be no correlation between visitation and fires.
ggplot(df_final, aes(x = Visitation, y = Acres)) + geom_point(col = 'red') +
geom_smooth(formula = y ~ x, method = lm, col = 'orange') +
xlab("Visitation") + ylab('Acres') +
scale_y_continuous(labels = scales::comma)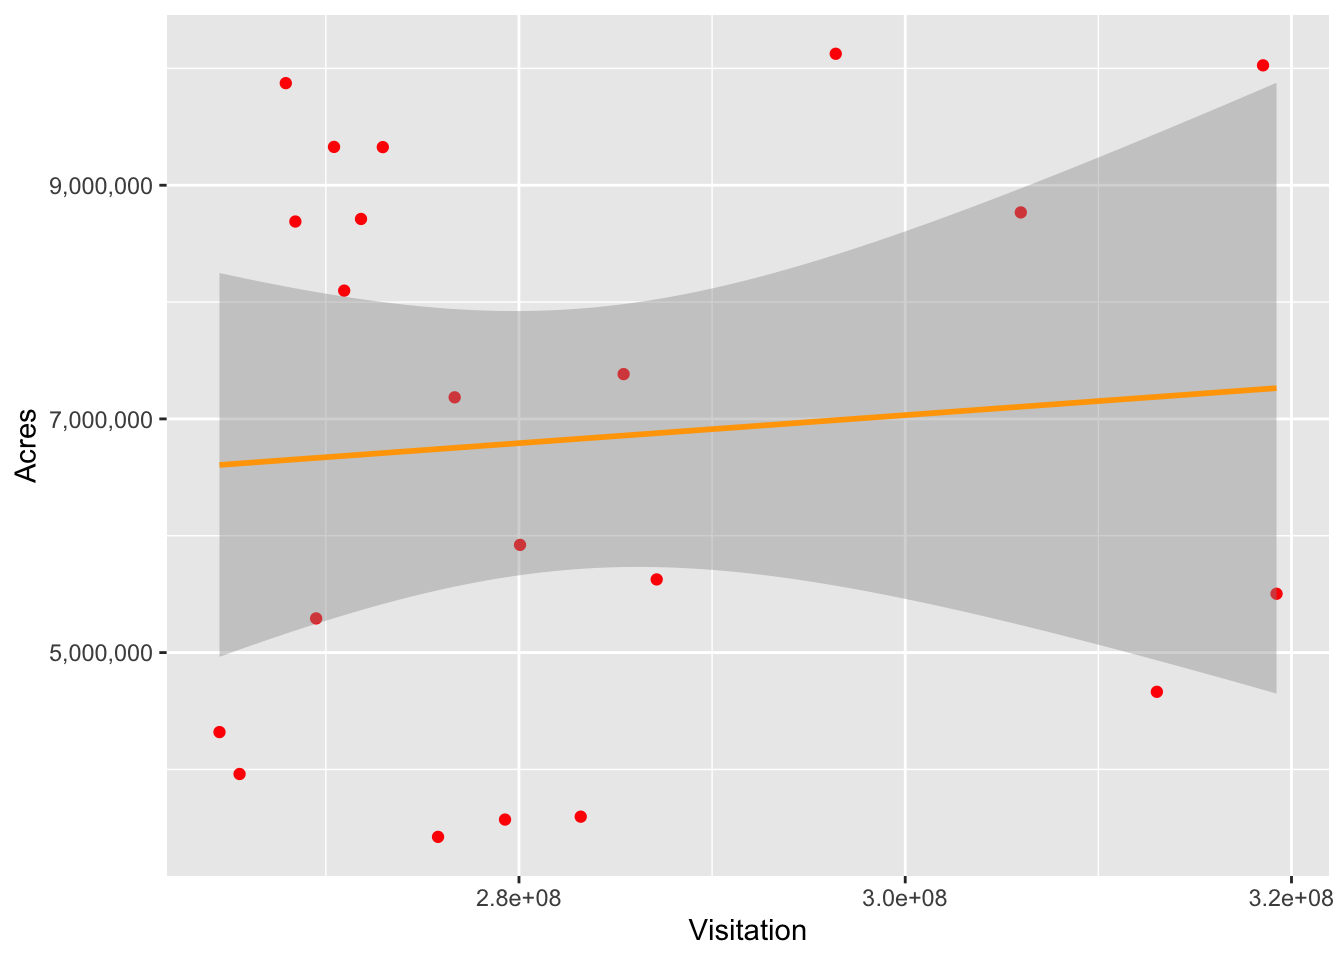 There seems to be no correlation between visitation and acres burned.
ggplot(df_final, aes(x = Visitation, y = Total)) + geom_point(col = 'red') +
geom_smooth(formula = y ~ x, method = lm, col = 'orange') +
xlab("Visitation") + ylab('Total Money') +
scale_y_continuous(labels = scales::comma)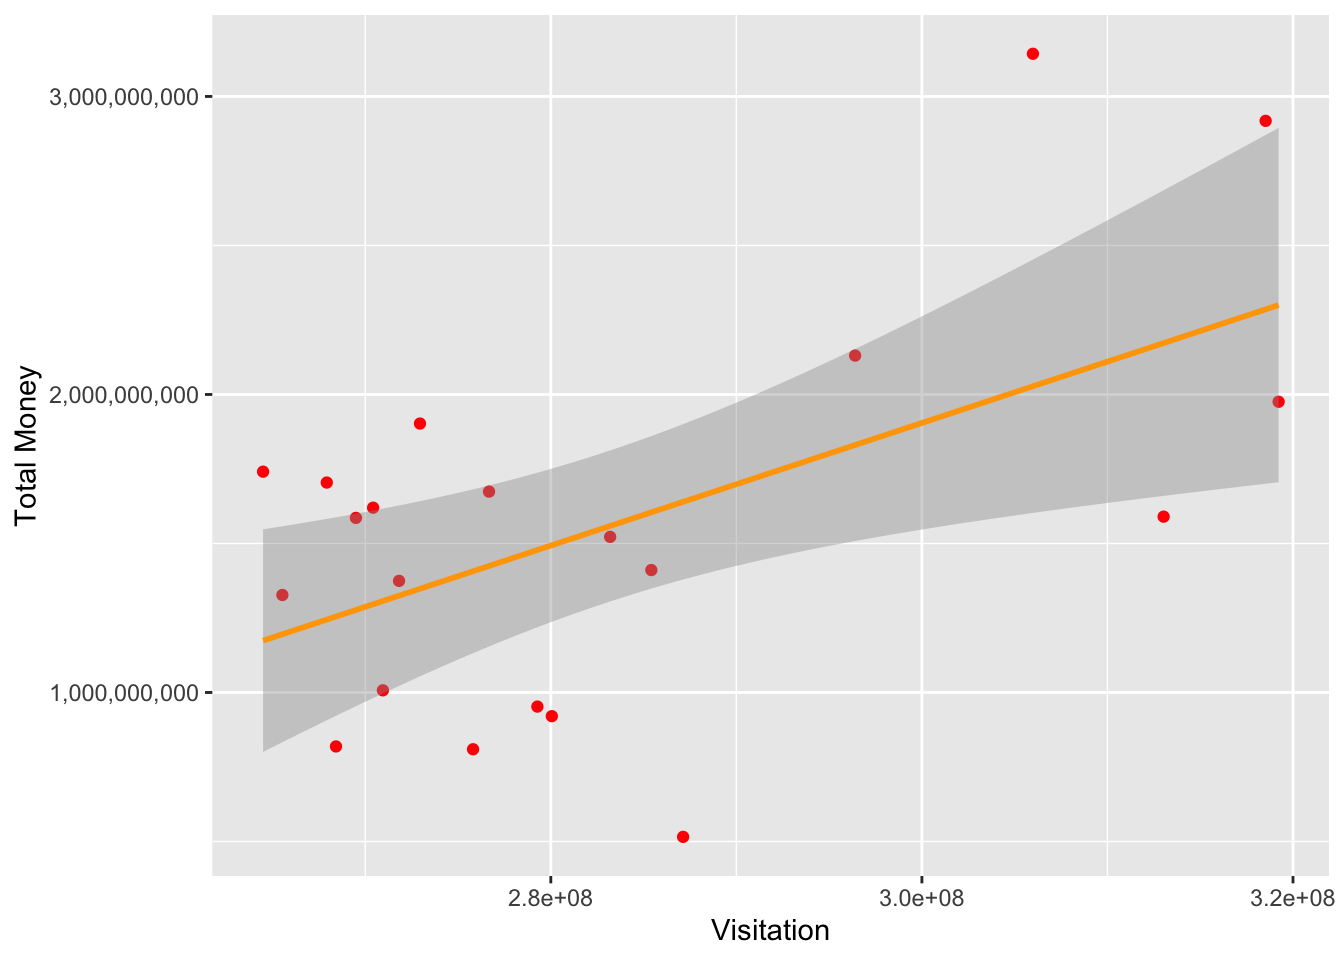 There seems to be a slight correlation between visitation and Total Money spent.
This might not be because of these two factors themselves, but a third unknown factor.
There seems to be a slight correlation between visitation and Total Money spent.
This might not be because of these two factors themselves, but a third unknown factor.
Although there is evidence from previous cases that high visitation causes fires, there are no strong correlations to be found with this data. Next steps to advance this further would be to transform the NPS IRMA data to spatial data so that specific geographic locations can be investigated Results from this deeper look would provide the NPS with valuable insights on what parks and areas to protect from visitation incidents.