Ecology
The following dataset(s) are ecology focused. Ecology is the study of how organisms interact with one another and with their physical environment. The distribution and abundance of organisms on Earth is shaped by both biotic, living-organism-related, and abiotic, nonliving or physical, factors. Ecology is studied at many levels, including organism, population, community, ecosystem, and biosphere. Read more about the study of ecology here.
Labeling study of water use by tundra evergreens in the winter spring transition
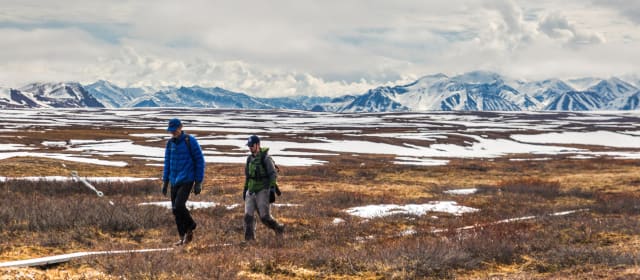 Co-PI, Steve Oberbauer, at Toolik Field Station — one of the world’s most remote research sites, located hundreds of miles above the Arctic circle. (Source)
The Data
Labeling study of water use by tundra evergreens in the winter spring transition.
This dataset is brought to you by Steven F. Oberbauer, Jonathan Moser, Gregory Starr, and Behzad Mortazavi.
The full paper associated with this dataset is avalible here.
What We Know
The cold season in the Arctic extends over 8 to 9 mo, yet little is known about vascular plant physiology during this period. Evergreen species photosynthesize under the snow, implying that they are exchanging water with the atmosphere. However, liquid water available for plant uptake may be limited at this time.
What we found out
Evergreen tundra plants take up water under snow cover, some via roots, but also likely by foliar uptake. The ability to take up water in the subnivean environment allows evergreen tundra plants to take advantage of mild spring conditions under the snow and replenish carbon lost by winter respiration.
Effects of aufeis on the structure and function of Arctic river-floodplain ecosystems, Alaska
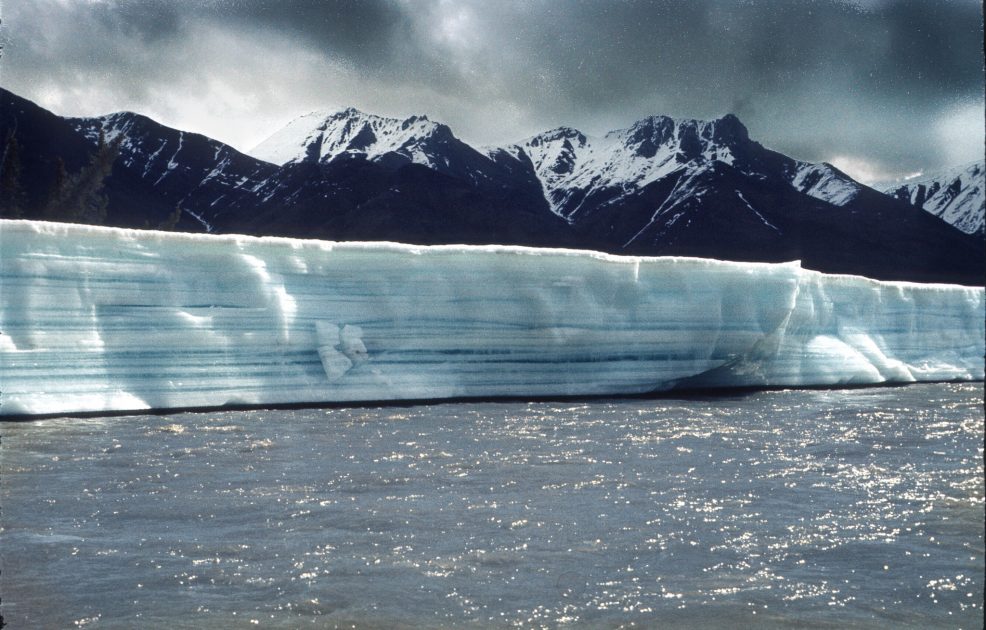 Aufeis on Alaskan River (Source)
The Data
This dataset is brought to you by Michael Gooseff and Alex Huryn. Michael Gooseff (he/him), a Professor in the Institute of Arctic and Alpine Research (INSTAAR) and in the Department of Civil Architectural & Environmental Engineering at the University of Colorado. He is currently the Lead Principal Investigator of the McMurdo Dry Valleys LsTER project and the Co-Director of the Hydrologic Sciences Graduate Program at CU. Dr. Gooseff conducts on-going research in Arctic Alaska, mostly from the Toolik Field Station and continues research in Antarctica.
The paper associated with this dataset is avalible here. Check out the research webpage here.
What We Know
Aufeis are massive accumulations of ice that are features of many arctic rivers. They form during freeze-up when thickening surface ice causes local overflows. Successive cycles of overflow result in accumulations of enormous volumes of ice, with aufeis on some Alaskan rivers attaining thicknesses of 3-5 meters, covering more than 20 square kilometers, and storing as much as 30% of the annual river discharge.
Although aufeis have been studied by hydrologists and are known to be required for winter and spawning habitat for some fish, understanding of their ecology is poor.
What we found out
The Kuparuk aufeis field provides subsurface habitat for a rich assemblage of freshwater invertebrates distinct from those occurring in surface level habitats. This level of richness is presumably enabled by the relatively high porosity of the subsurface sediments combined with a high level of connectivity between pore spaces. To our knowledge, this is the first demonstration of a groundwater (e.g., hyporheic/parafluvial/groundwater) invertebrate fauna in a region of continuous permafrost.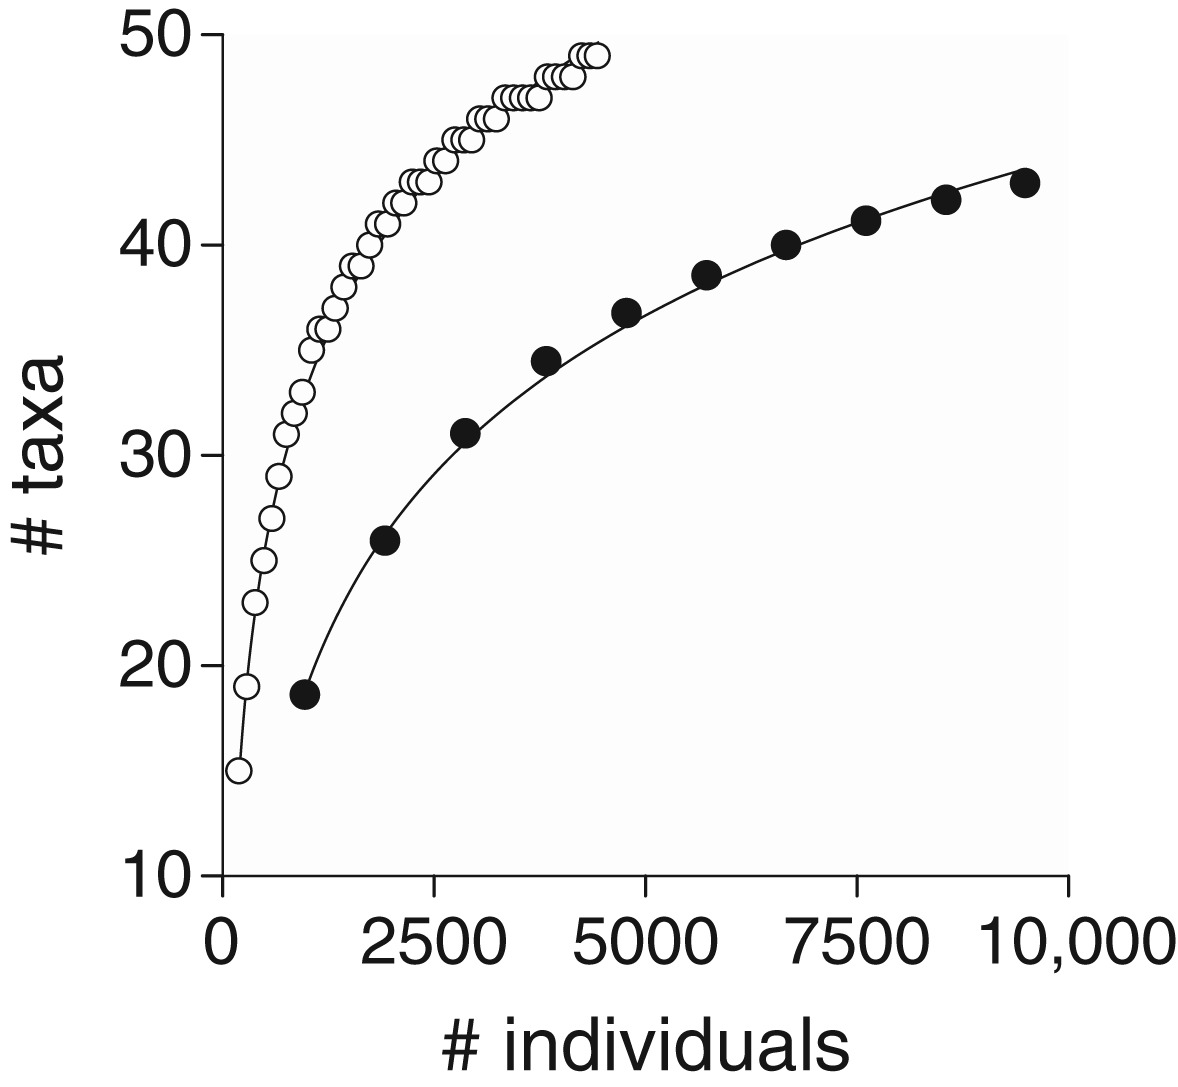
Rarefaction curves for invertebrates sampled from wells (closed circles) and surface sediments (open circles). The mean cumulative number of taxa per number of samples is plotted as a function of accumulated number of individuals sampled.
Note: In ecology, rarefaction is a technique to assess species richness from the results of sampling. Rarefaction allows the calculation of species richness for a given number of individual samples, based on the construction of so-called rarefaction curves. This curve is a plot of the number of species as a function of the number of samples. Rarefaction curves generally grow rapidly at first, as the most common species are found, but the curves plateau as only the rarest species remain to be sampled.