Chapter 5 Using GeoJSON in Leaflet
5.1 Creating a .geojson file
So far, we have created a Leaflet map, added some aesthetics such as markers, and even embedded a map into a dummy website. Alright, the website wasn’t even close to good, but the methodology should be the same when working with other fully functional and better looking websites. That may be enough to give you confidence to start as a webmapper but not so fast! There is still more territory to cover! I would like to introduce another format of storing geospatial information –the use of .geojson files.
5.2 What are .geojson files?
.geojson files, according to the GIS leader ESRI, are an open standard geospatial data interchange format that represents simple geographic features and their non-spatial attributes. GeoJSON is based on the JavaScript Object Notation (JSON) file format which is a lightweight data exchange format that is easily interpretable by both man and machine. In very few instances does any data format please both sides of the divide but JSON does, and this site provides examples. Anyway, just like you can tell from the name, JSON is based on the JavaScript programming language. If you have worked with JavaScript before, it looks very much like a data format based on dictionaries. In essence, JSON is a large dictionary holding other dictionaries of data within it. A GeoJSON is a JSON file that follows a certain structure and has spatial index and geometry specifications in it. See this website for a GeoJSON example.
An example of a GeoJSON file format structure is shown below:
{
  "type": "FeatureCollection",
  "features": [
    {
      "type": "Feature",
      "properties": {
        "City": "Nairobi",
        "Population": "4, 300, 000"
      },
      "geometry": {
        "coordinates": [
          36.80617598261199,
          -1.2868825246637812
        ],
        "type": "Point"
      }
    },
    {
      "type": "Feature",
      "properties": {
        "City": "Kisumu",
        "Population": "610, 082"
      },
      "geometry": {
        "coordinates": [
          34.738718987625106,
          -0.10390483386935045
        ],
        "type": "Point"
      }
    },
    ---snip----
Below is an example of a json file structure.
{

"Influencers" :   [
{
 "name" : "Jaxon",
 "age" : 42,
 "Works At" : "Tech News"
}

{
 "name" : "Miller",
 "age" : 35
 "Works At" : "IT Day"
}

]
}
5.3 Why geojson?
Yours truly could be wrong, but one advantage of geojson and json is that it’s minimal on size compared to shapefiles and it is also more portable. Shapefiles are dependent on other data formats that accompany it, such as .shx, .dbf, .prj which provide auxillary geospatial orientation, metadata, and attributes. On the other hand, GeoJSON and JSON formats will come as single files but will still as much data as all the components of a shapefile (.shx, .dbf, and .prj) put together.
So when do I use shapefiles vis a vis GeoJson? If you want to work with geospatial data in a web interface, geojson is the way to go. Period.
5.4 Creating a geojson file
It may look intimidating to create a GeoJSON file without hardly making any errors, and it actually is, but luckily the geojson.io website does the heavy lifting for us. We shall head over to it and create a geojson file of some cities and their population.
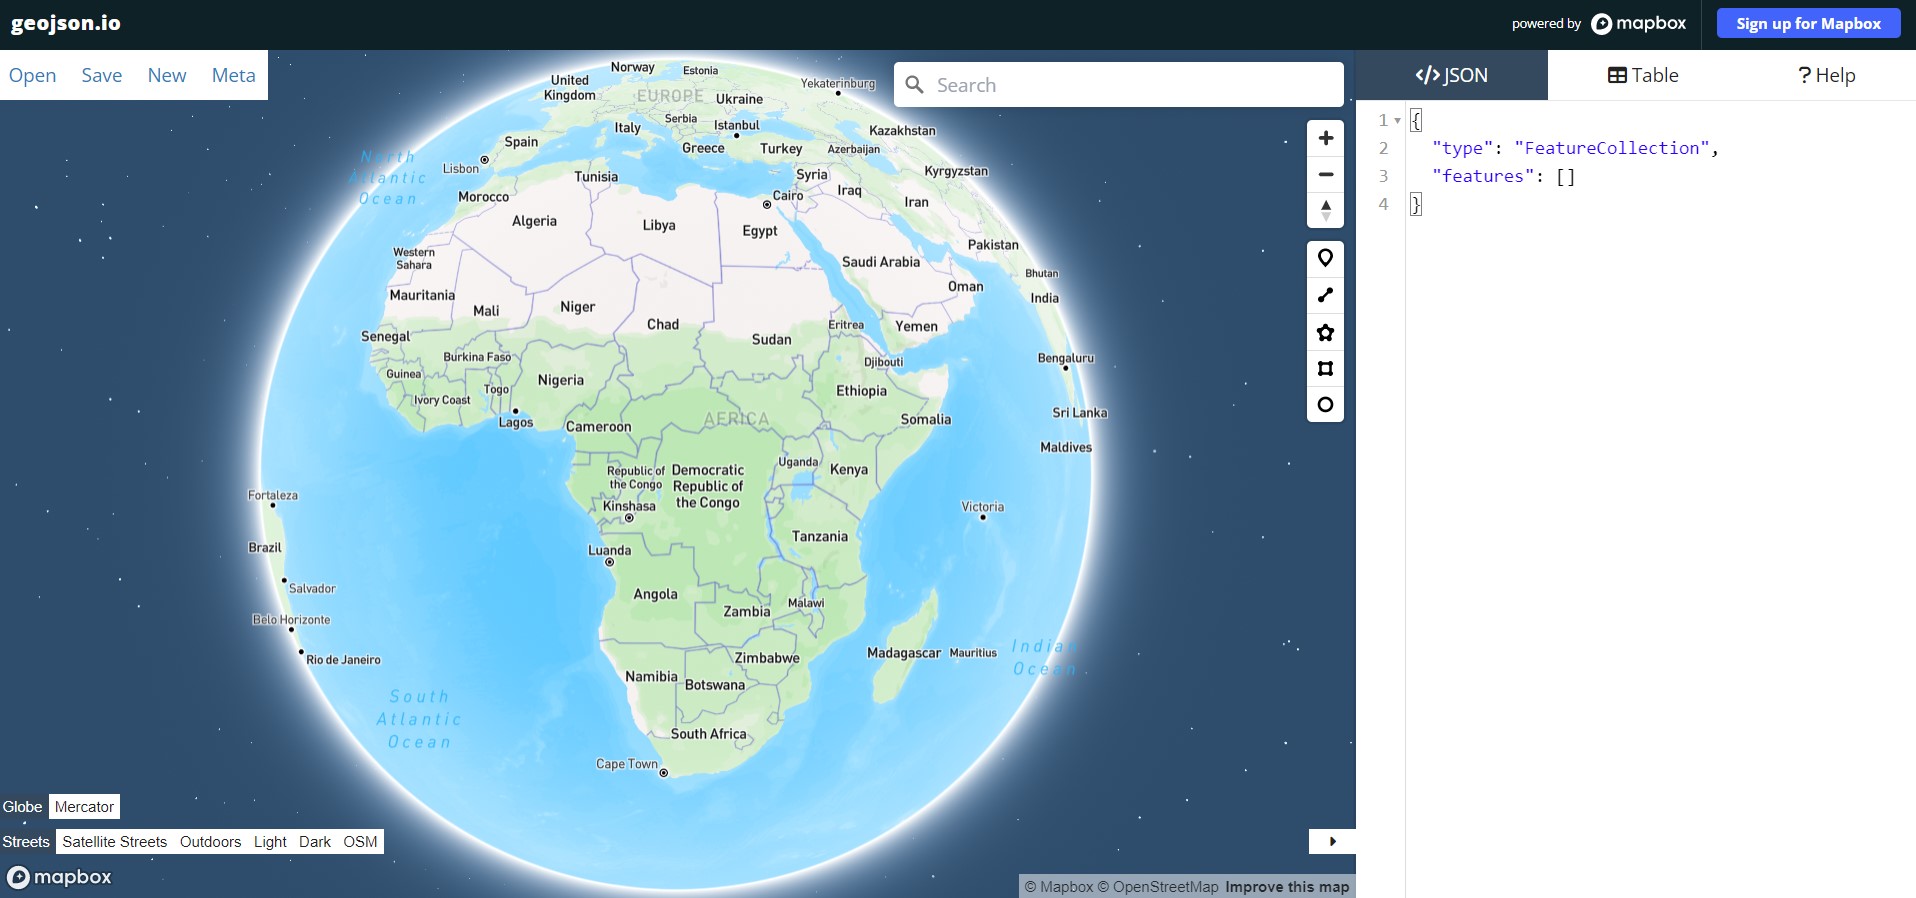
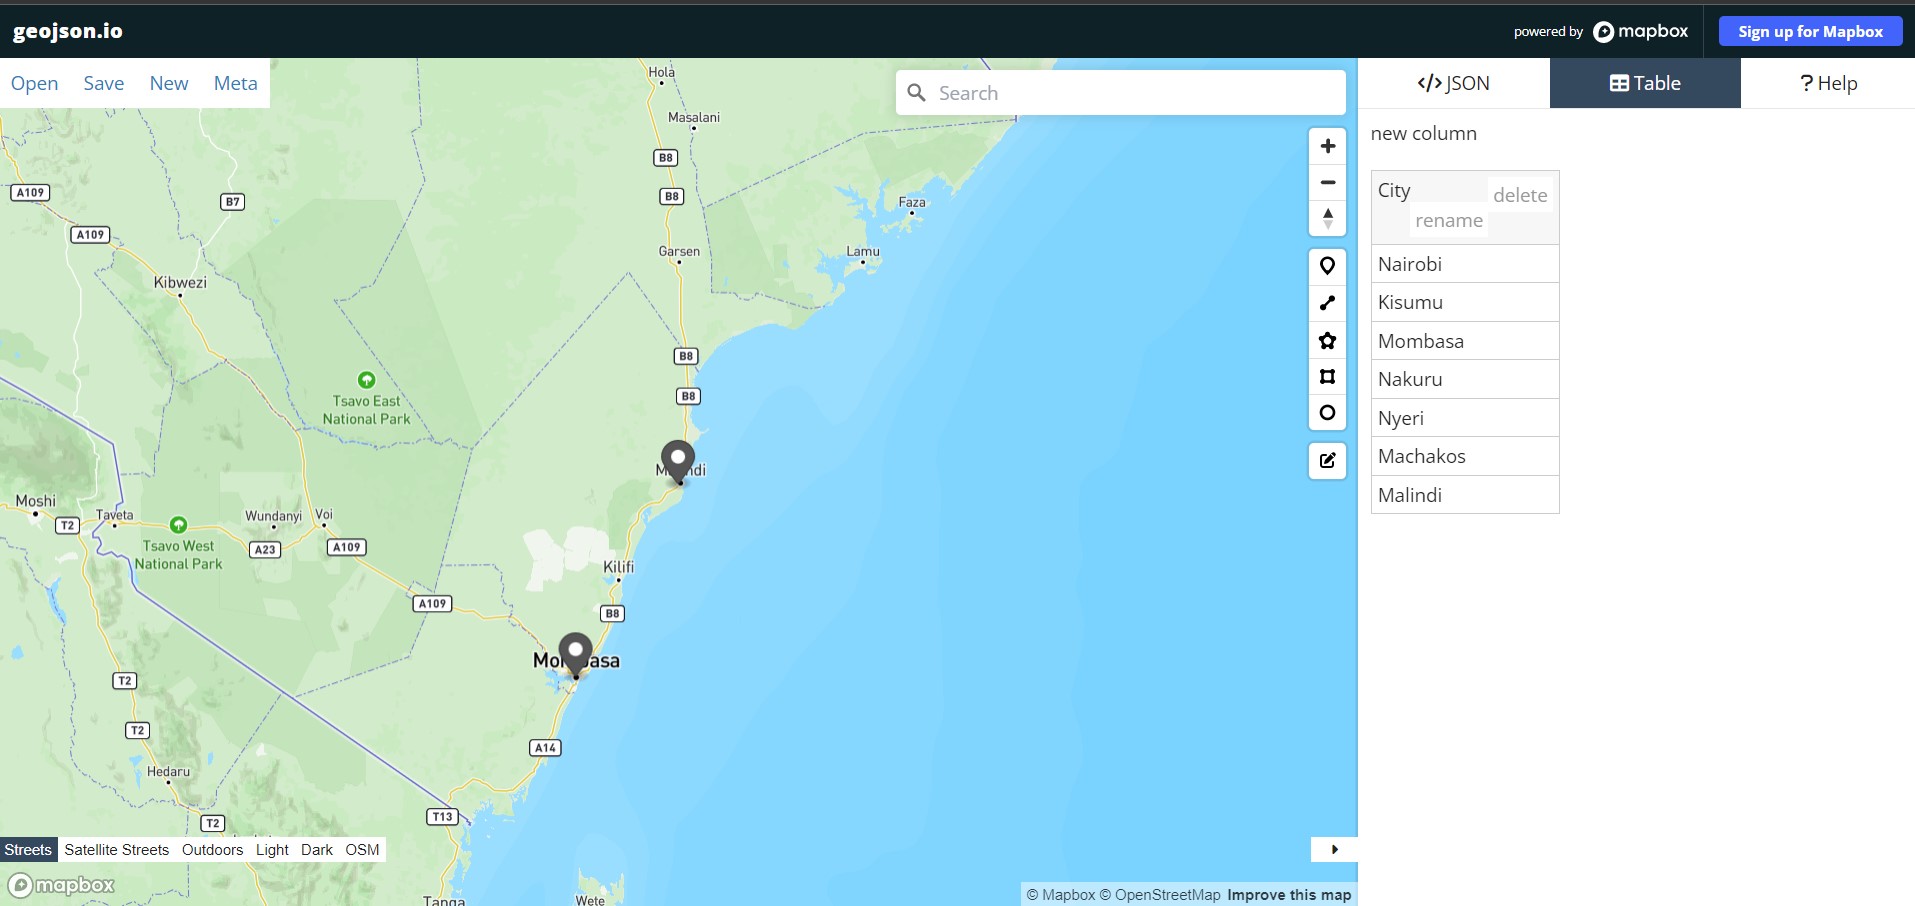
First, of all, the website looks like below. Talk of a cool global map powered by Mapbox.
On your right, under the </>JSON tab, the Mapbox folks have already given you a head start by indicating what feature type and features will go into your geojson file. These are important as any website uses these keywords when parsing information from the GeoJSON file. Zoom to Kenya and click a point on top of the Nairobi dot pin, like shown below. Use the highlighted pin in the image below to create a marker over Nairobi.
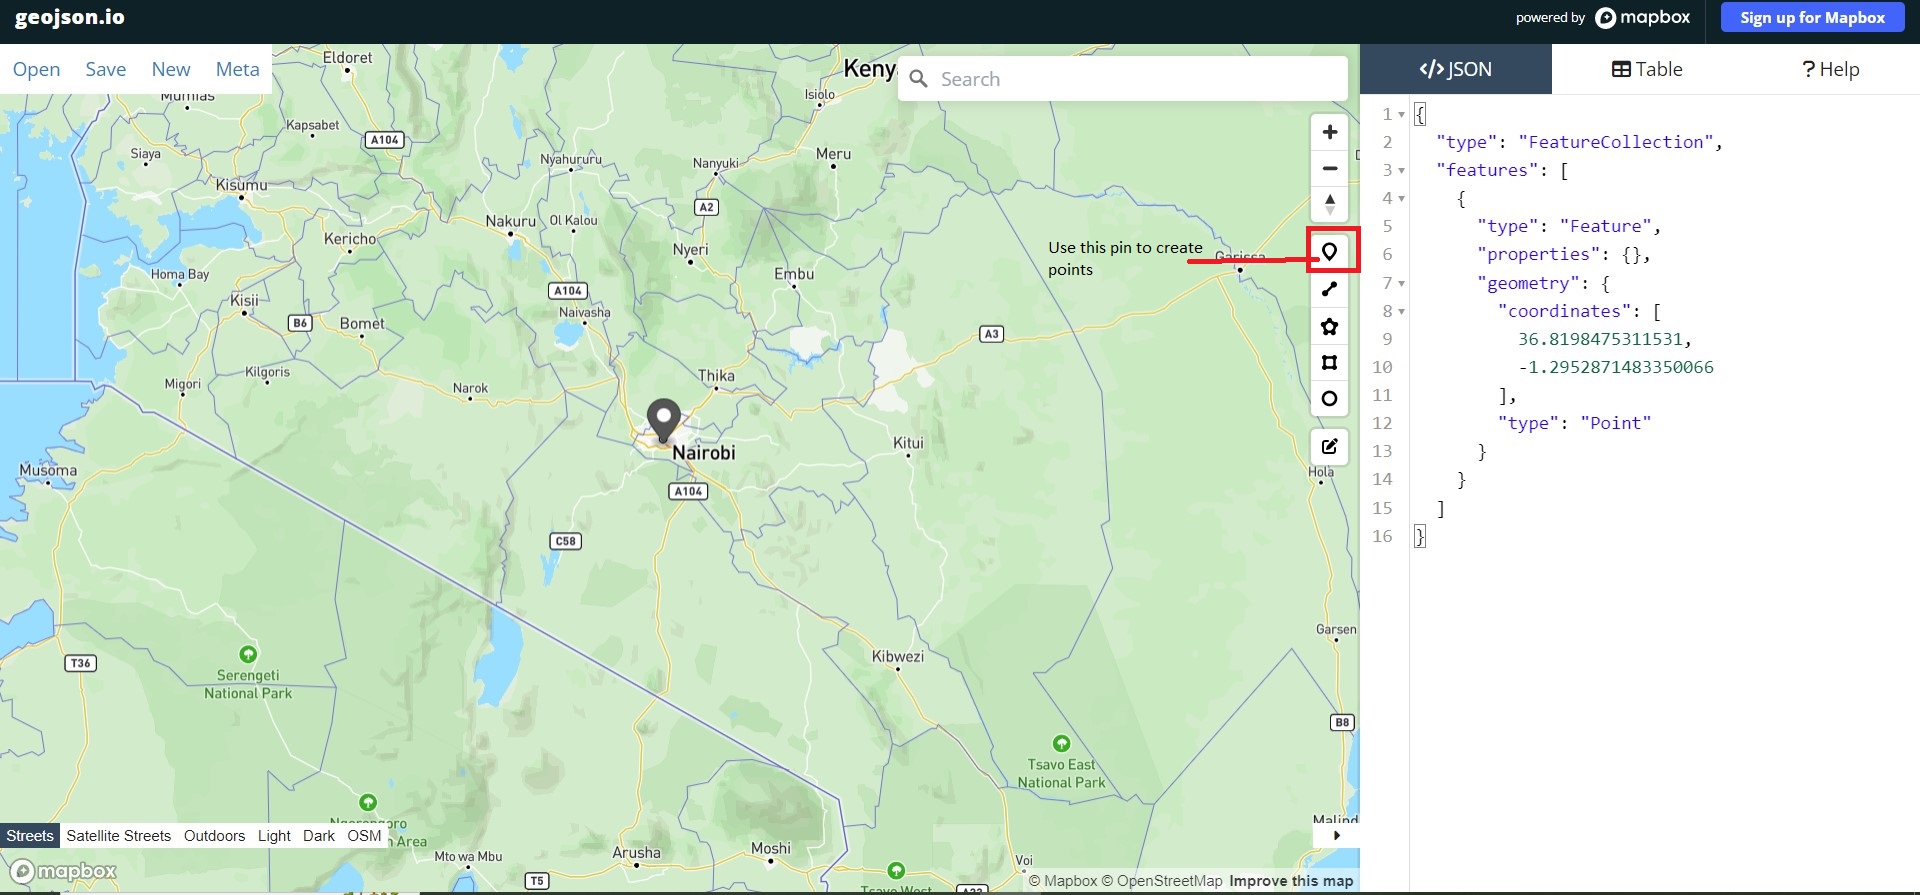
By doing so, you will realize that a new dictionary of type, properties and geometry appears within the features list. These new keys provide the additional spatial and geometry data in their values which a website uses to place them at their appropriate locations on the webmap.
Now move over to the Table tab and click new column as shown below.
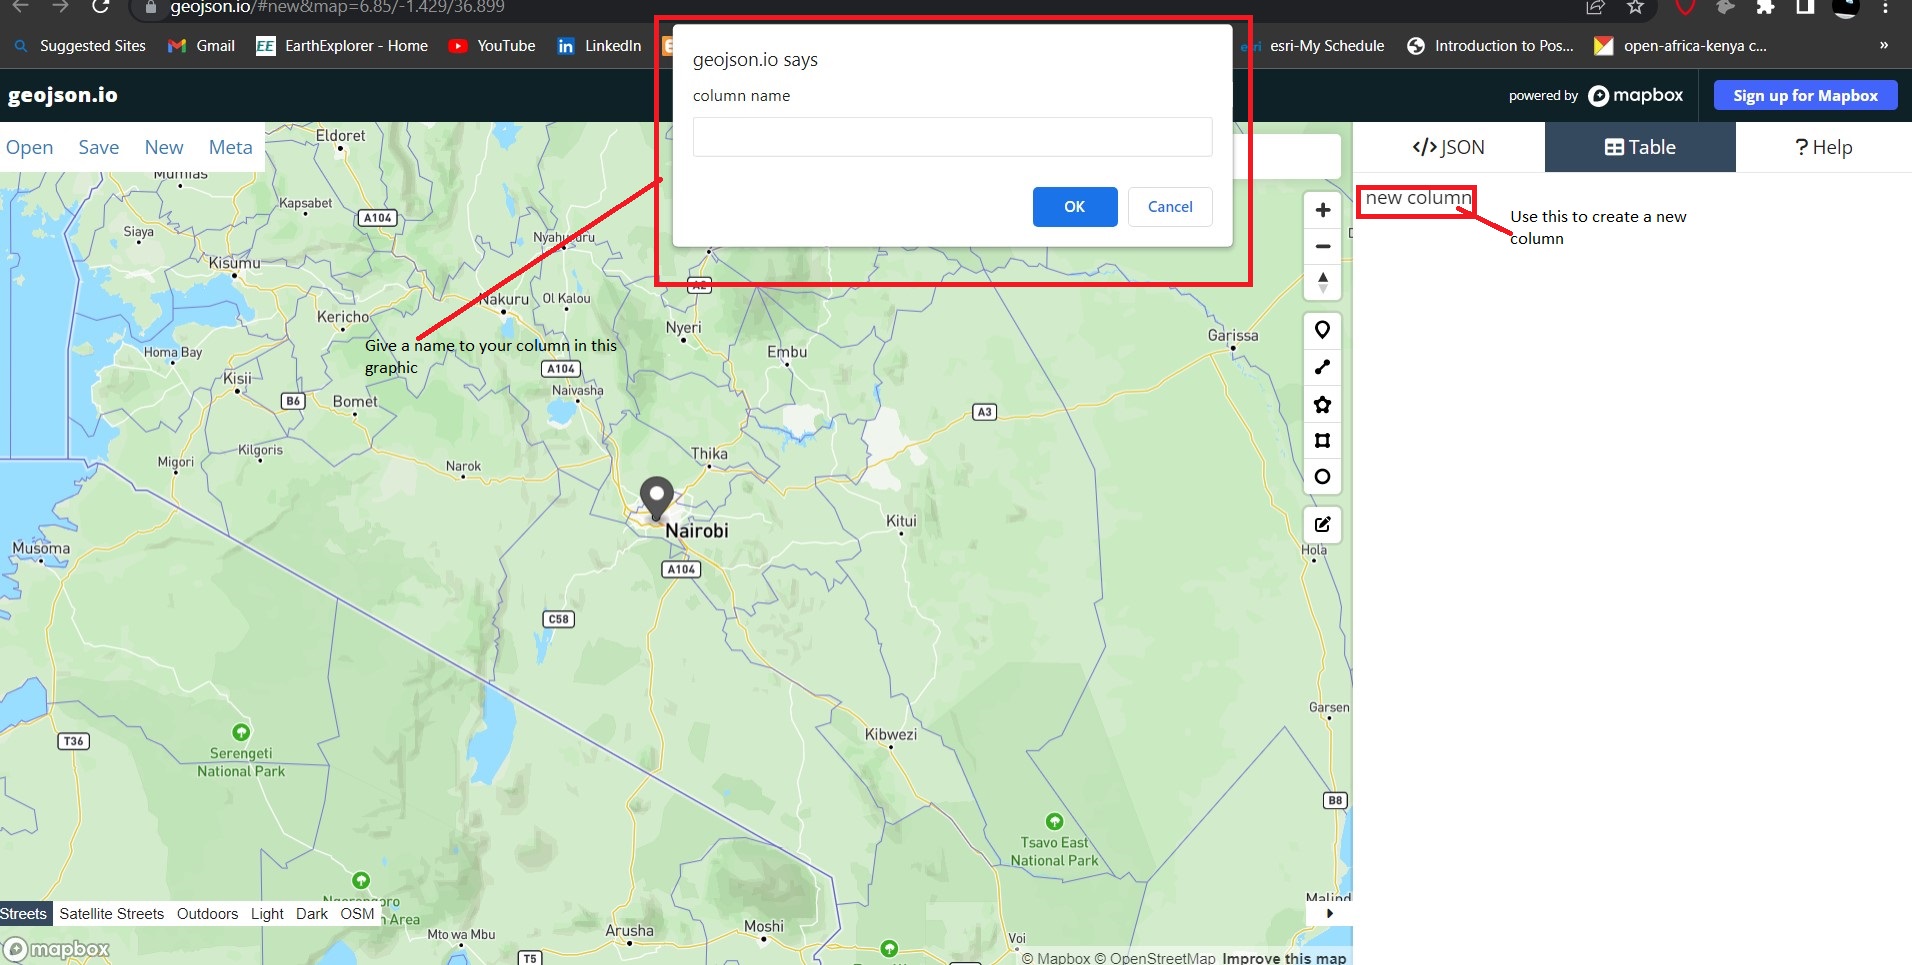
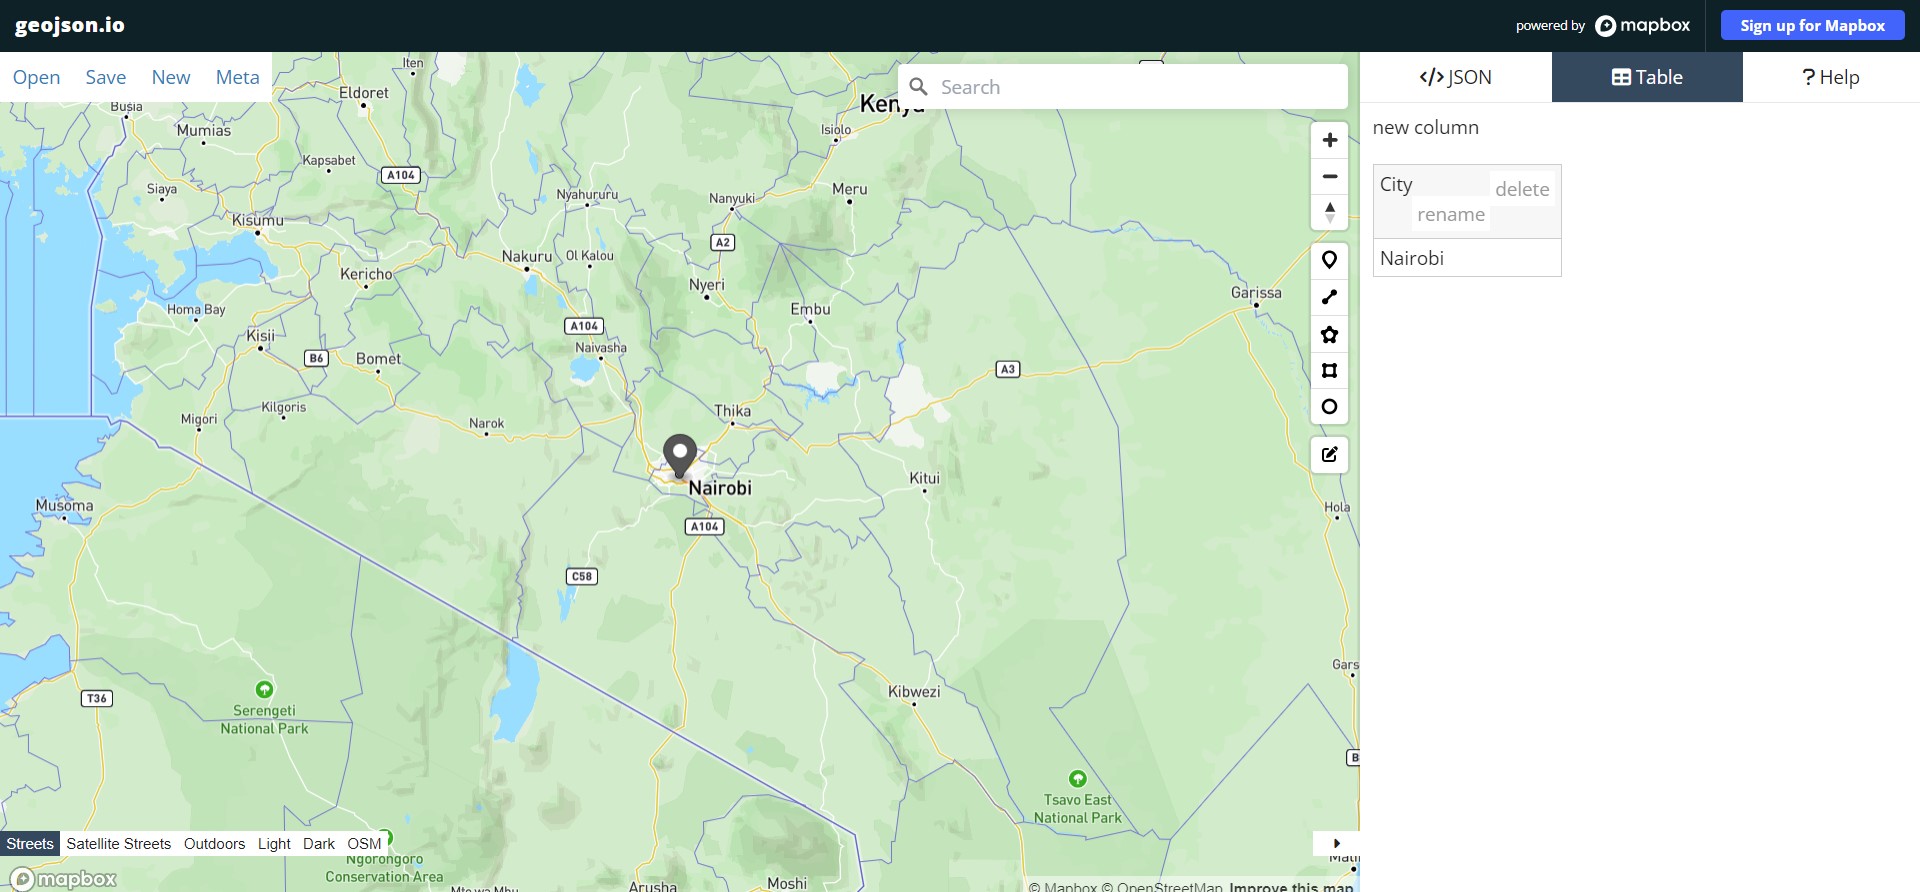
Click on it and in the graphic that appears, give your column the name City. Click Ok and in the table cell that appears, type Nairobi.
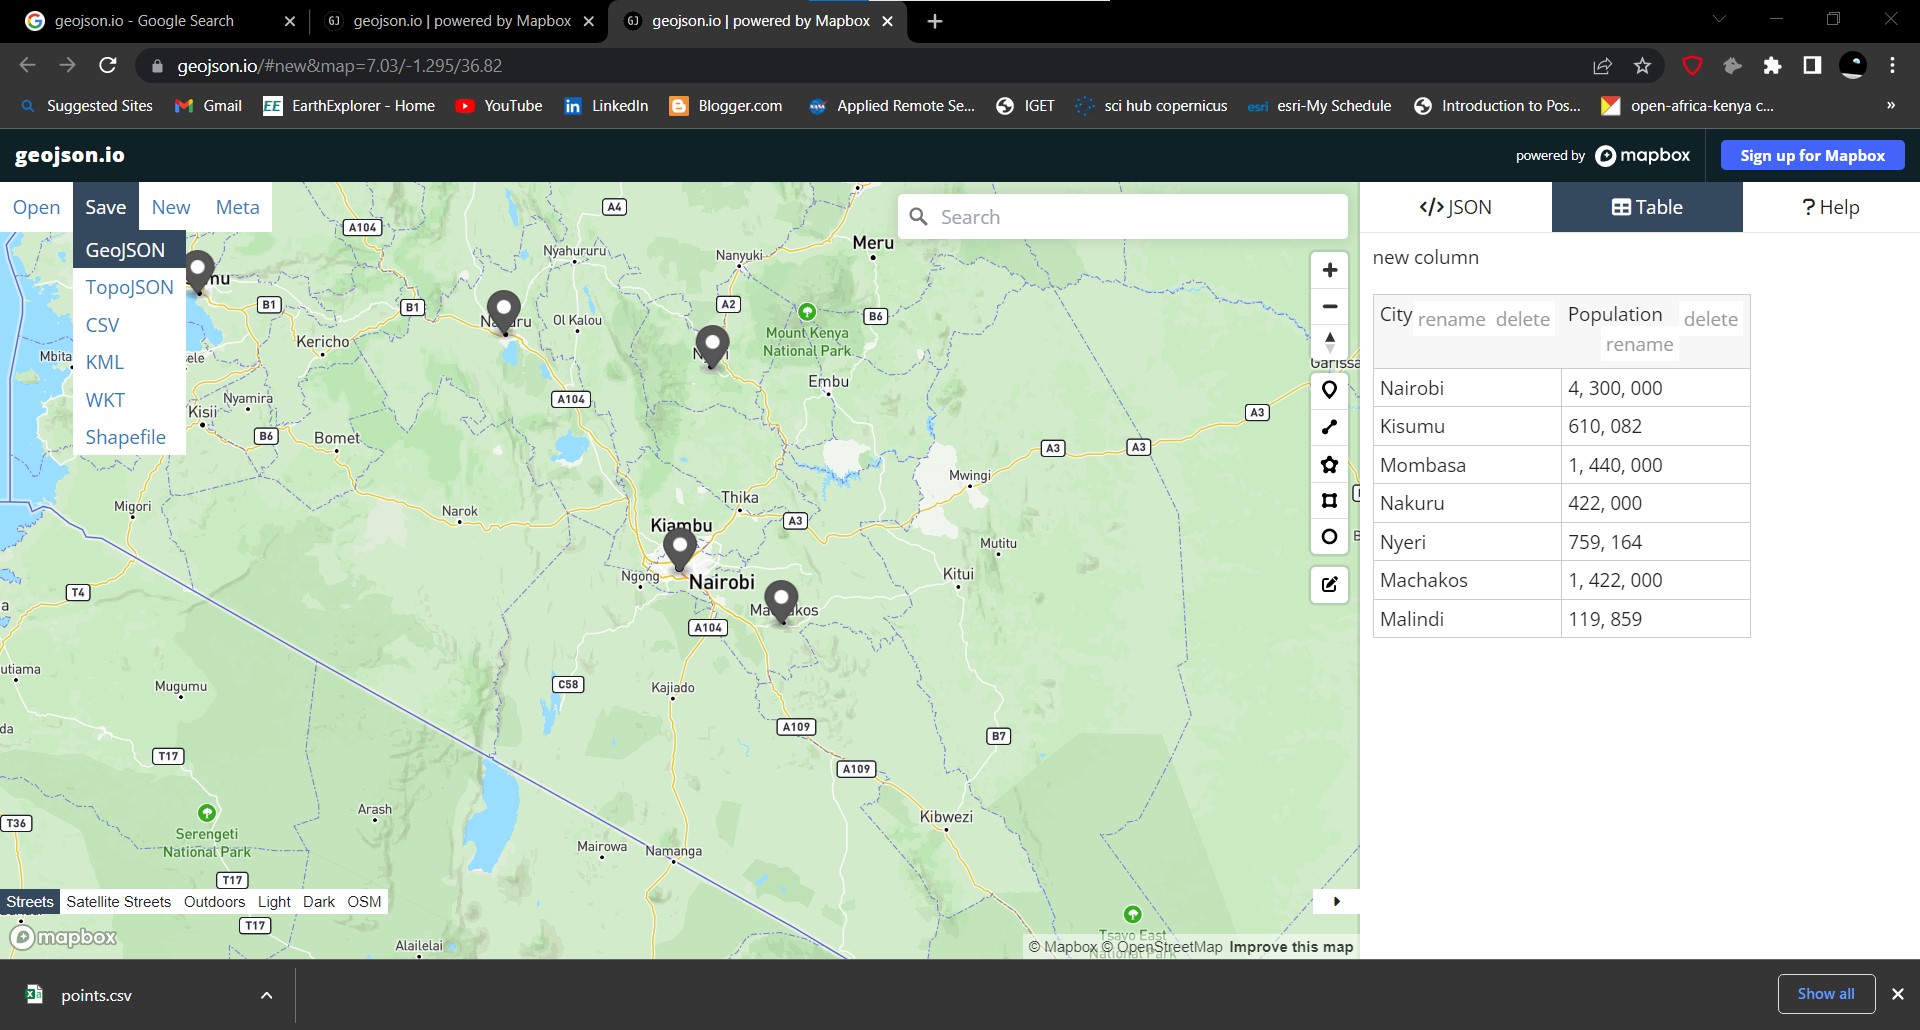
Now create a new pin over Kisumu and two things will happen: a new dictionary will appear below that of Nairobi and a new table row will appear in the Table tab. Create pins over the following cities: Mombasa, Nakuru, Nyeri, Machakos and Malindi. Legally speaking, only the first four are cities by law, the rest are just towns but for the sake of this tutorial, let’s corporately refer to them as cities.
Alright, one process down, one more to go. We will fill these cities with their population statistics. Create a new column with the heading Population. Fill each of the cities with the following statistics.
##       City  Population
## 1  Nairobi 4, 300, 000
## 2   Kisumu    610, 082
## 3  Mombasa 1, 440, 000
## 4   Nakuru    422, 000
## 5    Nyeri    759, 164
## 6 Machakos 1, 422, 000
## 7  Malindi    119, 859
Once done, head over to the top left of the geojson.io website, and click Save. A list of options will appear, click on save as geojson. It should appear somewhere in your Downloads directory.
5.5 Saving the Geojson to Github
Now, based on experience, loading a local Geojson file (one within your computer directory) to JavaScript is a painful, if not near impossible experience. The resulting errors had to with servers or something. To get a way around this and still be able to display .geojson data in Leaflet, the GeoJson file had to be stored on an online server, in this case, Github. We would love to show you how to save data on Github, but this would make this chapter way too long. Therefore, and with sincere apologies, it would be best if you googled it out. Nevertheless, here is the GeoJSON file, and it will come in handy in the last two sub-chapters of this exercise.
5.6 Loading the GeoJSON into Leaflet
As they always say, there are many ways of killing a rat. There are around three ways in which to load GeoJson data into Leaflet, at least from our discovery. We shall start with the easiest and most unreliable to what we consider the best. Let start with the easy one, loading a .geojson file from within our Javascript file itself.
5.6.1 The easy way
First of all create a blank JavaScript file called geojson.js. Thereafter, go to your map.html file which you had created last in Chapter 2. Open it. Within the <script> tag of the <body> element, change the src attribute to read "geojson.io" like below.
<!DOCTYPE html>
<html lang="en">
    <head>
        -- snip ---
    </head>
    <body>
        <div id="myMap">
            <script src="geojson.js">
            </script>
        </div>

    </body>
</html>
Alright. Head over to your geojson.js and as always, add the Leaflet classes L.map and L.tileLayer. We set the view of our new Leaflet map to that of Nairobi. Your blank geojson.js should now be filled with the below code.
var map = L.map('myMap').setView([-1.295287148, 36.81984753], 7);
L.tileLayer('https://tile.openstreetmap.org/{z}/{x}/{y}.png', {
maxZoom: 19,
attribution: '© <a href="http://www.openstreetmap.org/copyright">OpenStreetMap</a>'
}).addTo(map);Okay. Head over to geojson.io website and right under the </>JSON you will see a copy icon.
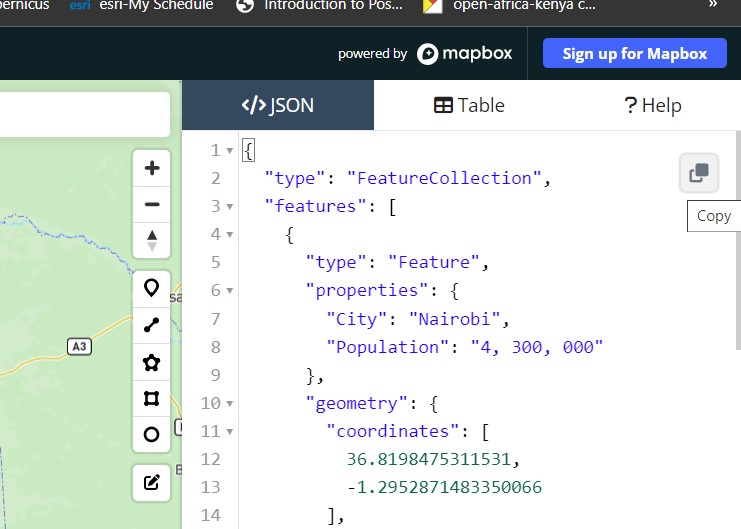 Click it and paste the json code into your
 geojson.js file right above the other L.map and L.tileLayer classes. The contents of your geojson.js should look like below.
var cities = {
"type": "FeatureCollection",
"features": [
{
"type": "Feature",
"properties": {
"City": "Nairobi",
"Population": "4, 300, 000"
},
"geometry": {
"coordinates": [
36.8198475311531,
-1.2952871483350066
],
"type": "Point"
}
},
-- snip ---
{
"type": "Feature",
"properties": {
"City": "Malindi",
"Population": "119, 859"
},
"geometry": {
"coordinates": [
40.10521499751357,
-3.2138767356491655
],
"type": "Point"
}
}
]
}
var map = L.map('myMap').setView([-1.295287148, 36.81984753], 7);
L.tileLayer('https://tile.openstreetmap.org/{z}/{x}/{y}.png', {
maxZoom: 19,
attribution: '© <a href="http://www.openstreetmap.org/copyright">OpenStreetMap</a>'
}).addTo(map);
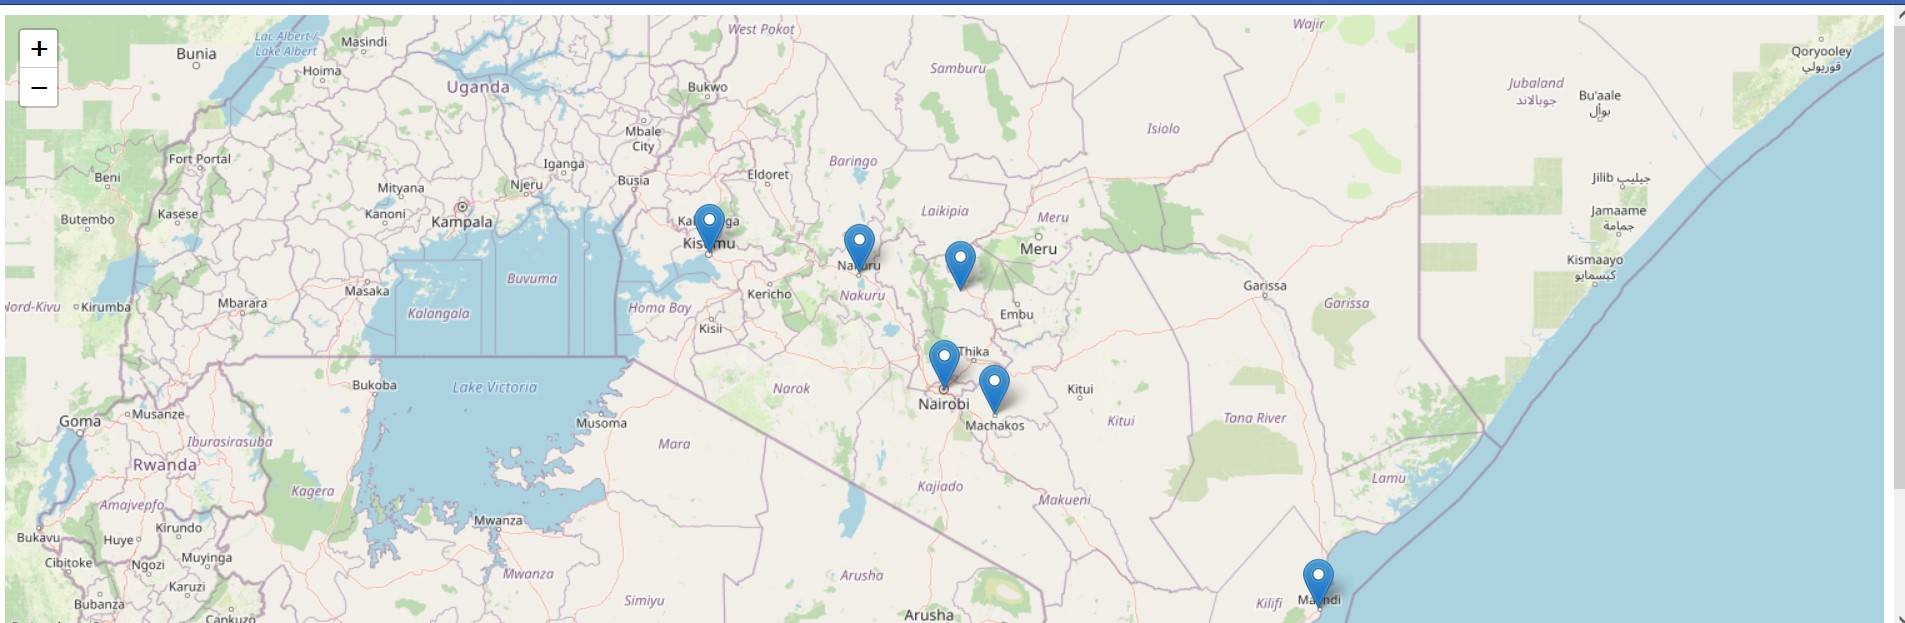
Refresh your map.html. It’s a map of Kenya alright, but none of our .geojson features appear yet. We are about to change that. Leaflet offers the L.geoJSON class to add GeoJSON data to a map. The class name speaks for itself and therefore let’s use it to add our GeoJSON features. Add the following code below the other Leaflet map class layers.
L.geoJSON(cities).addTo(map);Refresh your map.html. The GeoJSON features should now appear at their exact locations.
How about if we made the markers more interactive? Say, like they display popups as we did in Chapter 3? We would like the city names to appear upon a user’s click on the markers. Easy. Just create a function that does so as in the logic provided here. We customized it to our case to make sure it references to the City key which is part of the dictionary attached to the properties key.
L.geoJSON(cities).bindPopup(function (layer) {
    return layer.feature.properties.City;
}).addTo(map);

There is one issue with this method. If we have a very long GeoJSON data structure, it will clatter our JavaScript file. We only worked with seven cities, but it is very common to work with data holding hundreds and even thousands of dictionaries. That would make your JavaScript file stretch to ad infitum.
This brings us to the other two methods, that of using the Ajax plugin and using the Fetch Application Programming Interface (API). Don’t let the words scare you. Take a break, grab a glass of water and come back.
5.6.2 Using the Ajax Plugin
As the term ‘plugin’ suggests, this is an extension that offers additional functions to the core Leaflet plugin. The Ajax plugin is available from this link. Download it to your directory and preferably within the same directory as your map.html and geojson.js. Alright. Right under the src for leaflet.js in your map.html, add the following <script> tag.
    <head>
        -- snip --
        <script src="leaflet-ajax-gh-pages\dist\leaflet.ajax.js"></script>

    </head>
    -- snip --
This file will allow you to add .geojson files to your Leaflet map. However, there is a catch. Both the Ajax and Fetch APIs only work with GeoJson file formats saved on a web server. Based on experience, they will not work with local GeoJson files. As a work around, we saved our GeoJSON file to Github. For convenience, here is the link again to the raw file we had initially created from geojson.io.
We shall call our GeoJSON file from Github using Ajax as shown in the code below. Please remember to comment out your var cities and L.geoJSON using \\ because they are irrelevant in this particular case.
var geojsonLayer = new L.geoJson.ajax("https://raw.githubusercontent.com/sammigachuhi/geojson_files/main/cities-geojson.geojson").addTo(map);Your map should now show the markers of our cities. If you are hawk eyed, you may have noticed that the syntax for Ajax is different from that of the earlier L.geoJSON from Leaflet. Starting with the latter, we have instead used L.geoJson and unlike in the Ajax creator’s website where they used var geojsonLayer = new L.GeoJSON.AJAX(<your-geojson-file>) we used the following syntax: L.geoJson.ajax() (ajax and geoJson beginning with small case). Actually, that’s what worked after quite a lengthy web search.
Just like using L.geoJSON, we can also add popups after calling the .ajax method.
var geojsonLayer = new L.geoJson.ajax("https://raw.githubusercontent.com/sammigachuhi/geojson_files/main/cities-geojson.geojson")
    .bindPopup(function (layer) {
        return layer.feature.properties.City;
    }).addTo(map);
Doing so should make the city names appear on clicking the markers on your Leaflet map.
5.6.3 Using Fetch API
Fetch API is a modern interface that allows you to make HTTP requests to servers from web browsers. In other words, it searches for a resource over the web, retrieves it, and brings it to you. Think of it as a dog in which you throw a saucer and tell your faithful hound: “Sabretooth, fetch!”. The dog runs after the saucer, grips it with its canines mid-air and quickly brings it back to you. Same case with Fetch API!
I had mentioned I will show you how to retrieve our Github stored GeoJSON data and I shall stick to the script! I shall also attempt to explain how this mysterious fetch works.
First things first. The fetch function shall be called and passed to our Github url containing our GeoJSON text. Since fetch is an API, it retrieves data from Github.io –the server in this case–and brings it to our laptop the –the client. Enough IT. Let’s write it down.
fetch("https://raw.githubusercontent.com/sammigachuhi/geojson_files/main/cities-geojson.geojson")Okay, next step. Once the server beams back the data to us, what do we do with it? According to Digital Ocean, the response is not actually the data in the original format but rather a series of methods that can be used depending on what you want to do with the information. This sounds downright confusing. Nevertheless, it is at least crystal clear that the end goal is to have our fetched data in JSON format. Converting an object to JSON is done using the json() method. We parse .json() to a then method which is an asynchronous function1. After the fetch function is successful, the object is stored in the response argument, which is in brackets, and then the function returns the result as a json object.
fetch("https://raw.githubusercontent.com/sammigachuhi/geojson_files/main/cities-geojson.geojson")
    .then(function(response) {
        return response.json()
    })
After converting our response to JSON, it still needs to be processed further. Processed to what? To a GeoJSON file and subsequently add it to our Leaflet Map.
fetch("https://raw.githubusercontent.com/sammigachuhi/geojson_files/main/cities-geojson.geojson")
    .then(function(response) {
        return response.json()
    })
    .then(function(data) {
        L.geoJson(data).addTo(map);
    })
We shall also add one more function –the catch() method. catch() is a method that returns an action if our response to the server has been rejected. Let’s demonstrate all this.
fetch("https://raw.githubusercontent.com/sammigachuhi/geojson_files/main/cities-geojson.geojson")
    .then(function(response) {
        return response.json()
    })
    .then(function(data) {
        L.geoJson(data).addTo(map);
    })
    .catch(function(error) {
        console.log(`This is the error: ${error}`)
    })
To see the catch() in action, omit the last letter in our url so that it reads cities-geojson.geojso. Yeah, you read it right. Just omit the letter ‘n’ for now and reload your map.html. Right click the webmap page and click on Inspect in the small interface that appears. Head over to the console tab and see the error response. It should read like in the below image.
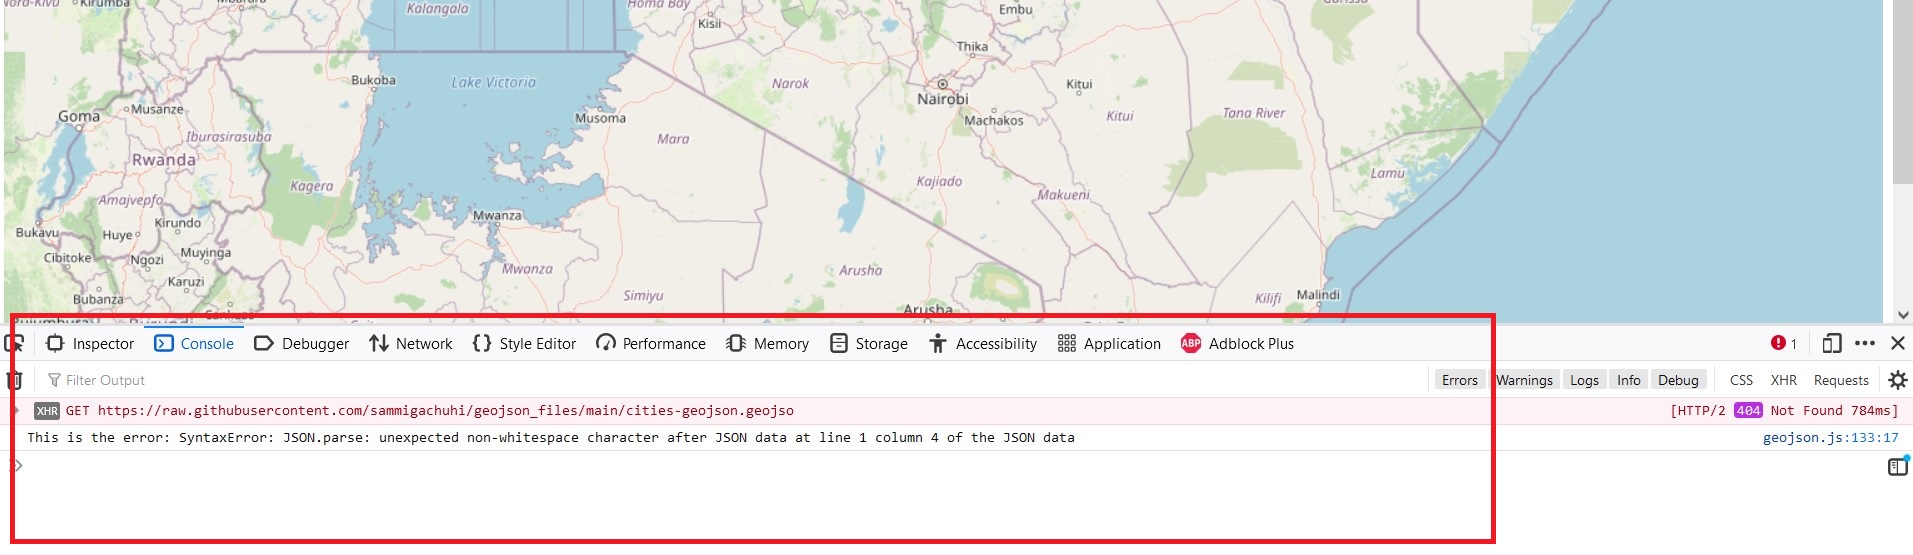
Restore the omitted letter ‘n’ and reload your map.html. Your Leaflet map should have the city markers overlain just like in the case of using Ajax plugin or hardcoding the Geojson data into var cities. To stretch your Javascript skills further, we can shorten our code further by retaining the arguments response, data and error and using the arrow function => to pass on the return statements, like so:
fetch("https://raw.githubusercontent.com/sammigachuhi/geojson_files/main/cities-geojson.geojson")
    .then((response) =>{
        return response.json()
    })
    .then((data) => {
        L.geoJson(data).addTo(map);
    })
    .catch((error) => {
        console.log(`This is the error: ${error}`)
    })
It looks cryptic but don’t cry! We have only ommitted the function() keyword and instead added => between function() and the curly brackets {<code-to-run>} which is the function body aka where the magic happens. Just like when using Ajax, we can also add other functionalities to L.geoJSON within the fetch plugin. In here, and thanks to the use of template literals (``), we can even add statements and refer to our GeoJson keys (and in some cases, even variables) using ${}. Whatever is within the ${} is executed and passed out as a string to the template literals.
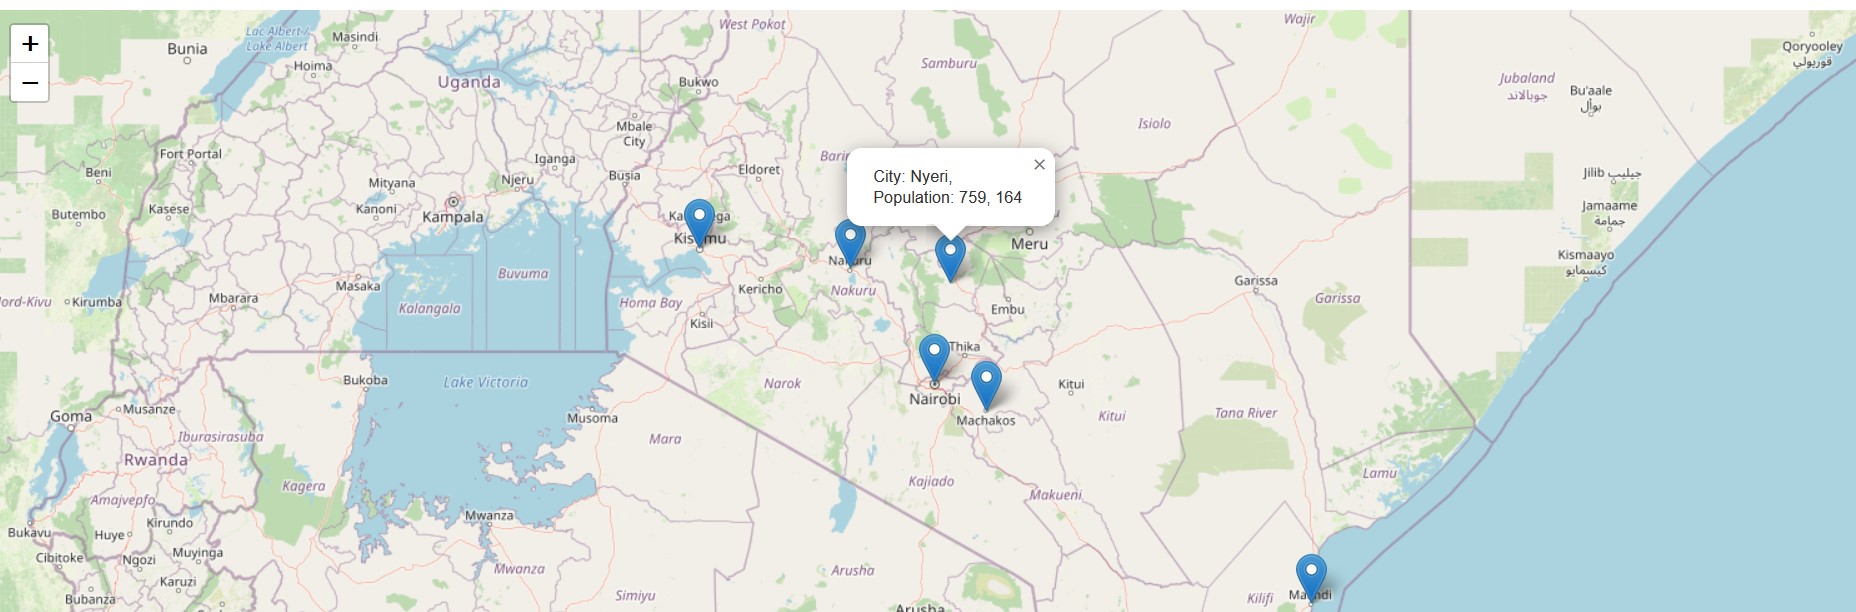
fetch("https://raw.githubusercontent.com/sammigachuhi/geojson_files/main/cities-geojson.geojson")
    .then((response) =>{
        return response.json()
    })
    .then((data) => {
        L.geoJson(data).bindPopup((layer) => {
            return `City: ${layer.feature.properties.City},<br>
            Population: ${layer.feature.properties.Population}`}).addTo(map);
    })
    .catch((error) => {
        console.log(`This is the error: ${error}`)
    })
In the return statement above, we added the HTML tag <br> to separate the City and Population keys from our GeoJSON. Doing so will return neat marker texts where the city name and population figures are in two separate lines.
Enough Javascript for a day!
Here are the full files used in this chapter.
5.7 Summary
Who thought that simple GeoJSON files would be so complicated to load and see? Lets recap what we’ve learnt.
GeoJSON files are an open standard geospatial data interchange format that represents simple geographic features and their nonspatial attributes.
GeoJSON is based on the JavaScript Object Notation (JSON) file format known for its lightweight nature.
GeoJSON files are the lingua franca of working with spatial information on the web.
The geojson.io website allows a user to create a GeoJSON file interactively and intuitively.
There are three main ways of loading a GeoJSON file in Leaflet. One is by hardcoding the dictionary of spatial attributes in a JavaScript file. This was the first method that we explored.
The other method is by using the Ajax plugin. We call Ajax into Leaflet by inserting into the
<head>element the path to the extracted Ajax files.The third and last method is through use of the
fetchAPI. ThefetchAPI searches for a resource over the web, retrieves it, and brings it to your computer.
Asynchronous programming is a technique that enables your program to start a potentially long-running task and still be able to be responsive to other events while that task runs, rather than having to wait until that task has finished. Once that task has finished, your program is presented with the result. See Mozilla↩︎