Appendix 10: Identifying Outliers for Habitat Assessment Indicator Values
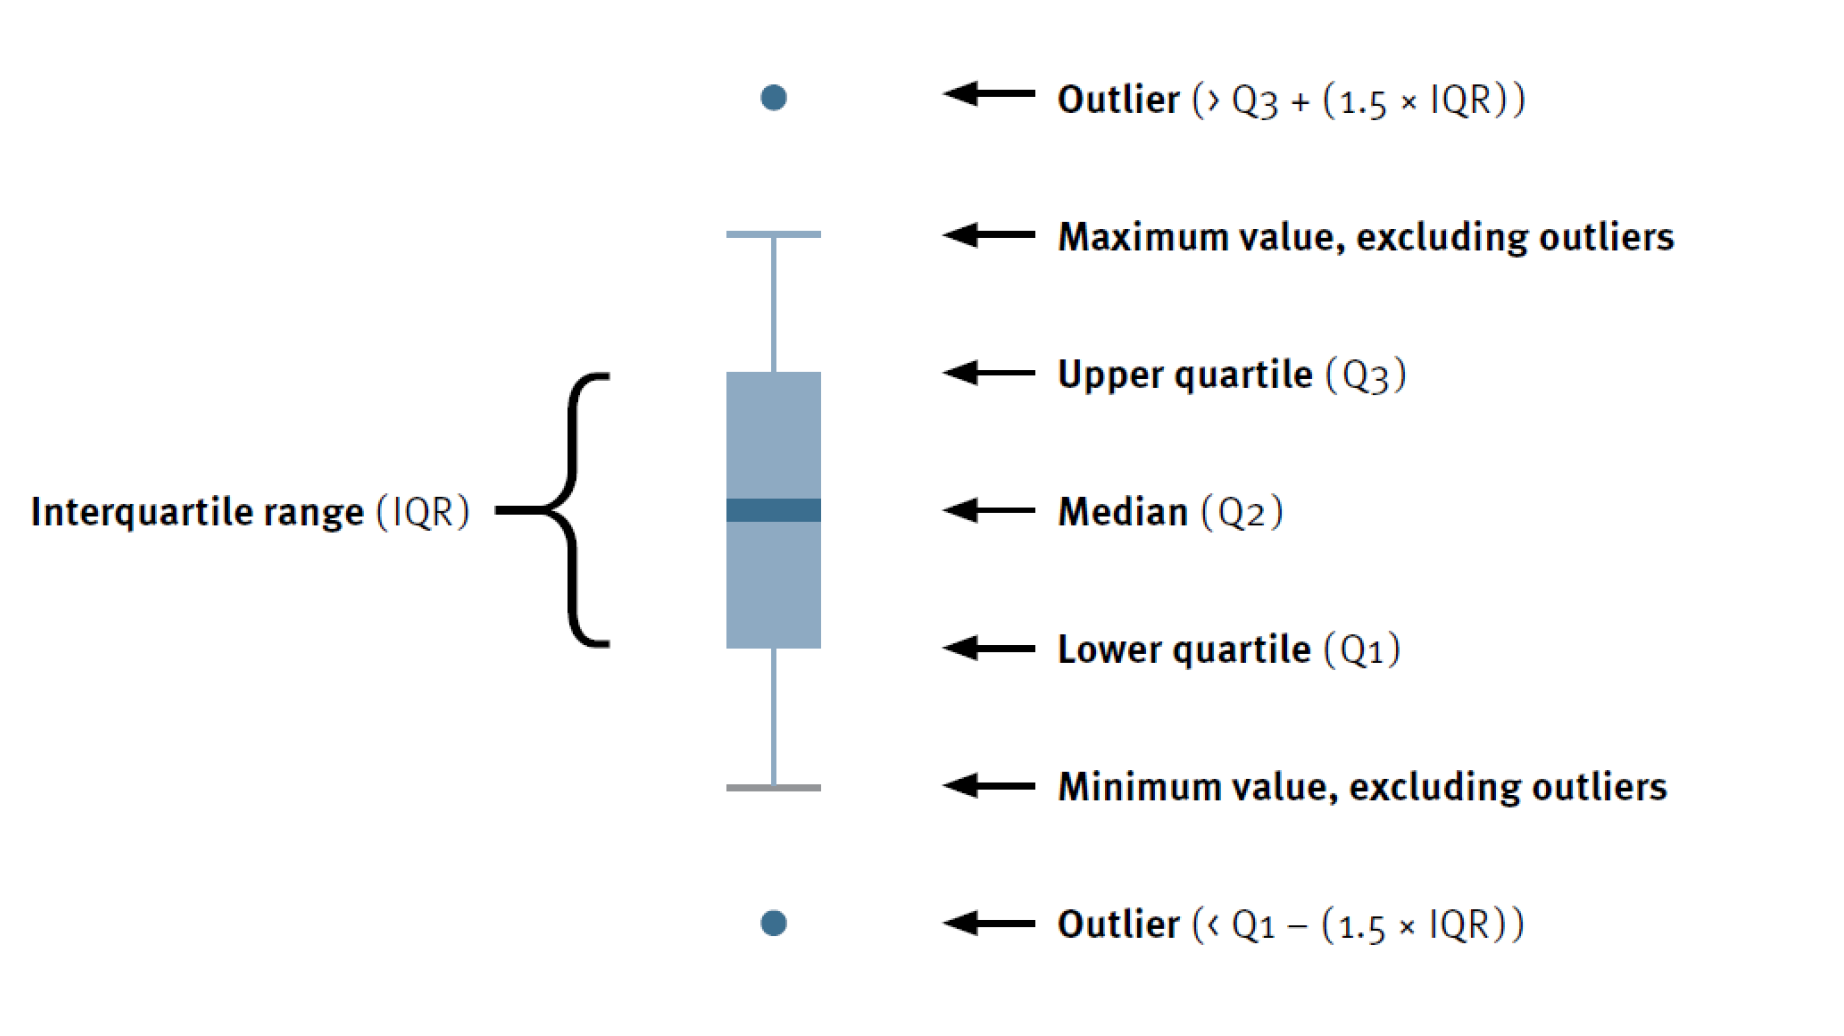 Above: Illustration depicting the key values in a box plot. We use box plots to show the distribution of data and assign a relative risk score to a habitat pressure indicator value.
The plot includes a box indicating the inner 50th percentile of the data, whiskers showing the robust data range, outliers, and median. The top and bottom of the box are the 25th (Q1) and 75th (Q3) percentiles. The size of the box is called the interquartile range (IQR) and is defined as IQR = Q3 − Q1. The whiskers extend to the most extreme data points, which are not considered outliers. The horizontal line inside the box represents the median (50th percentile, Q2). Data that fall outside the IQR box by a specific amount are considered “outliers.” Outliers are values greater than 1.5 \(\times\) IQR outside of the IQR. (Modified from Porter et al. 2016).