4 Nor de puncte (scatterplot)
?flights
head(flights)## # A tibble: 6 × 19
## year month day dep_time sched_dep…¹ dep_d…² arr_t…³ sched…⁴ arr_d…⁵ carrier
## <int> <int> <int> <int> <int> <dbl> <int> <int> <dbl> <chr>
## 1 2013 1 1 517 515 2 830 819 11 UA
## 2 2013 1 1 533 529 4 850 830 20 UA
## 3 2013 1 1 542 540 2 923 850 33 AA
## 4 2013 1 1 544 545 -1 1004 1022 -18 B6
## 5 2013 1 1 554 600 -6 812 837 -25 DL
## 6 2013 1 1 554 558 -4 740 728 12 UA
## # … with 9 more variables: flight <int>, tailnum <chr>, origin <chr>,
## # dest <chr>, air_time <dbl>, distance <dbl>, hour <dbl>, minute <dbl>,
## # time_hour <dttm>, and abbreviated variable names ¹sched_dep_time,
## # ²dep_delay, ³arr_time, ⁴sched_arr_time, ⁵arr_delayselectam zborurile din 2013 operate de Alaska Airlines (AS)
zboruri <- flights[(flights$year==2013) & (flights$carrier =='AS'),]nor de puncte pt
dep_delaysiarr_delay
ggplot(data=zboruri, aes(x=dep_delay, y=arr_delay))+
  geom_point()
## Warning: Removed 5 rows containing missing values (`geom_point()`).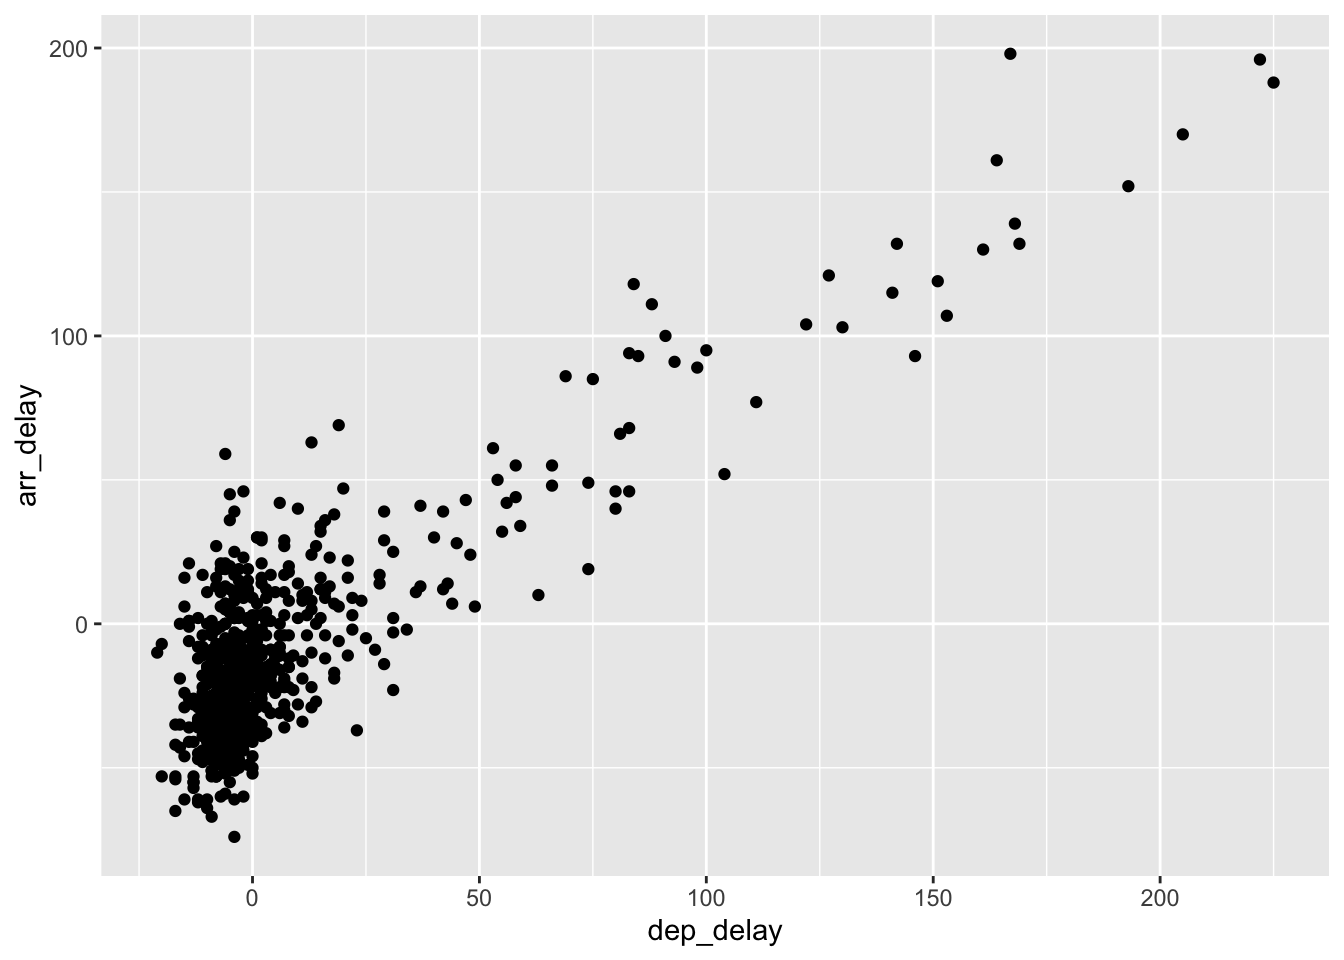
- colorăm toate punctele cu aceeași culoare
- schimbăm transparența cu
alpha- o valoare între 0 și 1.
ggplot(data=zboruri, aes(x=dep_delay, y=arr_delay))+
  geom_point(alpha = 1/5, color='blue')
## Warning: Removed 5 rows containing missing values (`geom_point()`).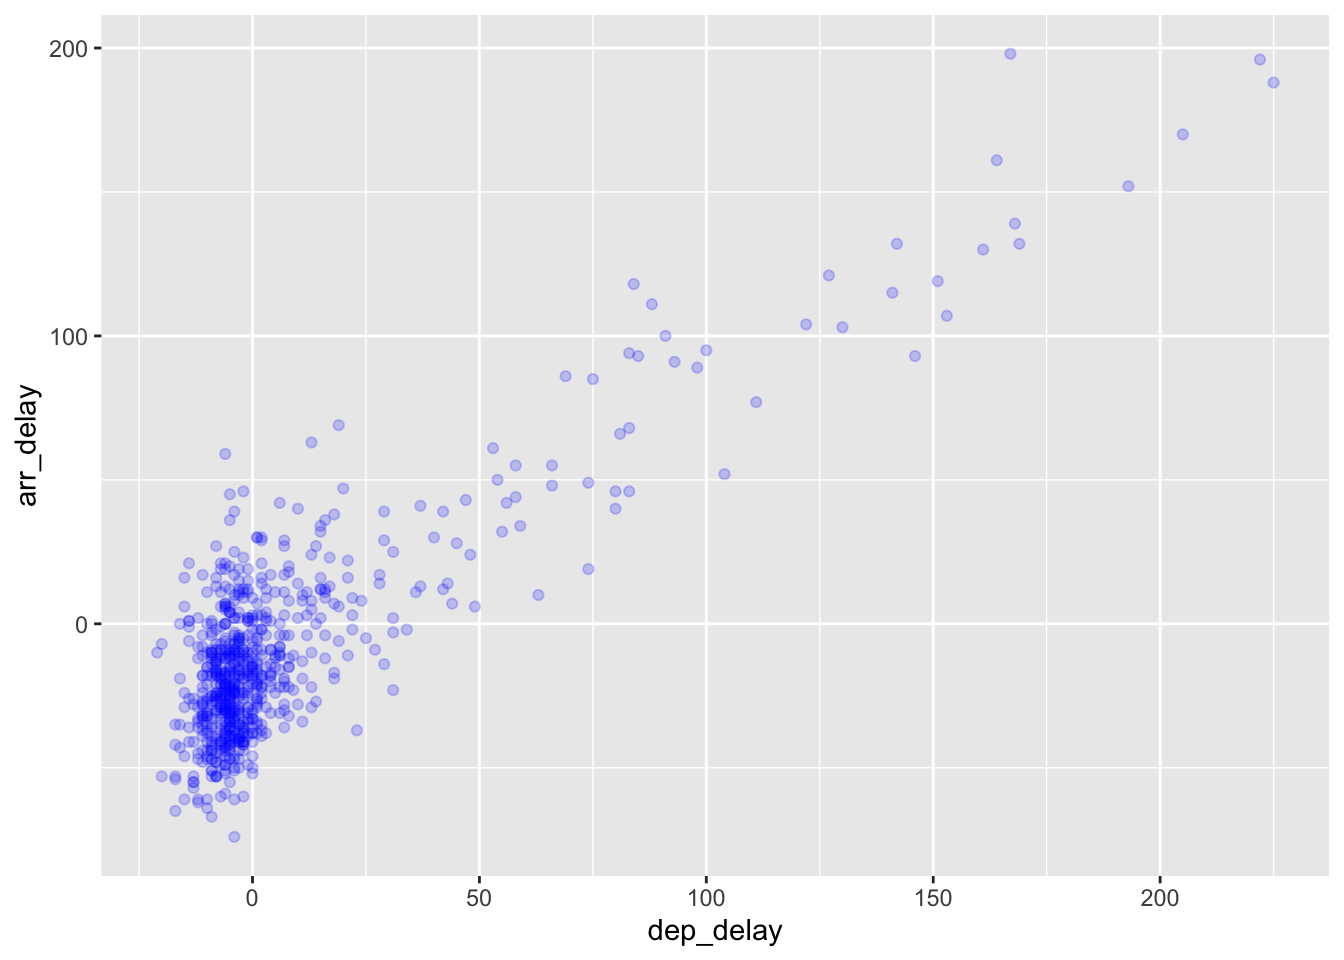
jitter: “zgâlțâim” punctele
ggplot(data=zboruri, aes(x=dep_delay, y=arr_delay))+
  geom_jitter()
## Warning: Removed 5 rows containing missing values (`geom_point()`).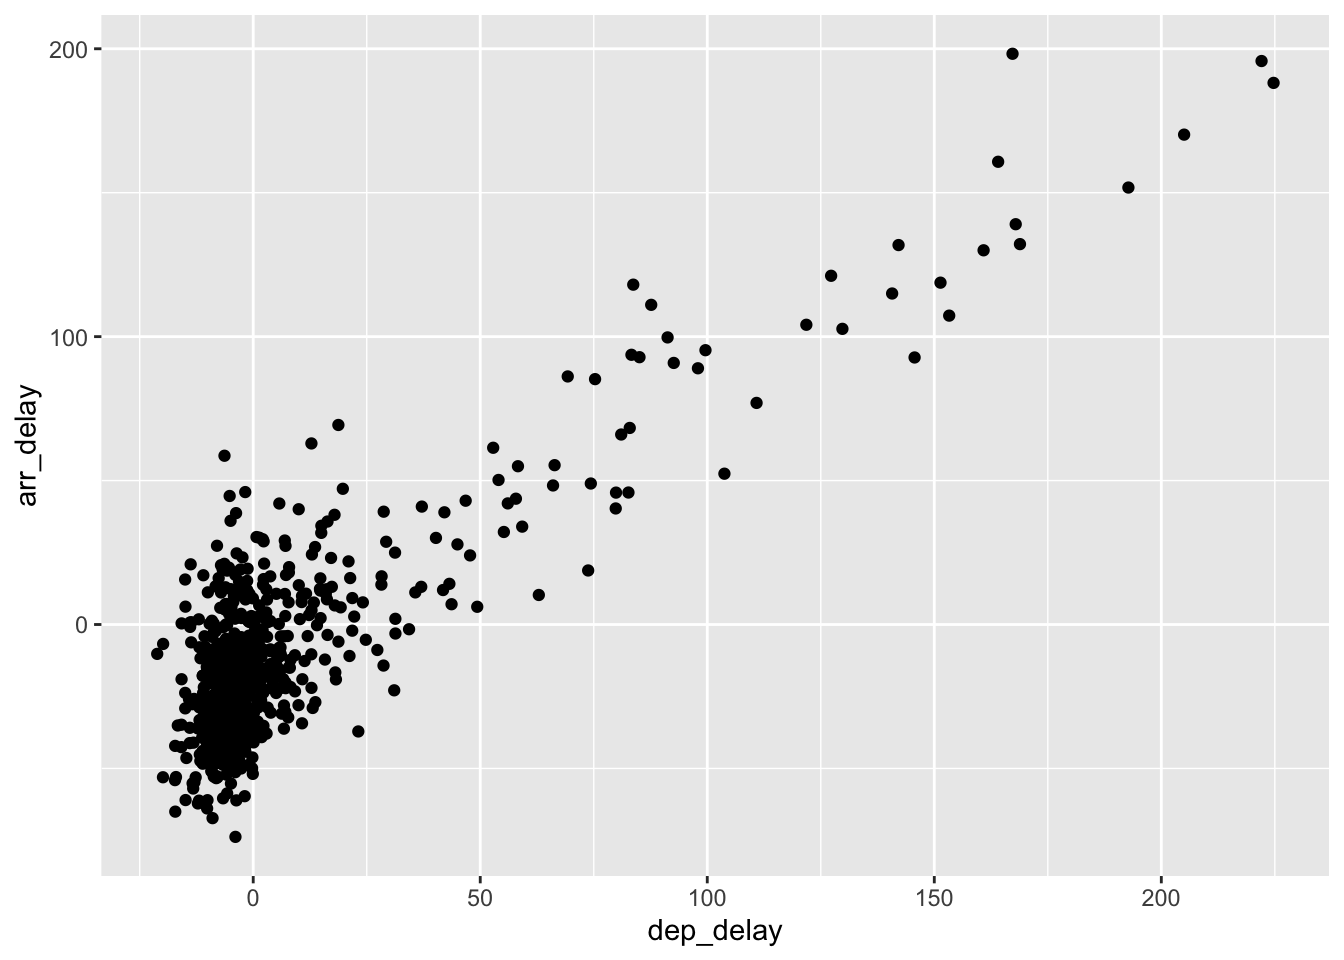
ggplot(data=zboruri, aes(x=dep_delay, y=arr_delay))+
  geom_jitter(width=30, height=30)
## Warning: Removed 5 rows containing missing values (`geom_point()`).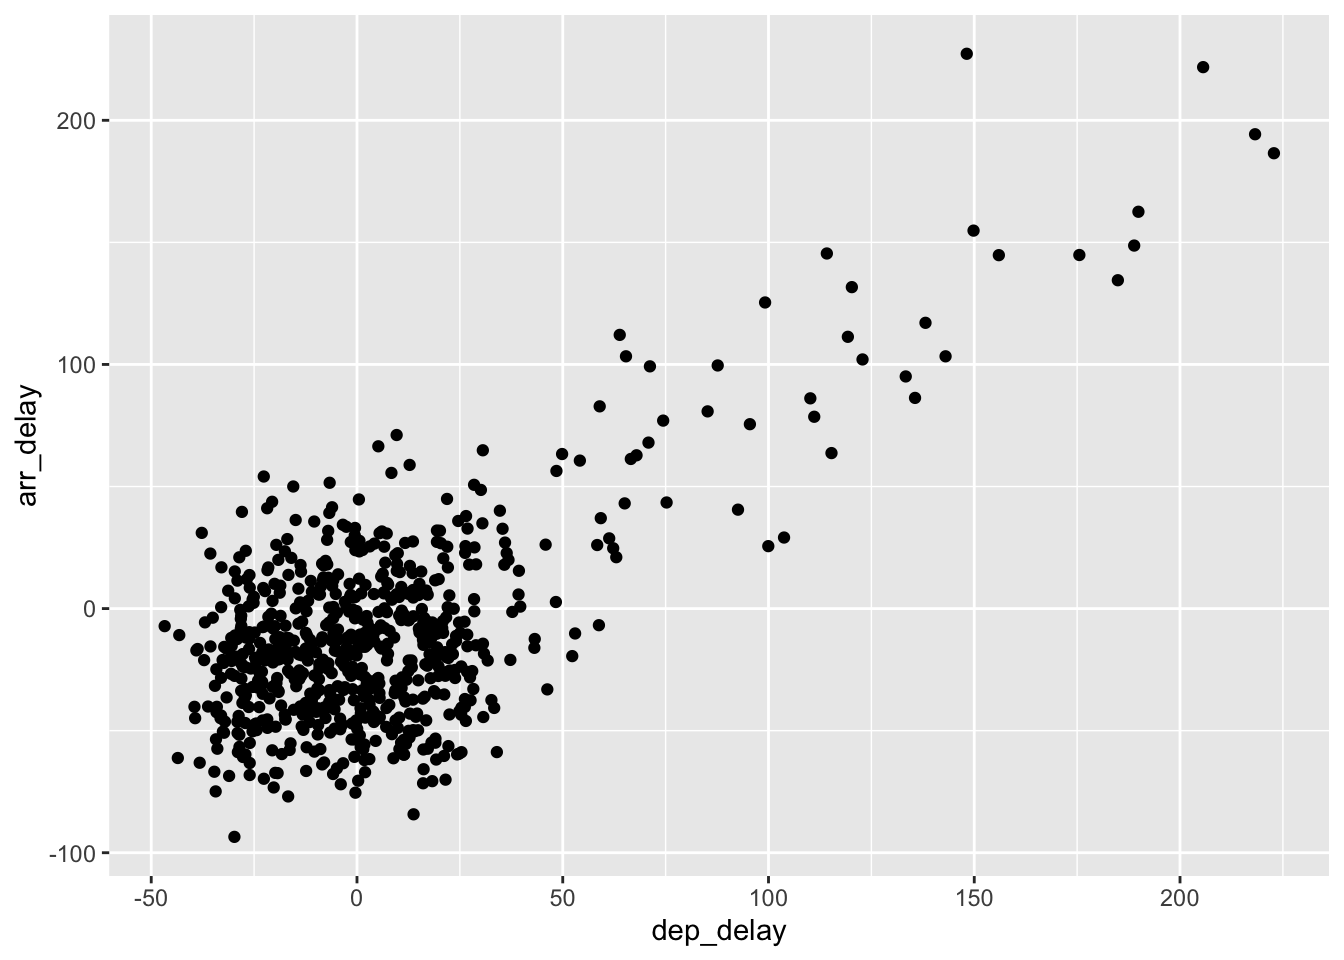
4.1 Lucrul cu culori
Lista de culori R se găsește online: Rcolors
grafic1 <- ggplot(data=gapminder_2007_fara_an, aes(x=gdpPercap, y=lifeExp, size=Populatia))+
  geom_point( aes(color=continent))
grafic1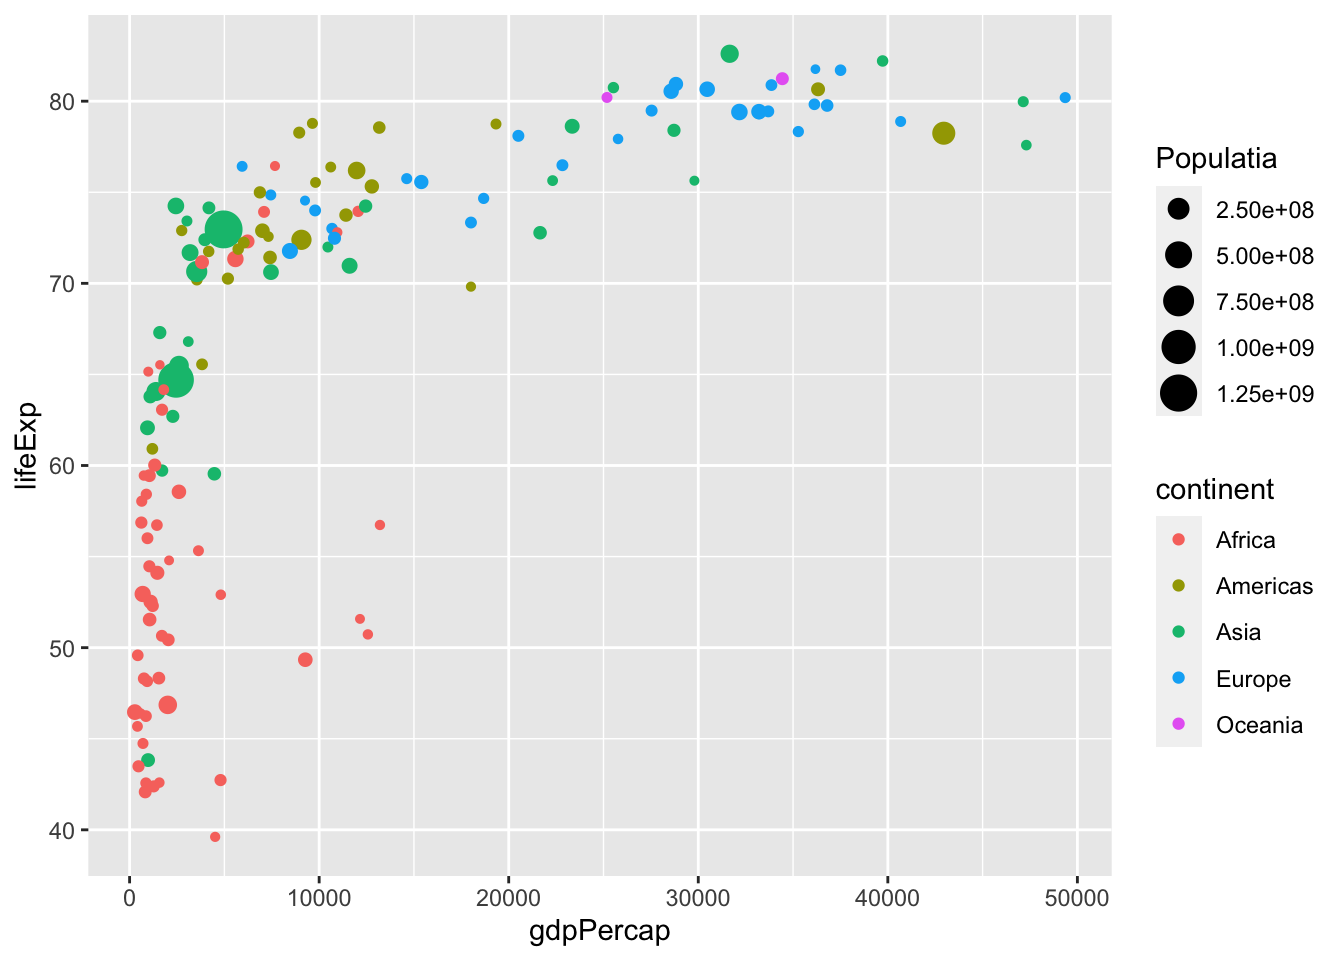
grafic1 <- ggplot(data=gapminder_2007_fara_an, aes(x=gdpPercap, y=lifeExp, size=Populatia))+
  geom_point( color=I('#dcb556'))
grafic1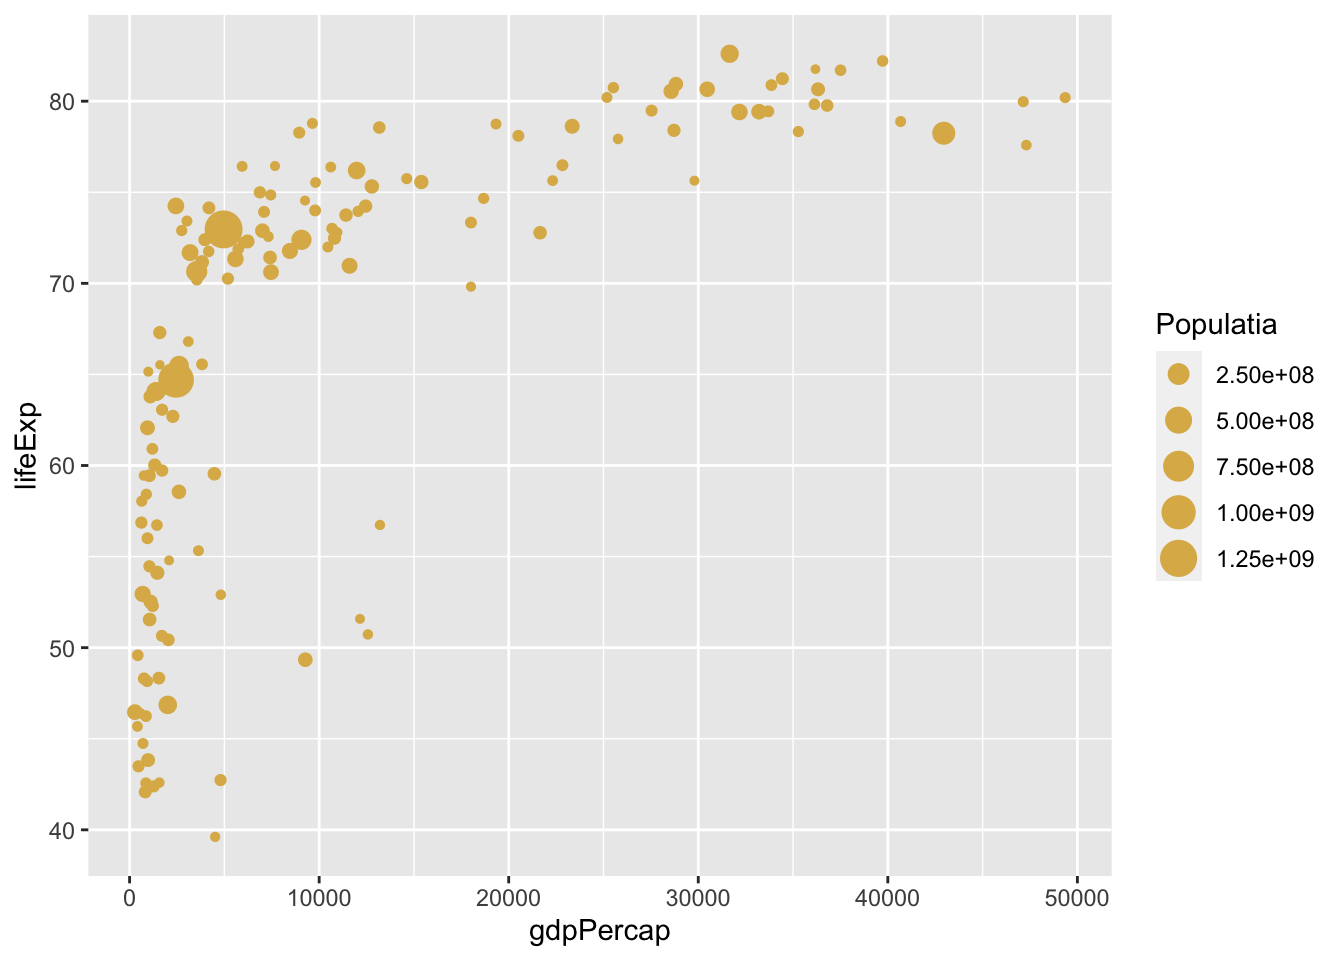
grafic1 <- ggplot(data=gapminder_2007_fara_an, aes(x=gdpPercap, y=lifeExp, size=Populatia))+
  geom_point( aes(color=continent))
grafic1