5 Time Series Analysis in R
First, let’s plot the data
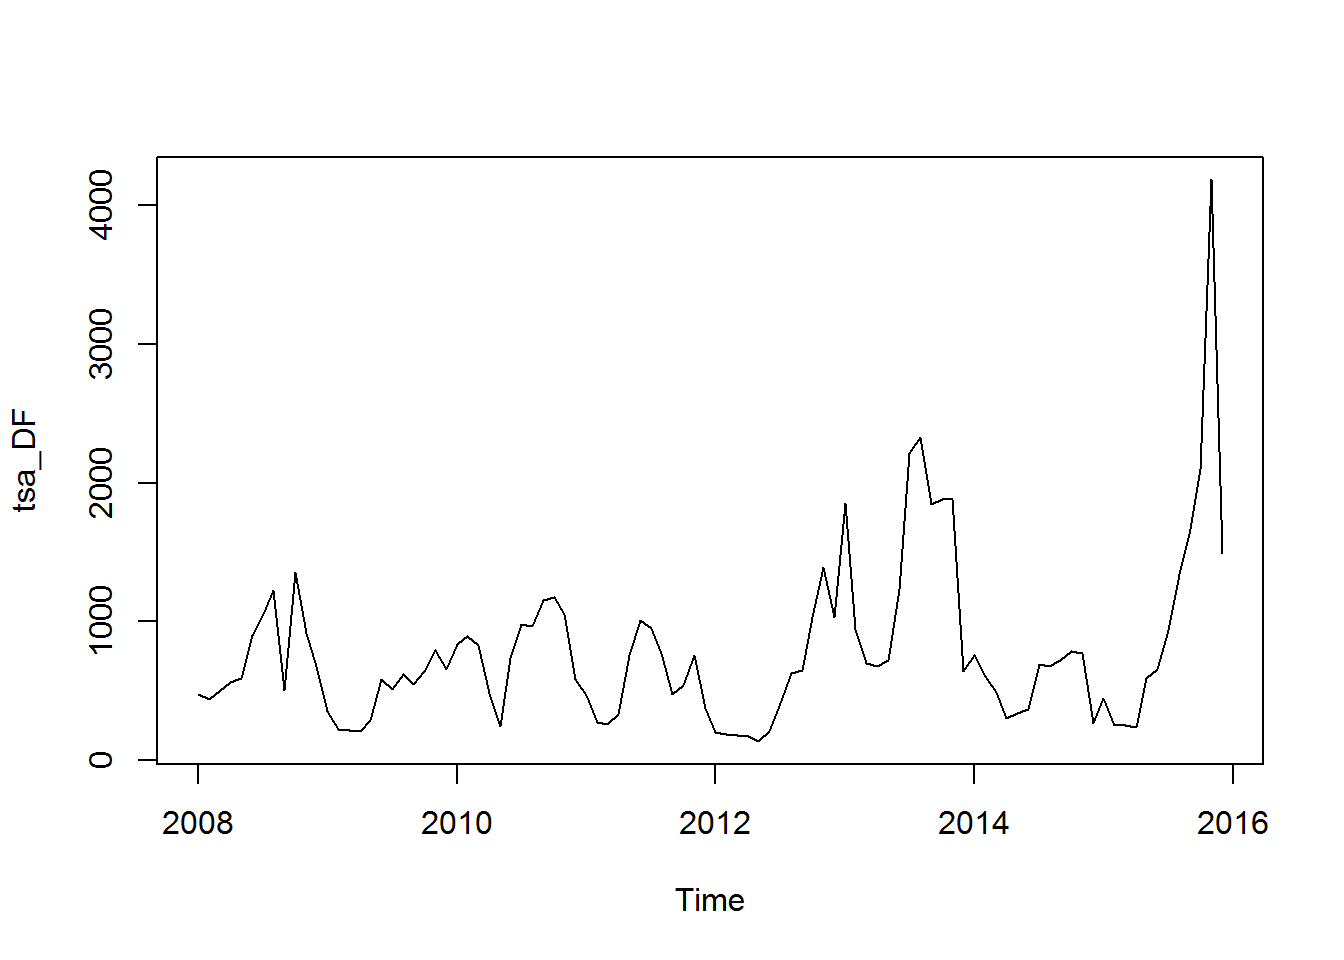
We can see from this time series that there seems to be seasonal variation in the number of dengue incidences per month: there is a peak every winter, and a trough every summer. Again, it seems that this time series could probably be described using an additive model, as the seasonal fluctuations are roughly constant in size over time and do not seem to depend on the level of the time series, and the random fluctuations also seem to be roughly constant in size over time.
Thus, we don’t need to tranform the time series by calculating the natural log of the original data.
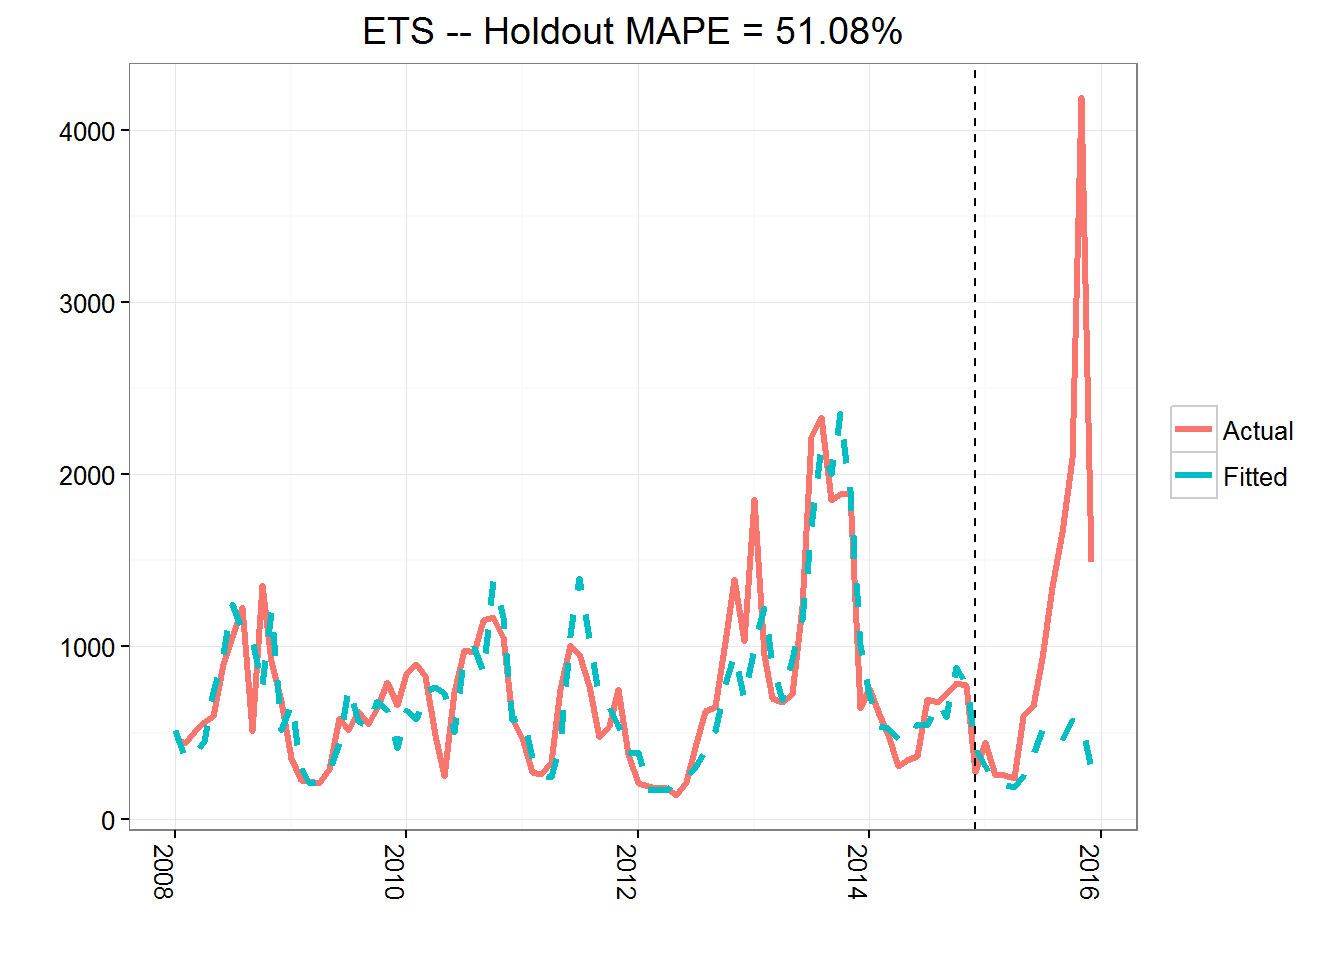
5.1 Exponential Smoothing
5.2 Seasonal ARIMA Model
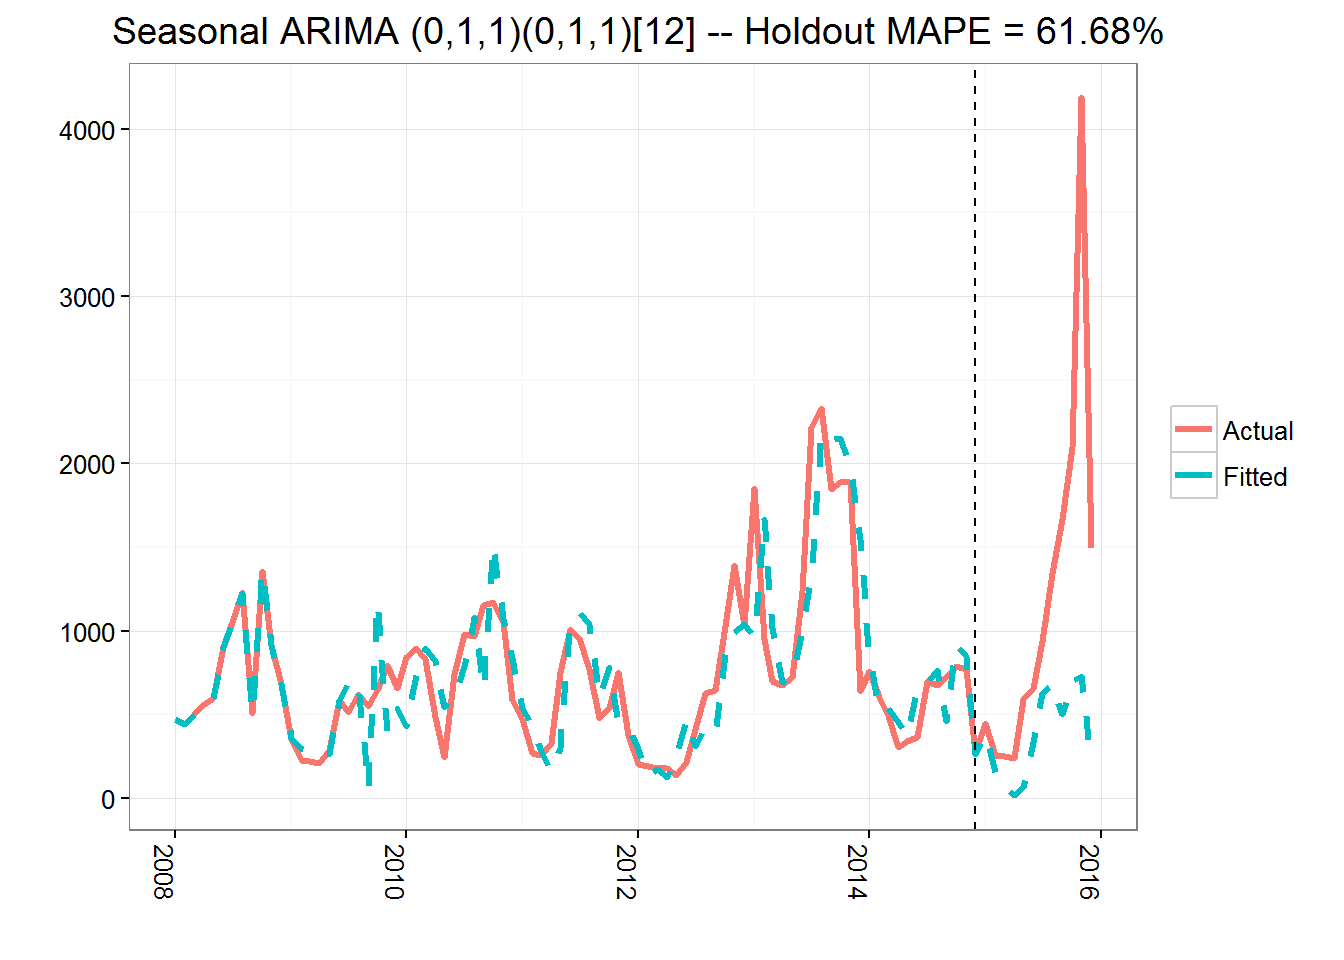
When a model is fit by manual setting of parameters.
I fit an ARIMA(0,1,1)(0,1,1)[12] model.
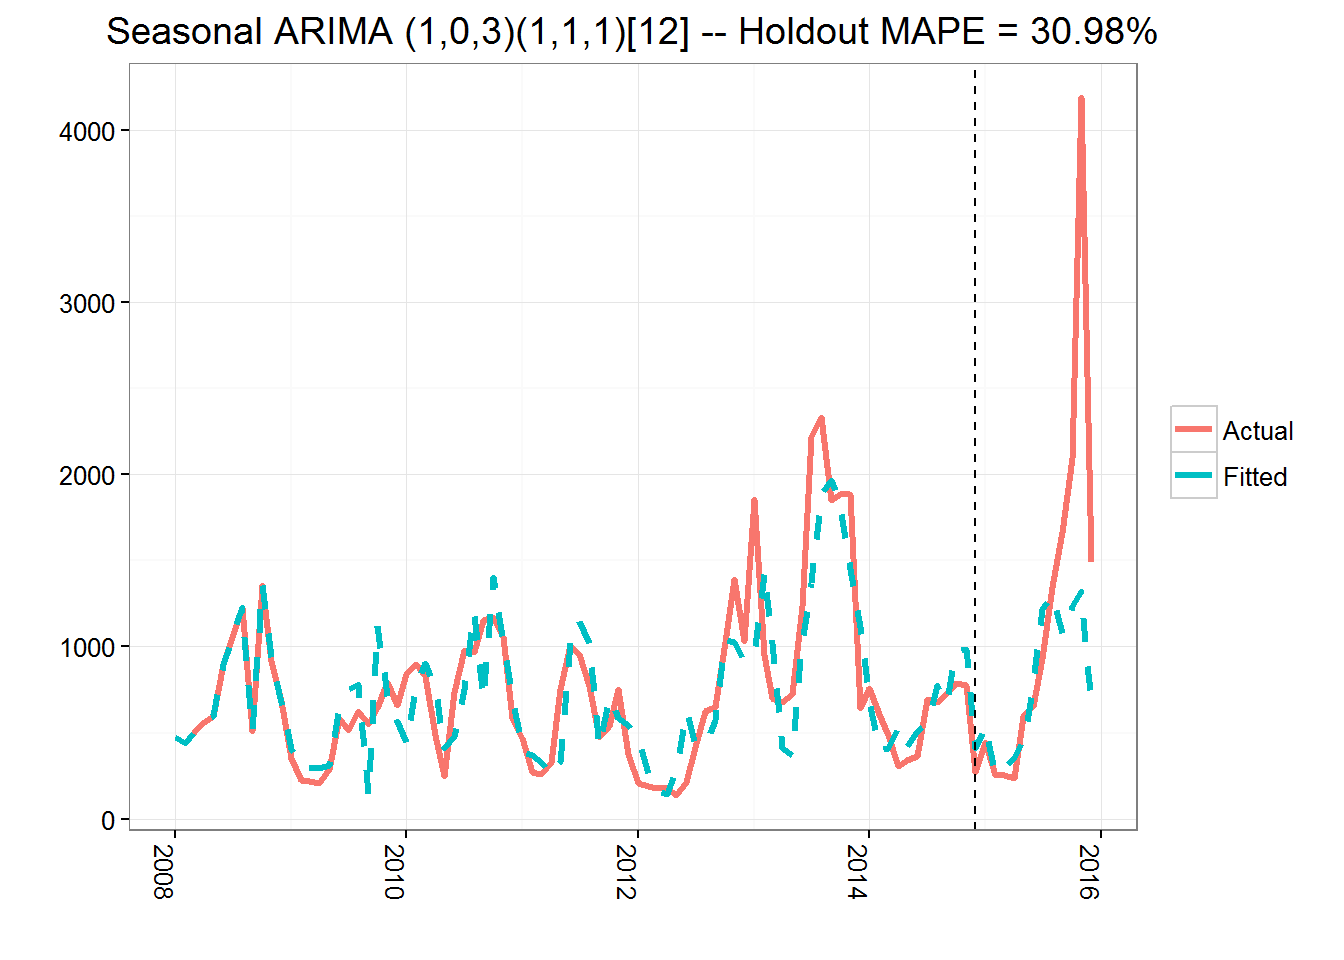
I fit an ARIMA(1,0,3)(1,1,1)[12] model.
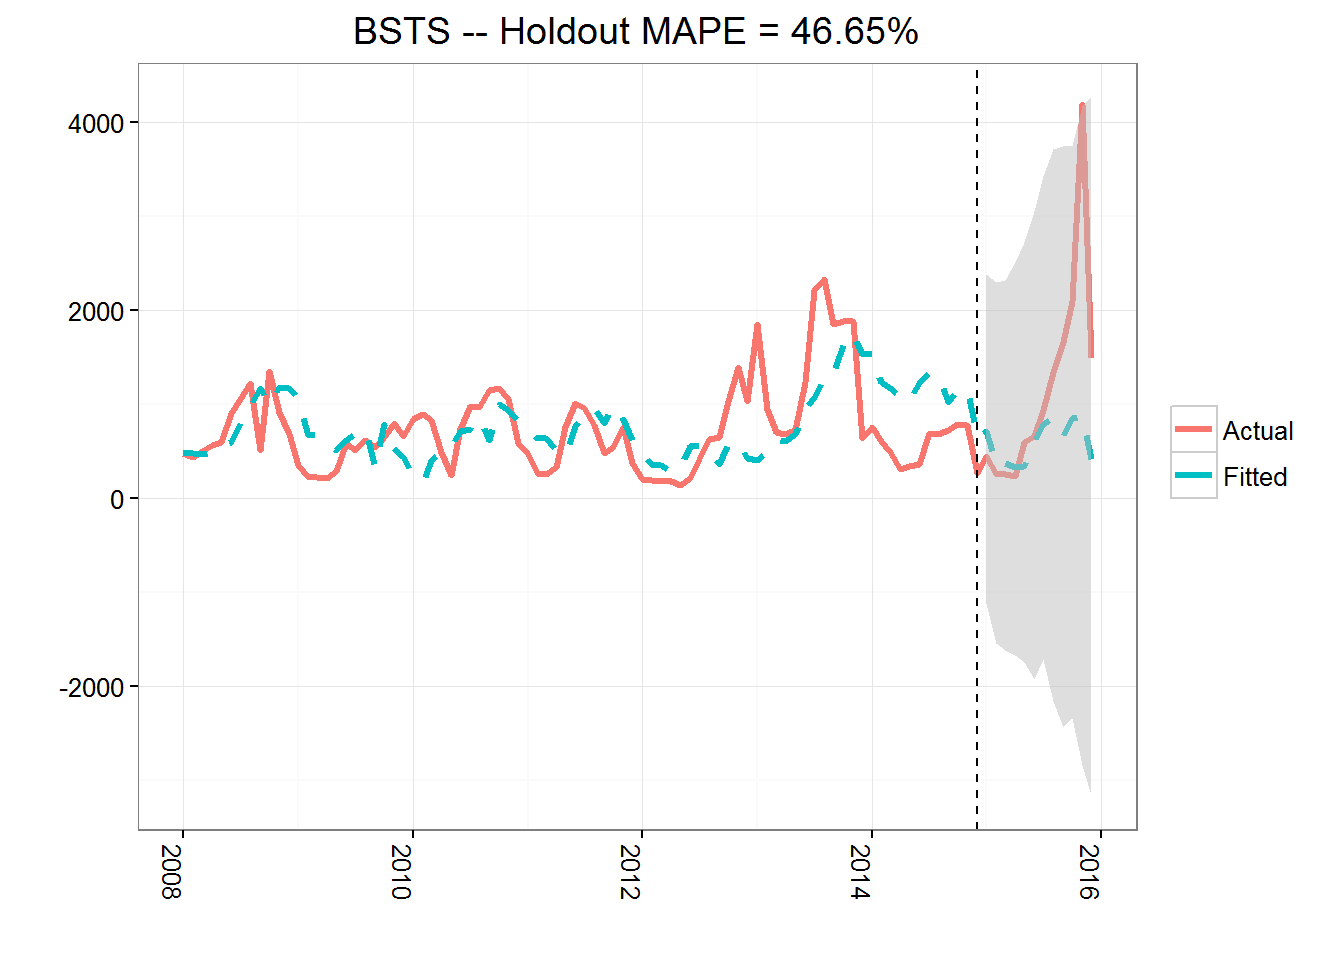
5.3 A Bayesian Structural Time Series Model

5.4 A Structured Bayesian Network Approach

                ME    RMSE      MAE       MPE     MAPE
Test set -1.063421 10.0441 6.664085 -60.43833 79.39199
accuracy(f = pred, x = bayesianDF.test[, "count"]) ME RMSE MAE MPE MAPE
Test set 8.765601 27.51189 16.08321 -87.3934 135.71635.5 Generalized Additive Model
Now, I analyse the dataset according using the Generalized Additive Model.
The dataset consists of following entries:
- Information of each district
- identification codes
- name of the district.
- population (divided into various age bins)
- area in square kms.
- Number of communities
- number of neighboring districts
- Monthly DHF count in each district from 2008~2015
- Monthly average rainfall in Bangkok from 2008~2015
- Monthly Diurnal Temperature Range (DTR) in Bangkok from 2008~2015
The map of Bangkok is shown below.

There are 18 districts that are close to stream as shown in the above map. Their names are:
 [1] "Bang Su"         "Dusit"           "Bang Plad"
 [4] "Phra Nakhon"     "Bangkok Noi"     "Bangkok Yai"
 [7] "Thon Buri"       "Khlong San"      "Pom Pram Sattru"
[10] "Samphantawong"   "Bang Rak"        "Sathorn"
[13] "Bang Kho Laem"   "Yannawa"         "Rat Burana"
[16] "Khlong Toey"     "Prakanong"       "Bang Na"
5.6 Study Area 1
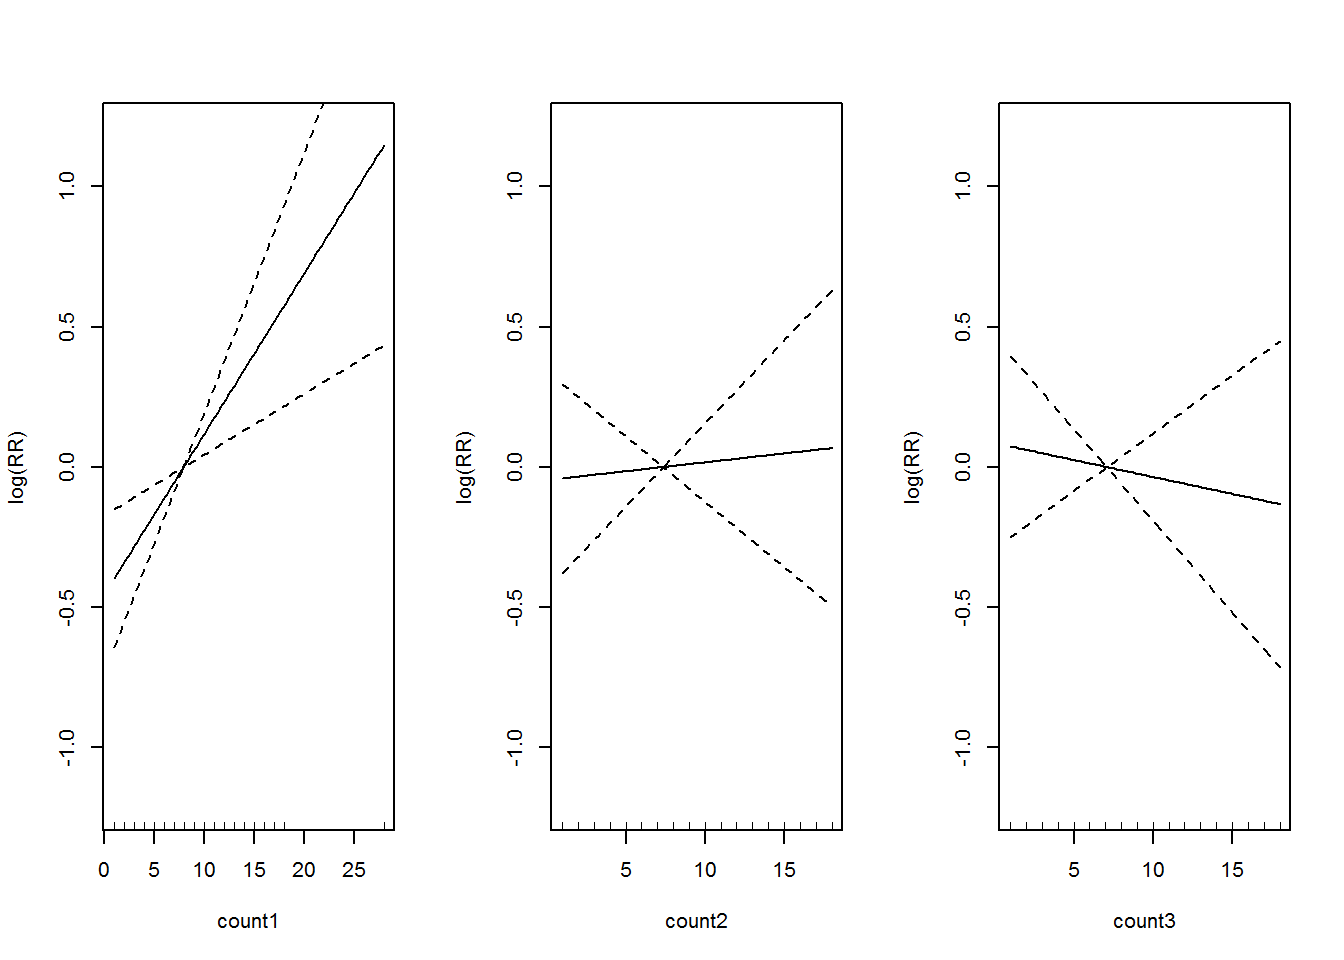
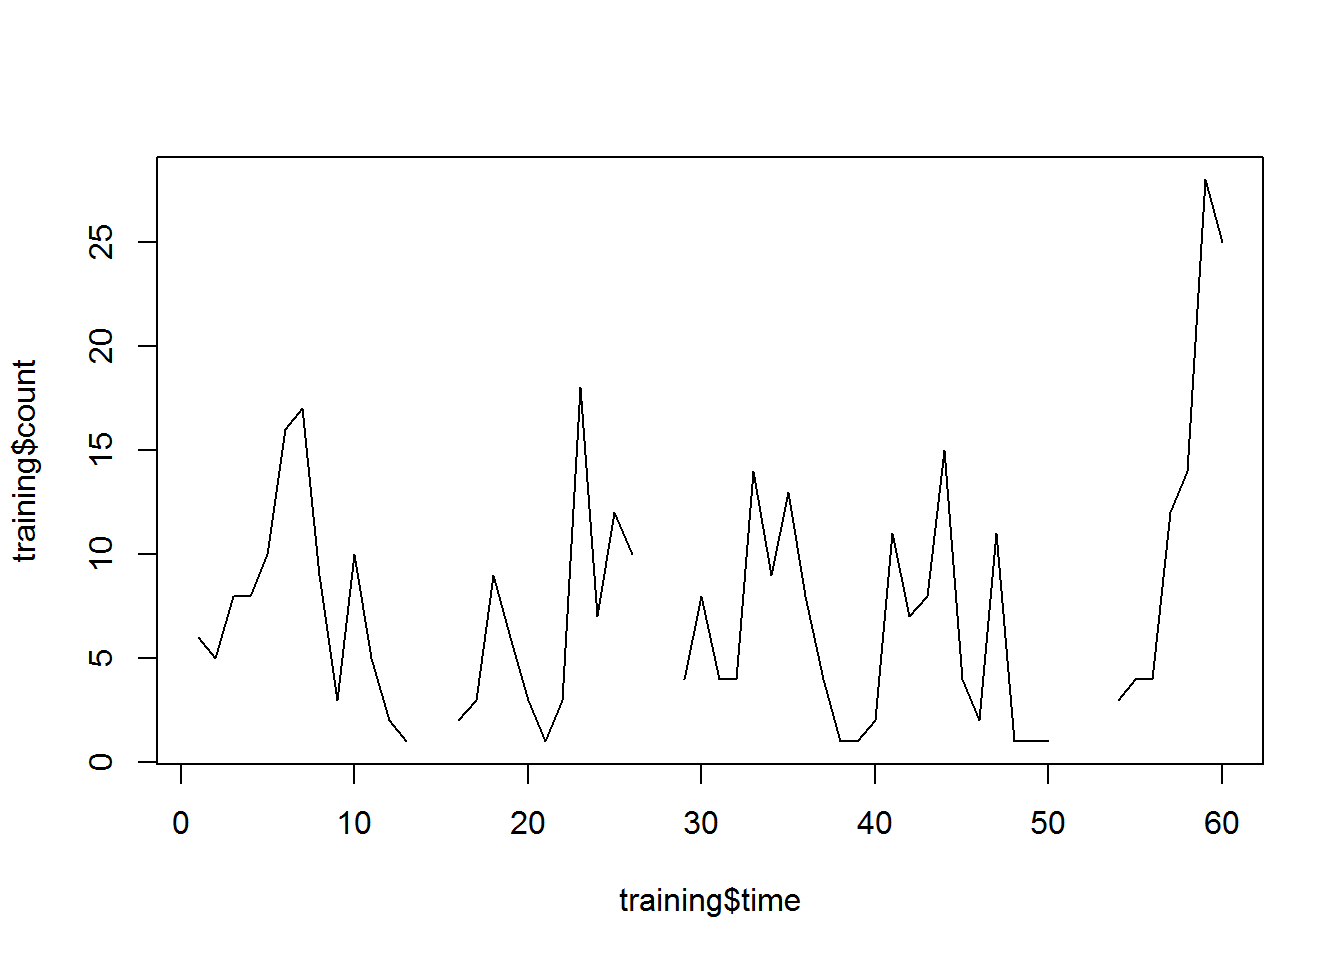
For the ease of experimentation, I use the data from first district (indexed as 1 in the image of Bangkok) and perform the our analyses. The name of the district is Phra Nakhon. As you can see, it is located near the stream.






5.7 Prediction using the entire data with GAM
5.8 Notes to myself:
- I need to create the lagged values for each district.
- Separate the data into training and testing datasets. Keep the year variable flexible, so that I can experiment with year variables
- Row bind all the training datasets i.e. the data from 50 BKK districts
- Row bind all the data from the testing datasets similar to above.
- make tests.