Chapter2 Problem 2
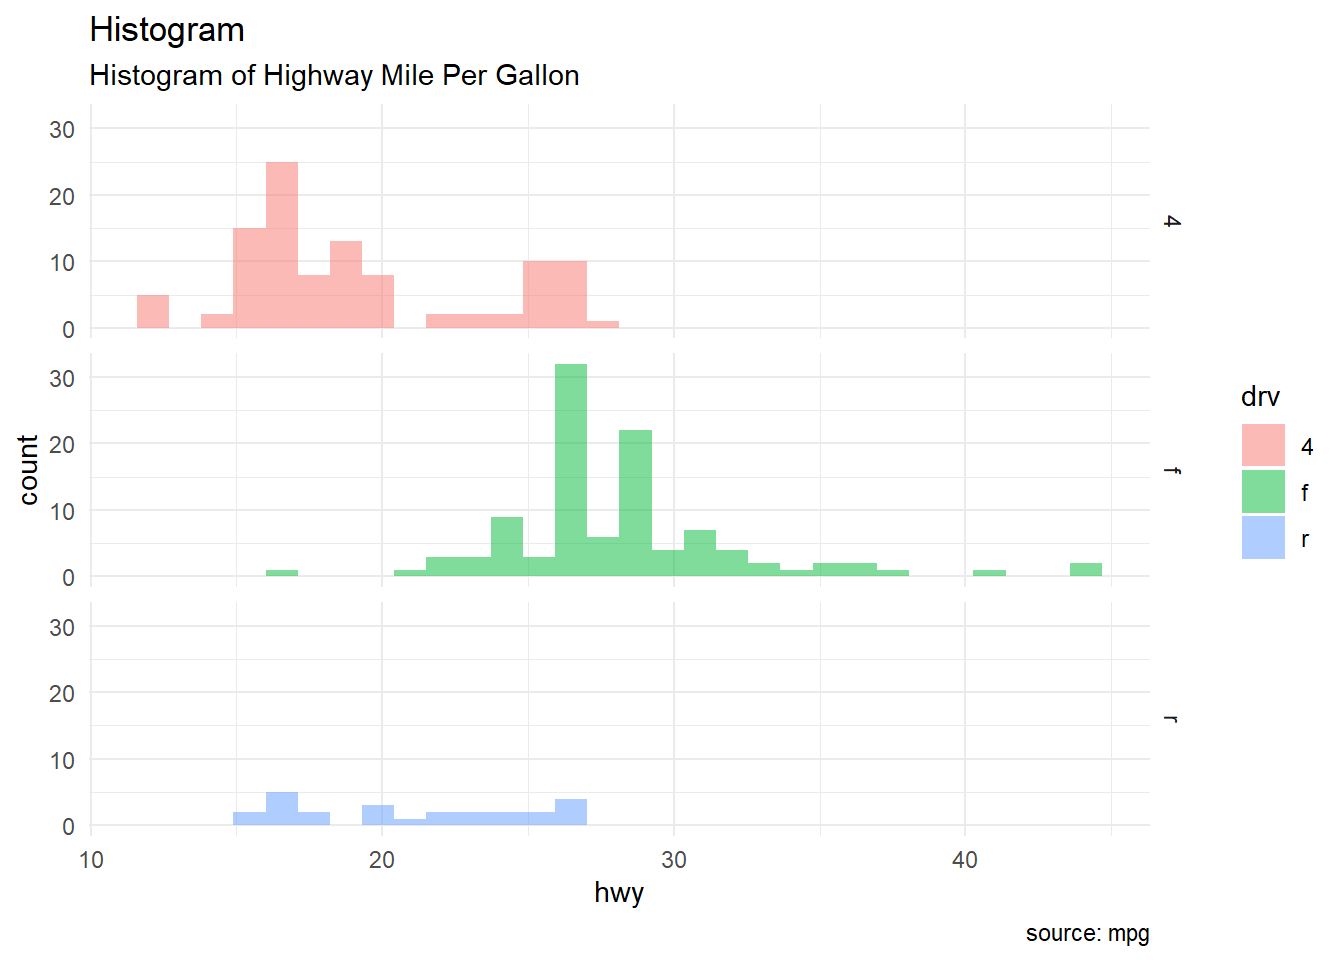
Using the mpg dataset in the ggplot2 package, replicate the plot below using the following settings:
- Set alpha = 0.5 for the width of bars
- Use facet_grid()
- Use theme_minimal()
Answer
library(ggplot2)

ggplot(data = mpg, aes(x = hwy, fill = drv)) +
  geom_histogram(alpha=0.5) +
  labs(title = "Histogram",
       subtitle = "Histogram of Highway Mile Per Gallon",
       caption = "source: mpg"
  ) +
  facet_grid(rows = vars(drv)) +
  theme_minimal()
## `stat_bin()` using `bins = 30`. Pick better value with `binwidth`.