Chapter 2 Basis Summary
2.1 Demographic
| Variable | Stats / Values | Freqs (% of Valid) | Graph | Missing | ||||||||||||||||||||||||||||||||||||||||
|---|---|---|---|---|---|---|---|---|---|---|---|---|---|---|---|---|---|---|---|---|---|---|---|---|---|---|---|---|---|---|---|---|---|---|---|---|---|---|---|---|---|---|---|---|
| age [factor] | 1. 18-24 2. 25-34 3. 35-44 4. 45-54 5. 55+ |
|
 |
0 (0%) | ||||||||||||||||||||||||||||||||||||||||
| gender [ordered, factor] | 1. Male 2. Female 3. Prefer to self-describe 4. Prefer not to say |
|
 |
0 (0%) | ||||||||||||||||||||||||||||||||||||||||
| is_hispanic [factor] | 1. No 2. Yes |
|
 |
0 (0%) | ||||||||||||||||||||||||||||||||||||||||
| race [character] | 1. African American or Black 2. Asian 3. Mixed 4. Other 5. White |
|
 |
0 (0%) | ||||||||||||||||||||||||||||||||||||||||
| edu [ordered, factor] | 1. High School Graduate or L 2. Associate Degree 3. Bachelor Degree 4. Graduate Degree |
|
 |
0 (0%) | ||||||||||||||||||||||||||||||||||||||||
| income [ordered, factor] | 1. Less than $23,606 2. $23,607 - $31,894 3. $31,895 - $40,182 4. $40,183 - $48,470 5. $48,471 - $56,758 6. $56,579 - $65,046 7. $65,047 - $73,334 8. $73,335 - $81,622 9. $81,623 - $89,999 10. $90,000 - $99,999 |
|
 |
0 (0%) | ||||||||||||||||||||||||||||||||||||||||
| saving [factor] | 1. $1,001 - $5,000 2. $100 - $500 3. $501 - $1,000 4. Less than $100 5. More than $5,000 6. Prefer not to answer |
|
 |
0 (0%) | ||||||||||||||||||||||||||||||||||||||||
| insurance [factor] | 1. I don't know 2. No 3. Yes |
|
 |
0 (0%) | ||||||||||||||||||||||||||||||||||||||||
| num_adults [numeric] | Mean (sd) : 2.6 (2.6) min < med < max: 0 < 2 < 40 IQR (CV) : 1 (1) | 12 distinct values |  |
0 (0%) | ||||||||||||||||||||||||||||||||||||||||
| num_children [factor] | 1. 0 2. 1 3. 2 4. 3 5. 4 6. 5 7. 9 8. O |
|
 |
1 (0.17%) | ||||||||||||||||||||||||||||||||||||||||
| children_under_6 [factor] | 1. No 2. Yes |
|
 |
0 (0%) | ||||||||||||||||||||||||||||||||||||||||
| elder_above_65 [factor] | 1. No 2. Yes |
|
 |
0 (0%) | ||||||||||||||||||||||||||||||||||||||||
| has_med_condition [factor] | 1. No 2. Prefer not to answer 3. Yes |
|
 |
0 (0%) | ||||||||||||||||||||||||||||||||||||||||
| political_view [factor] | 1. Democrat 2. Independent 3. No preference 4. Other, please describe 5. Republican |
|
 |
0 (0%) | ||||||||||||||||||||||||||||||||||||||||
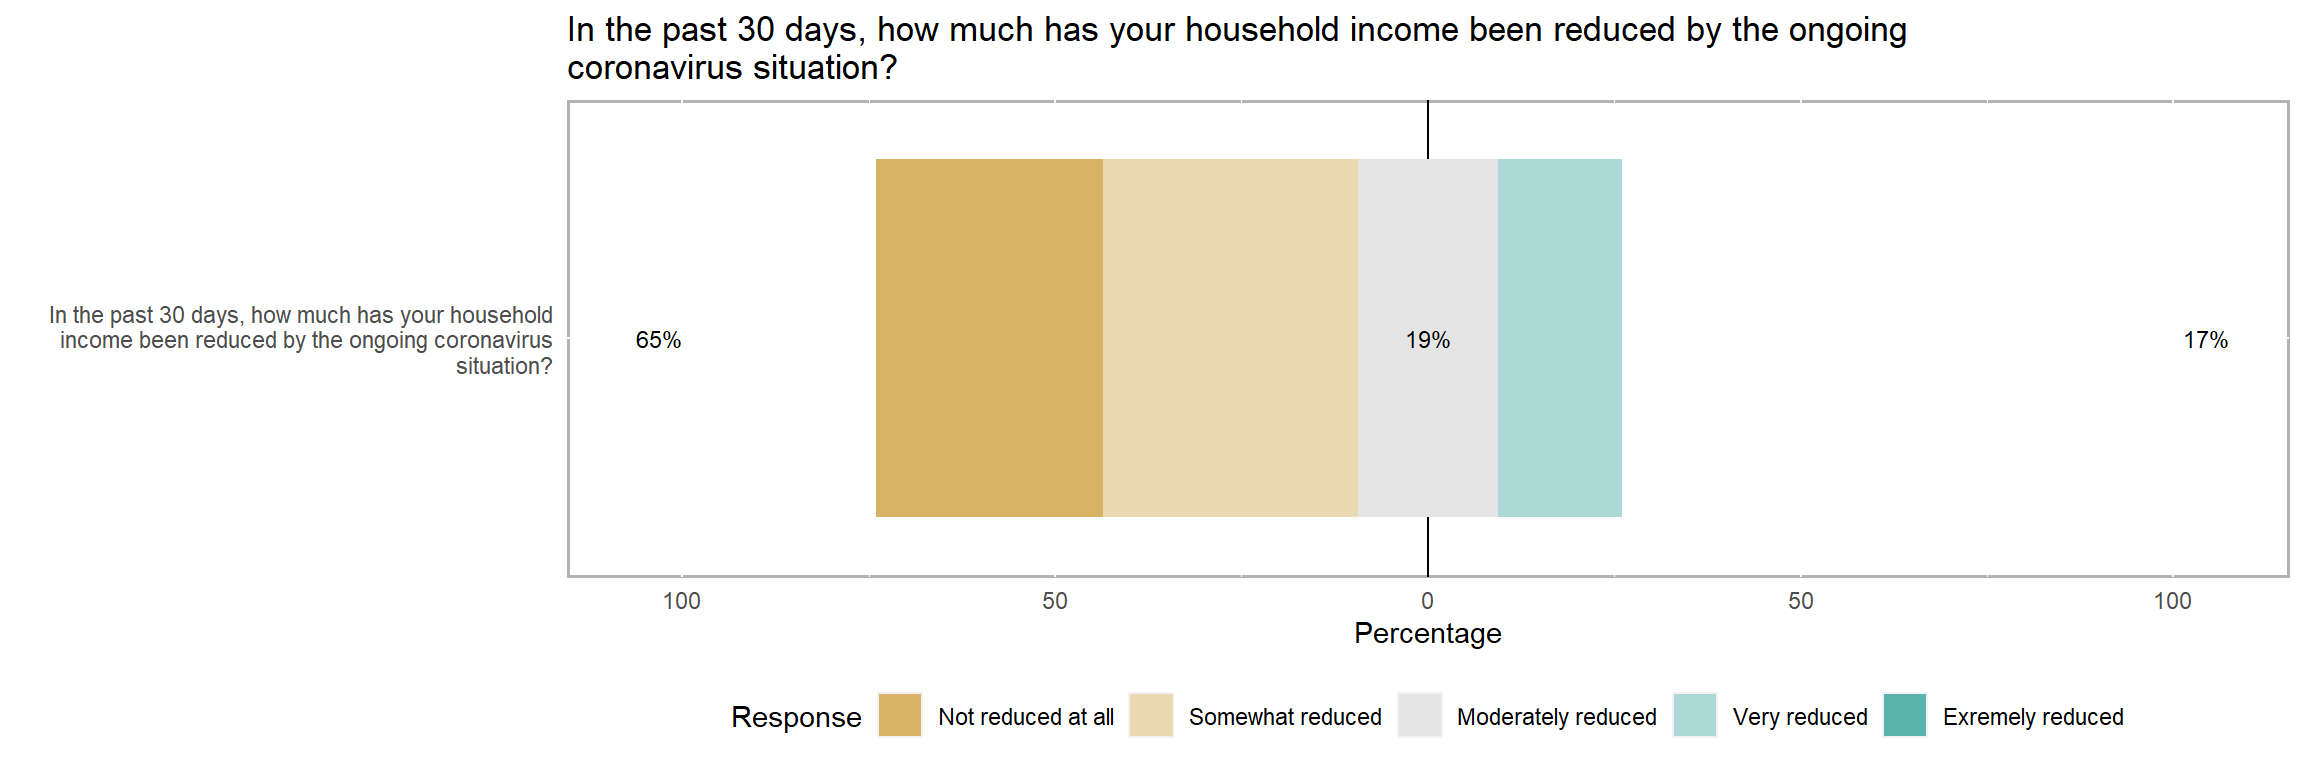
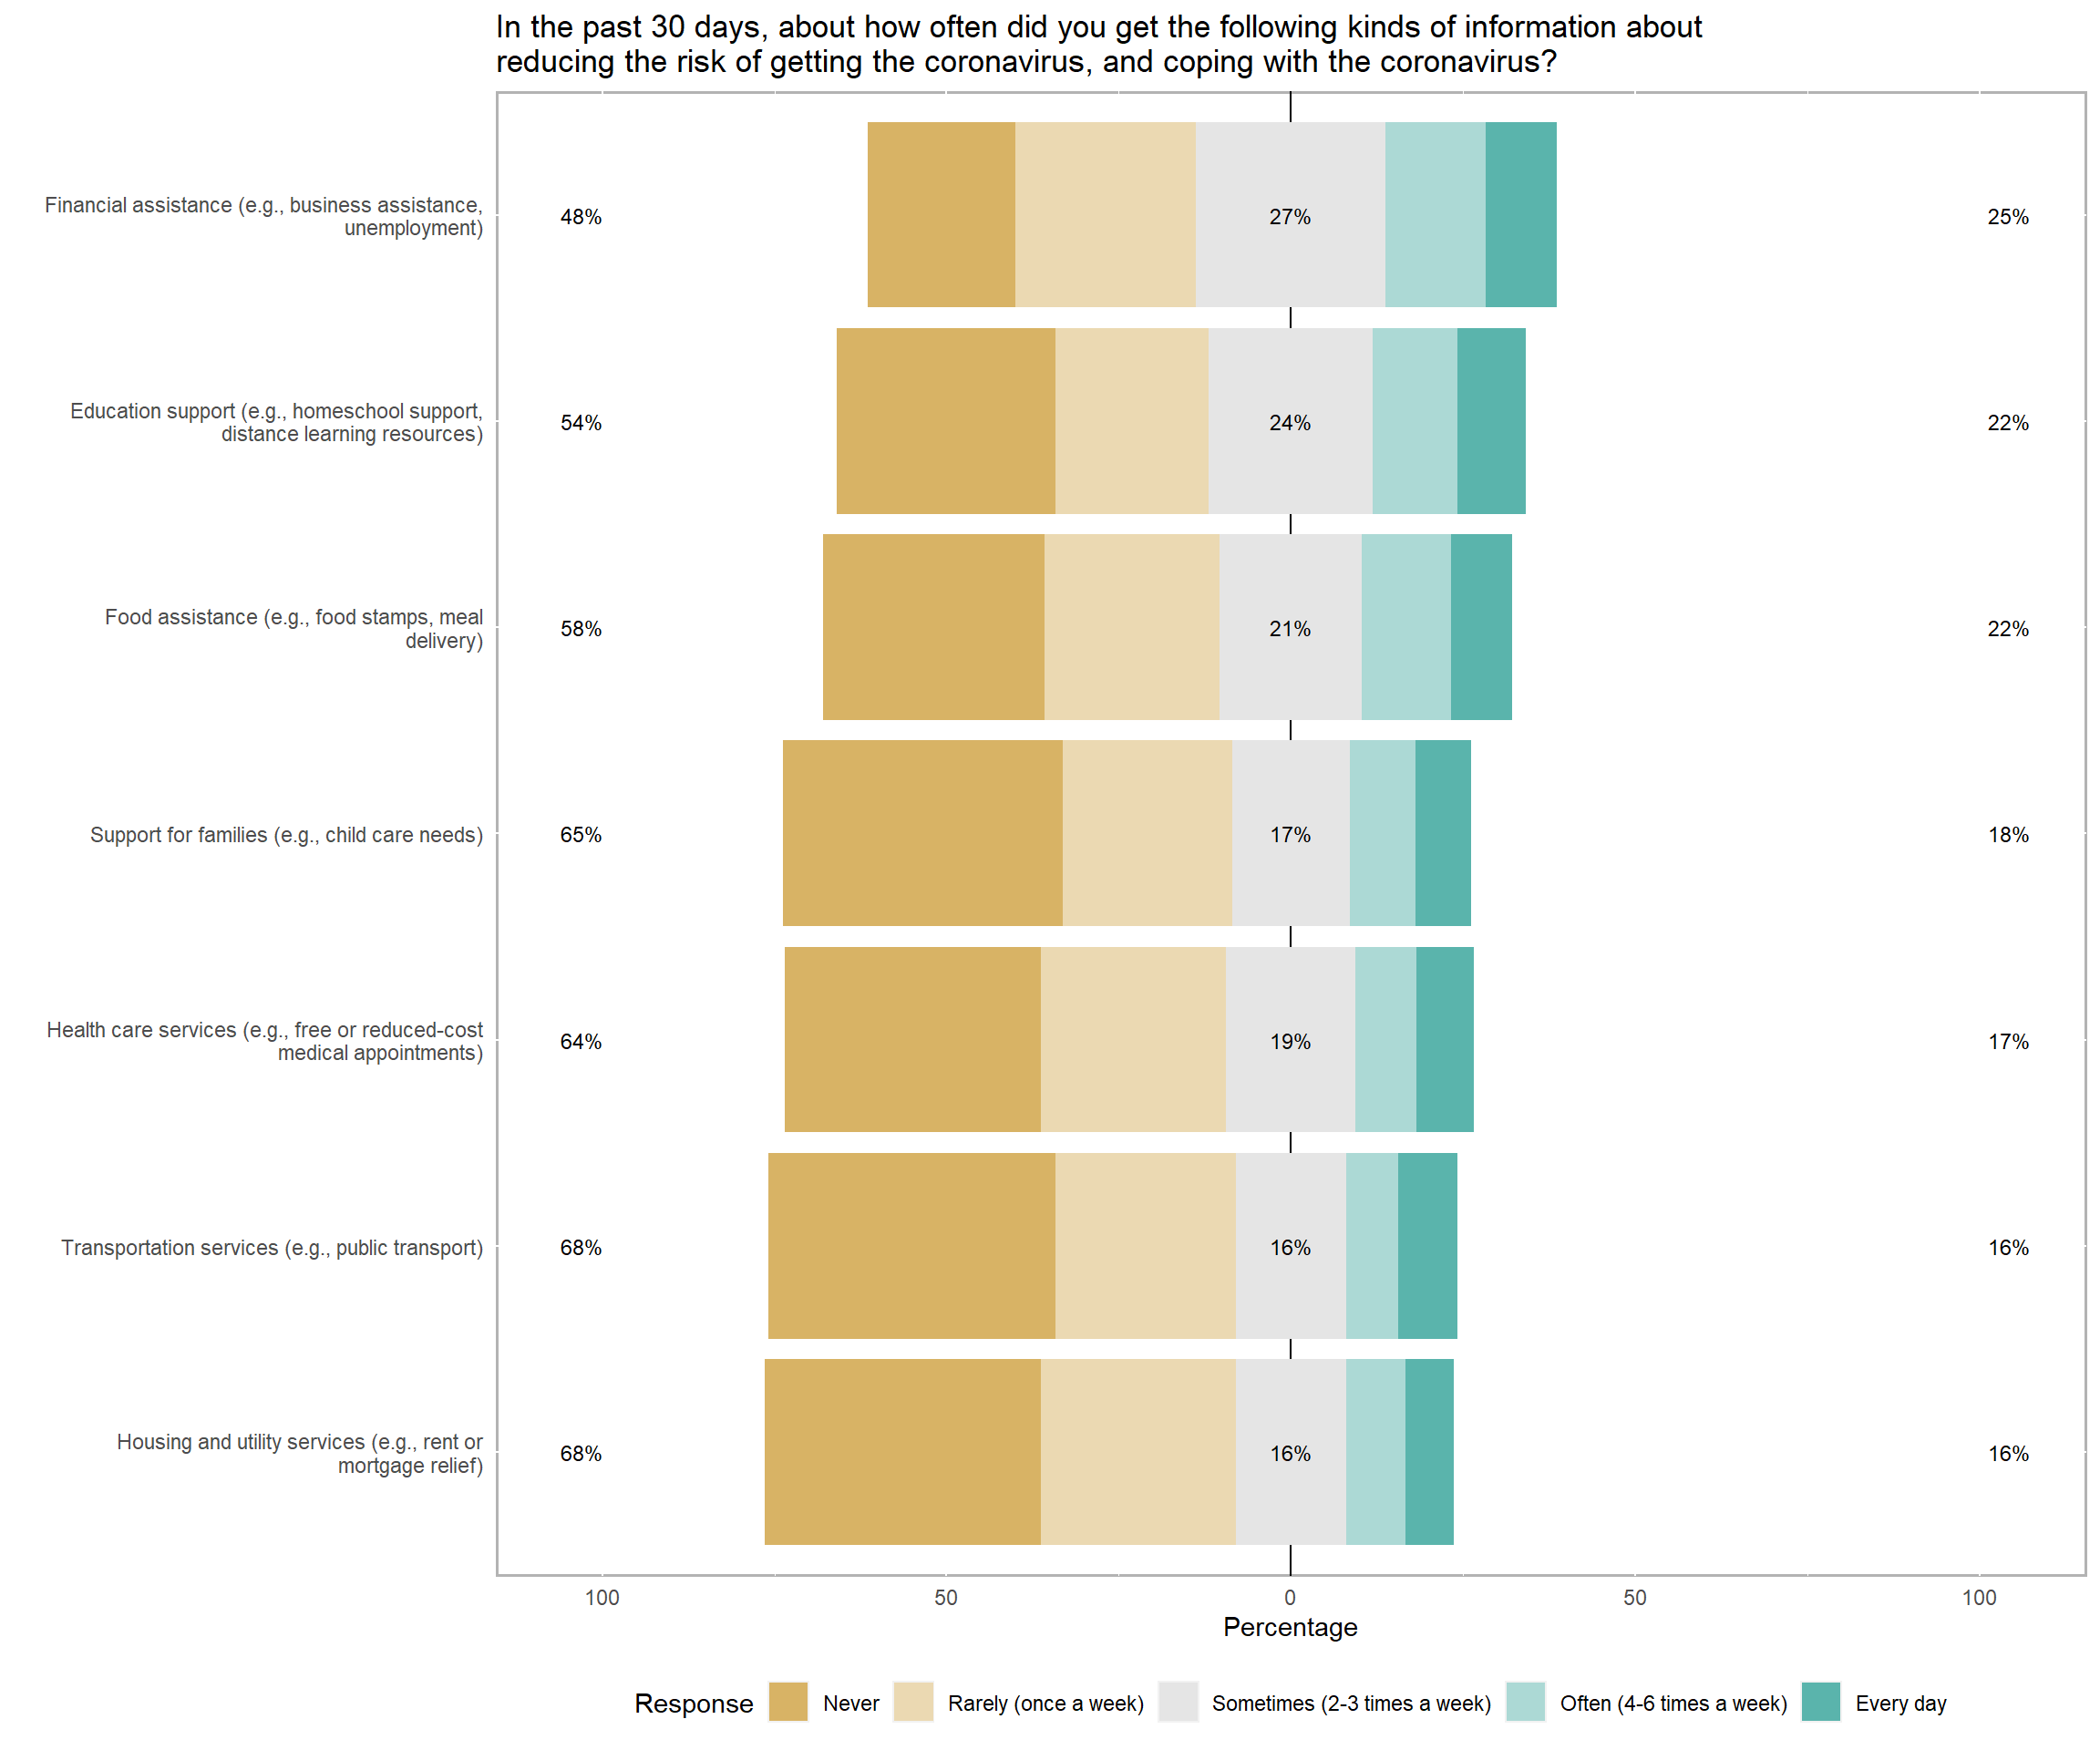
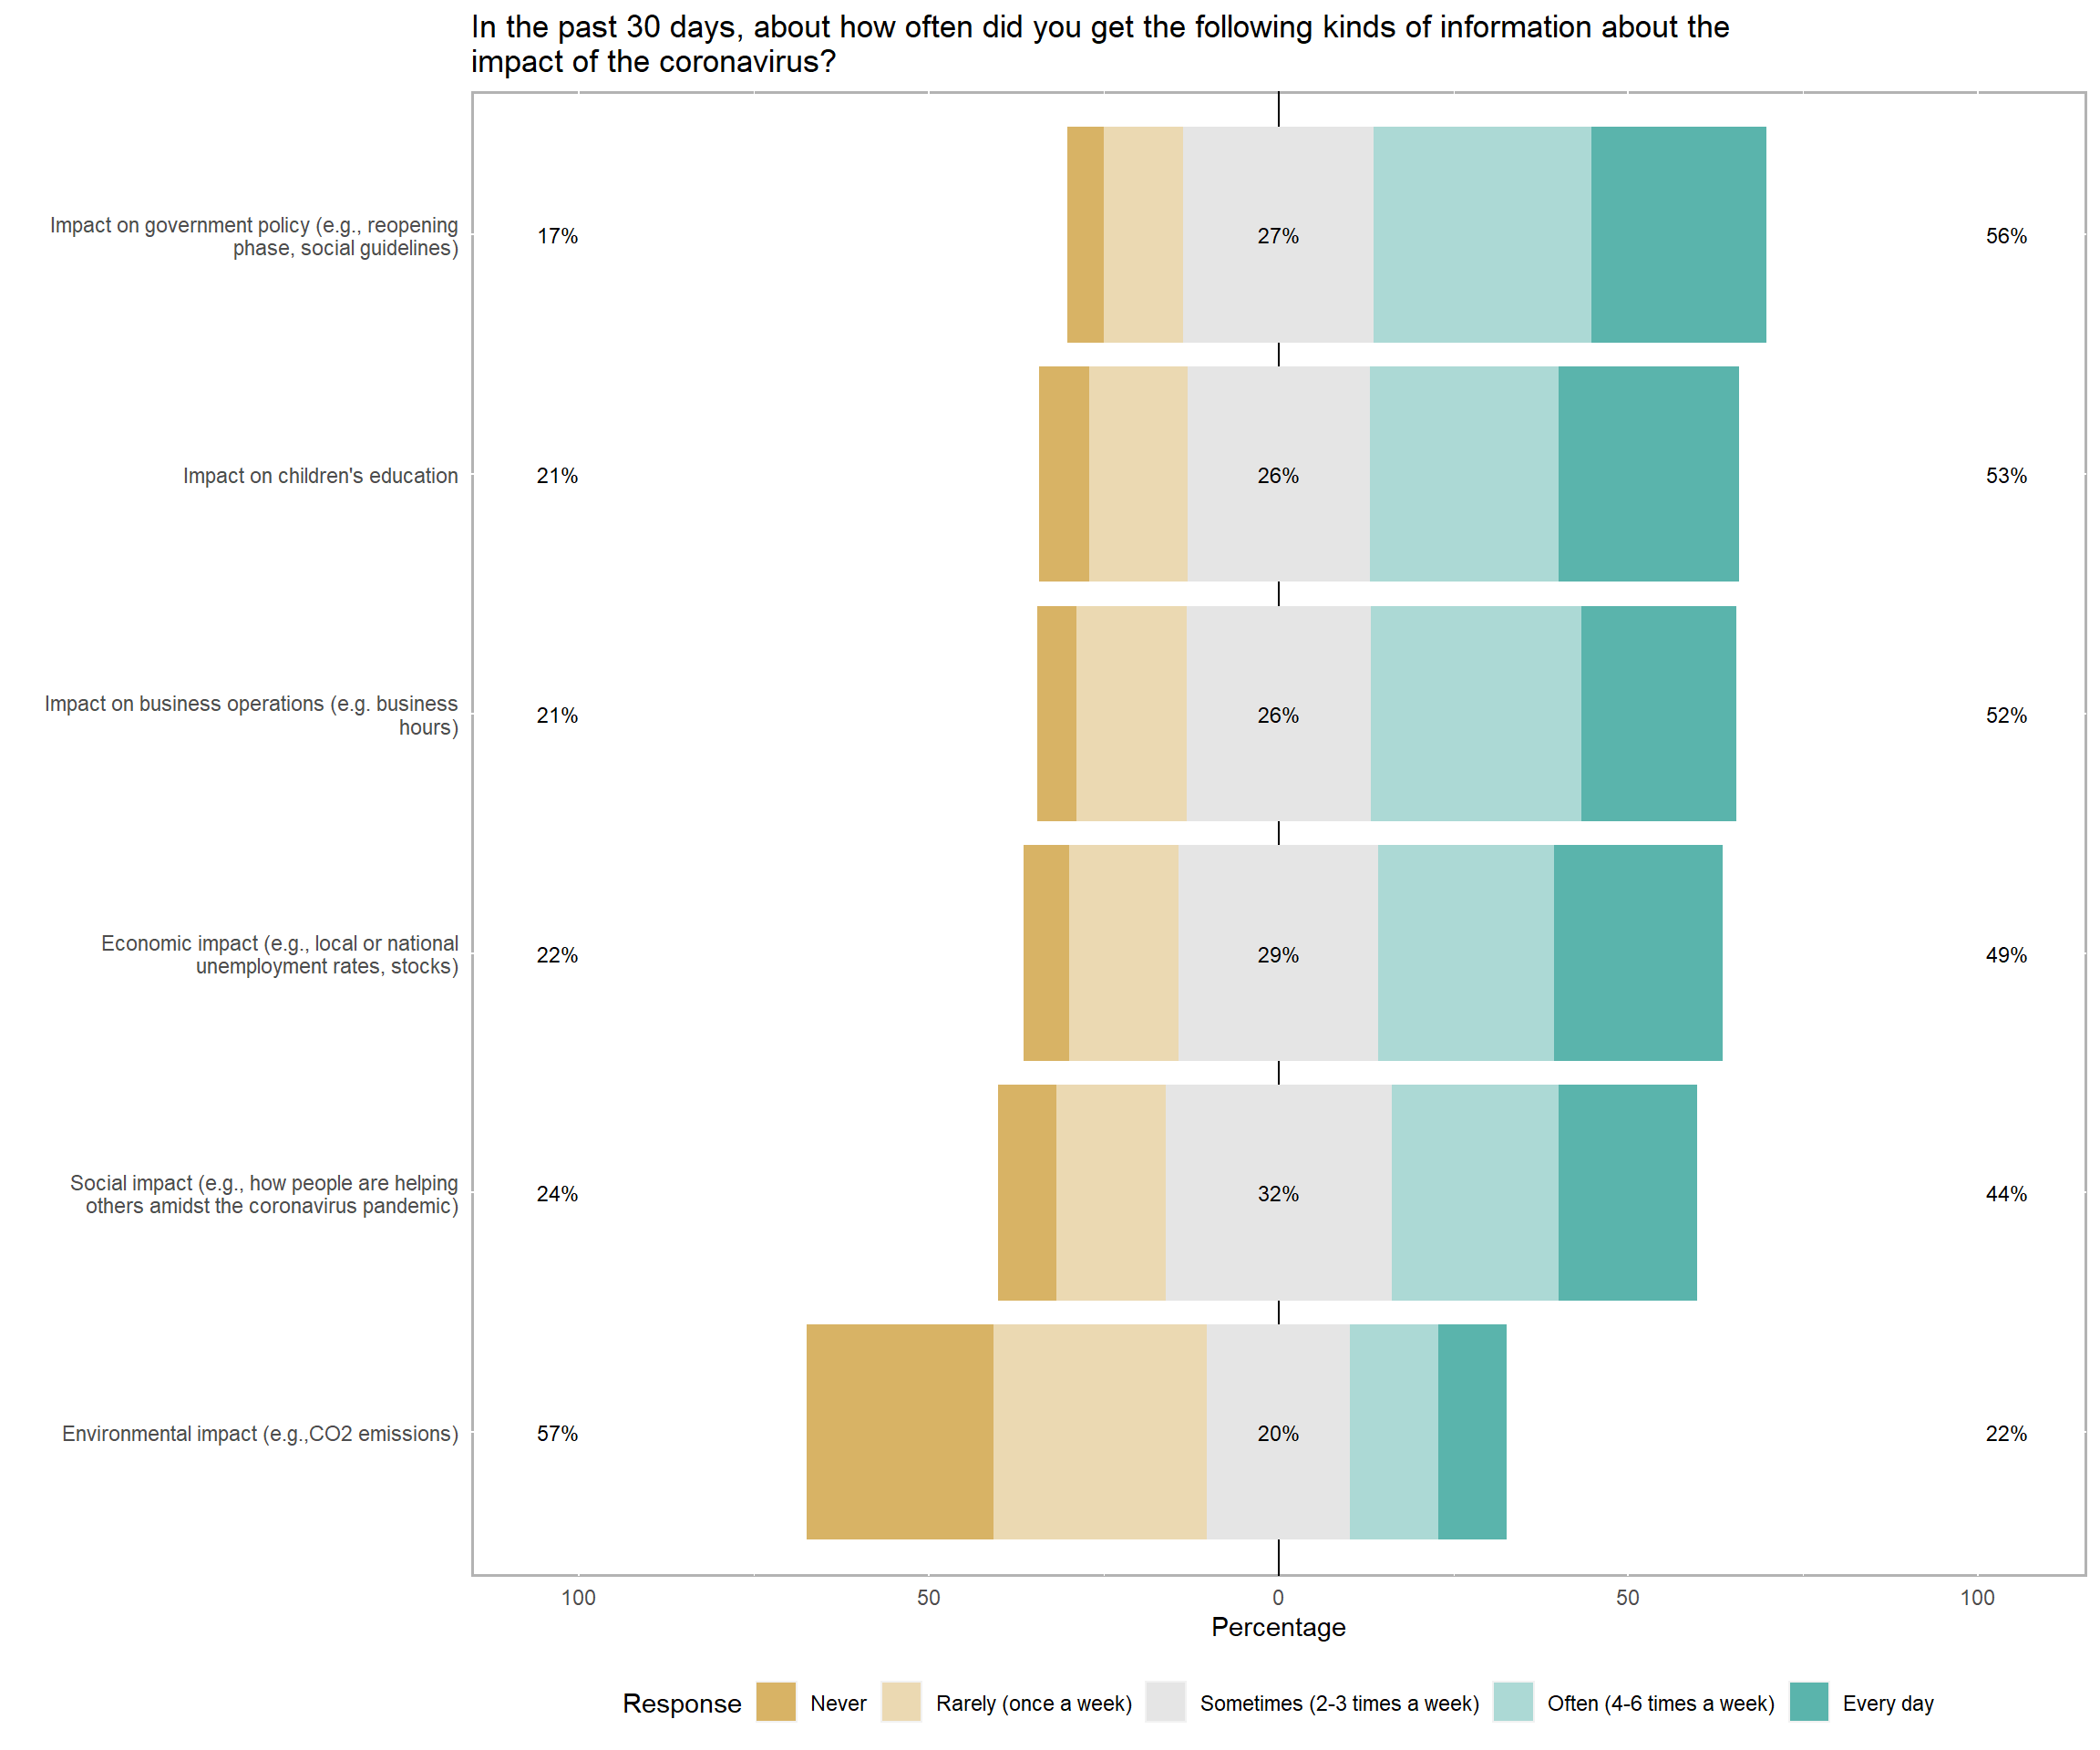
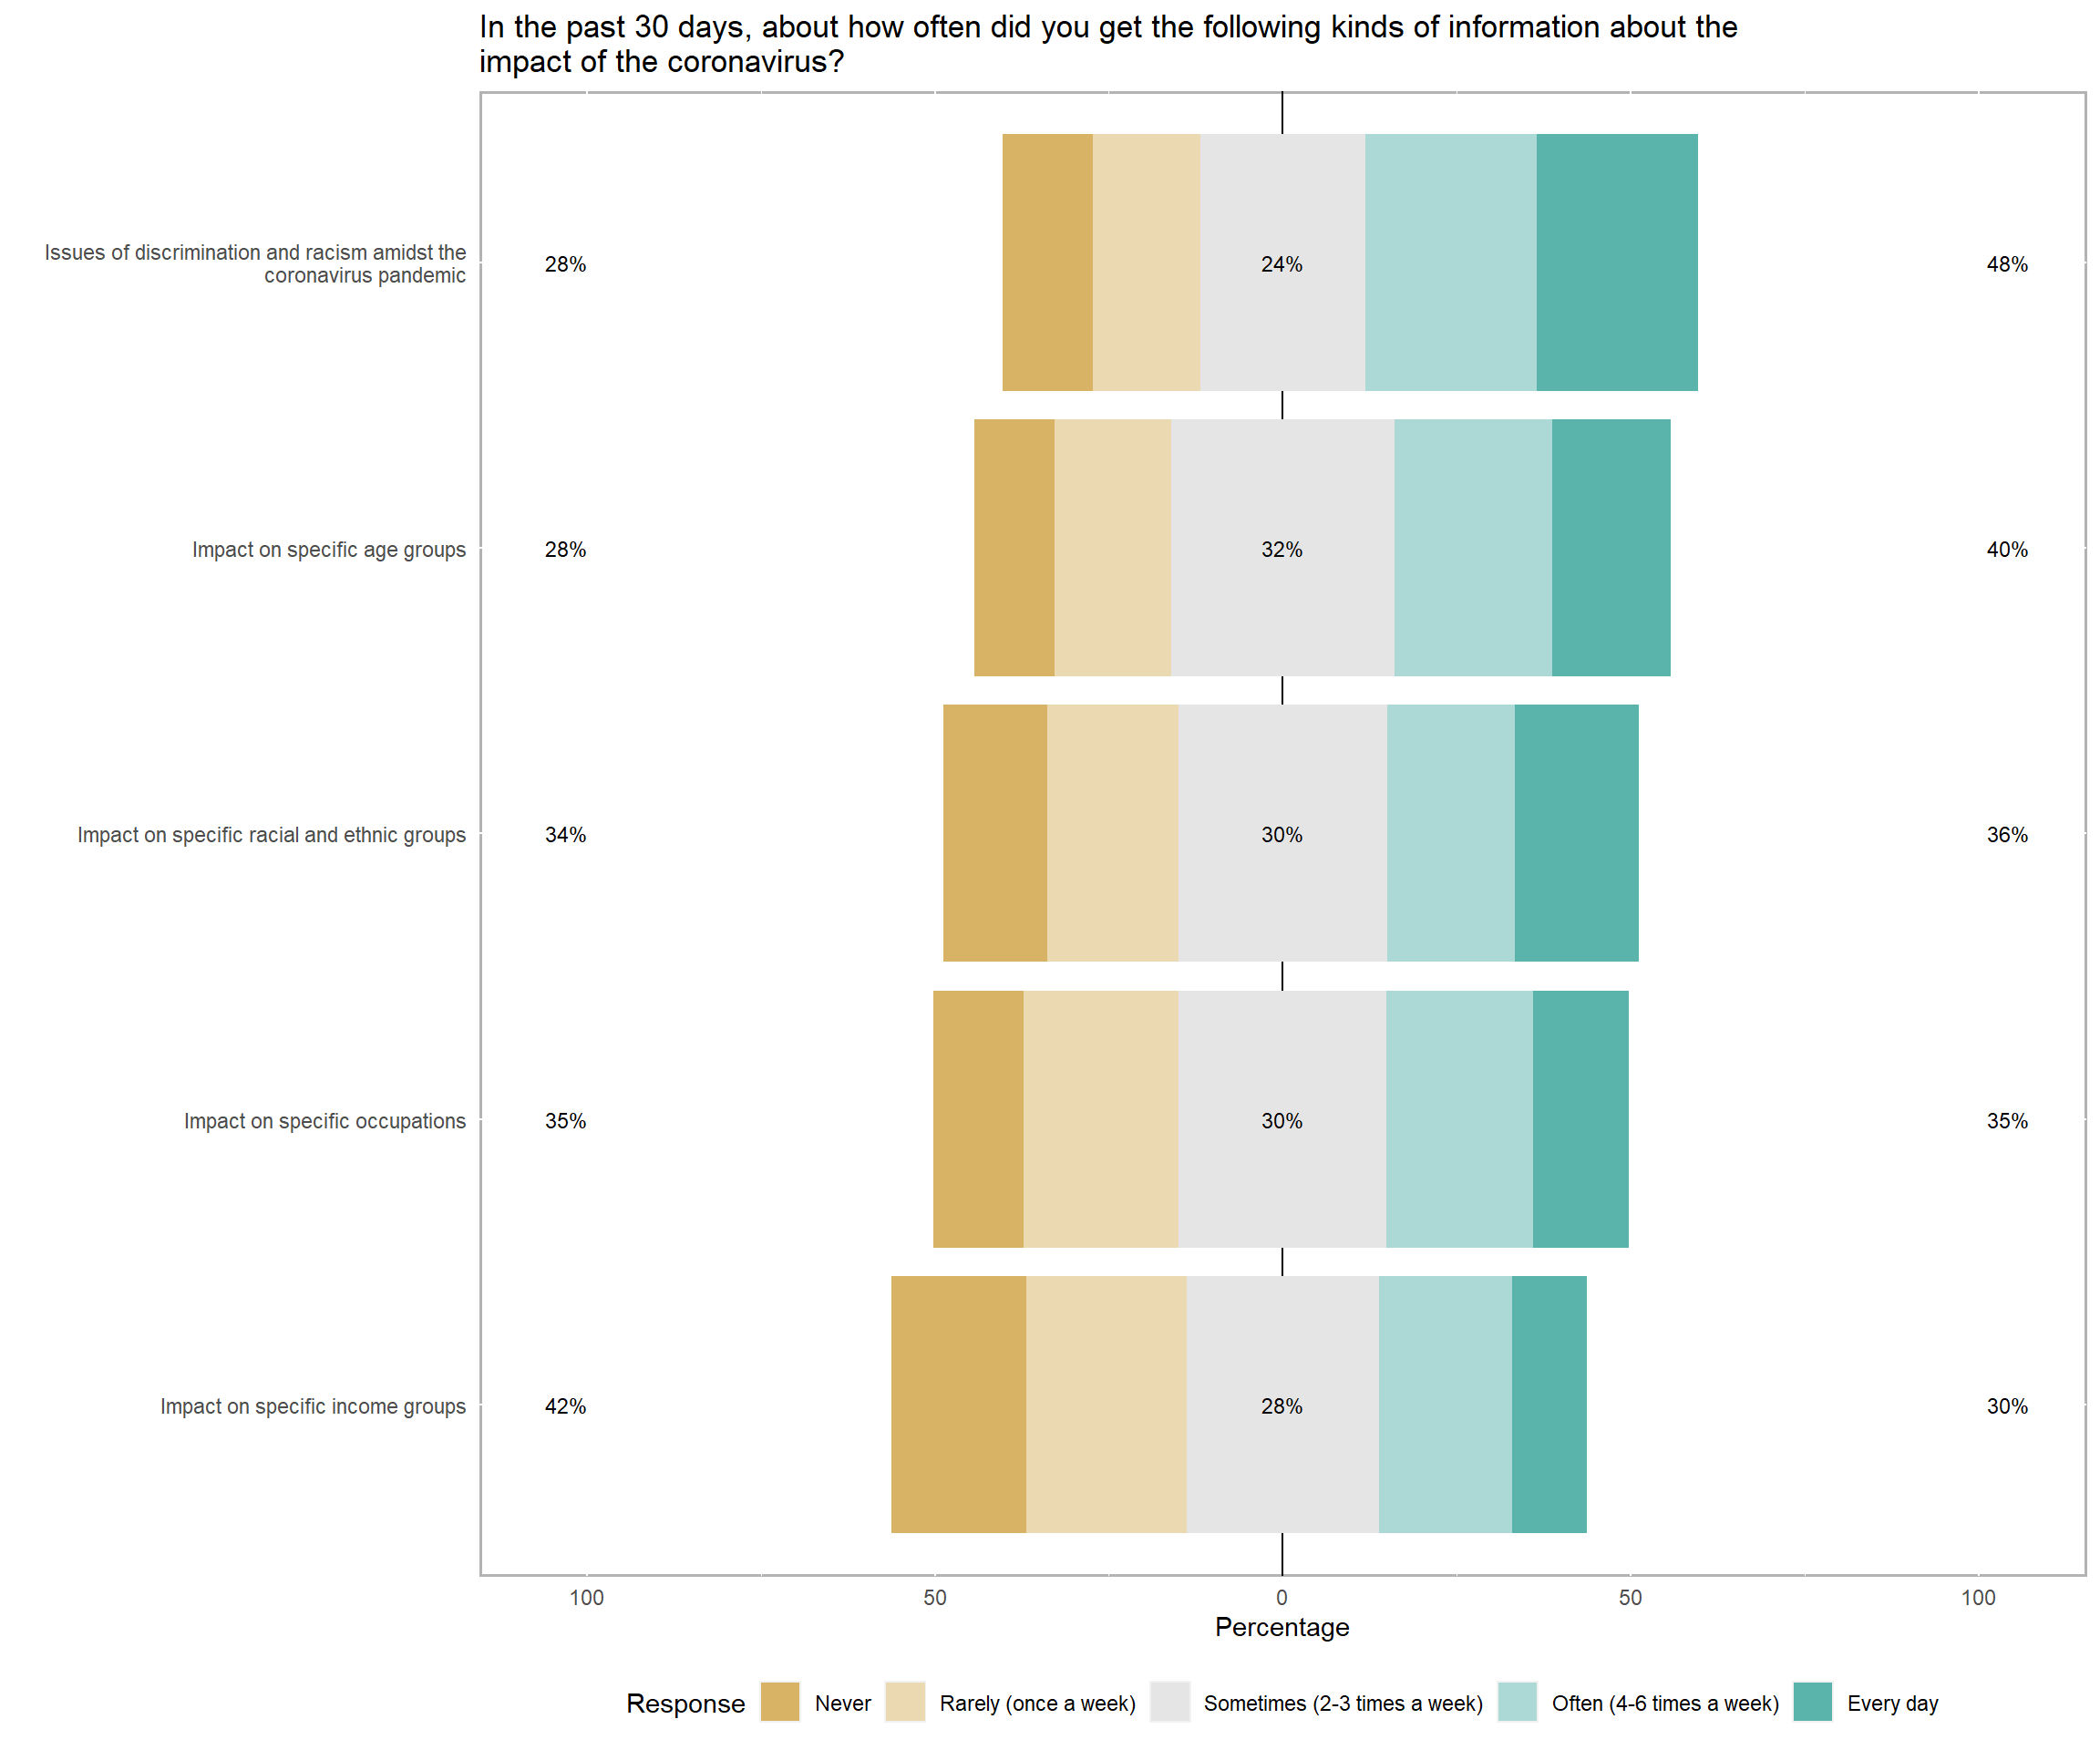
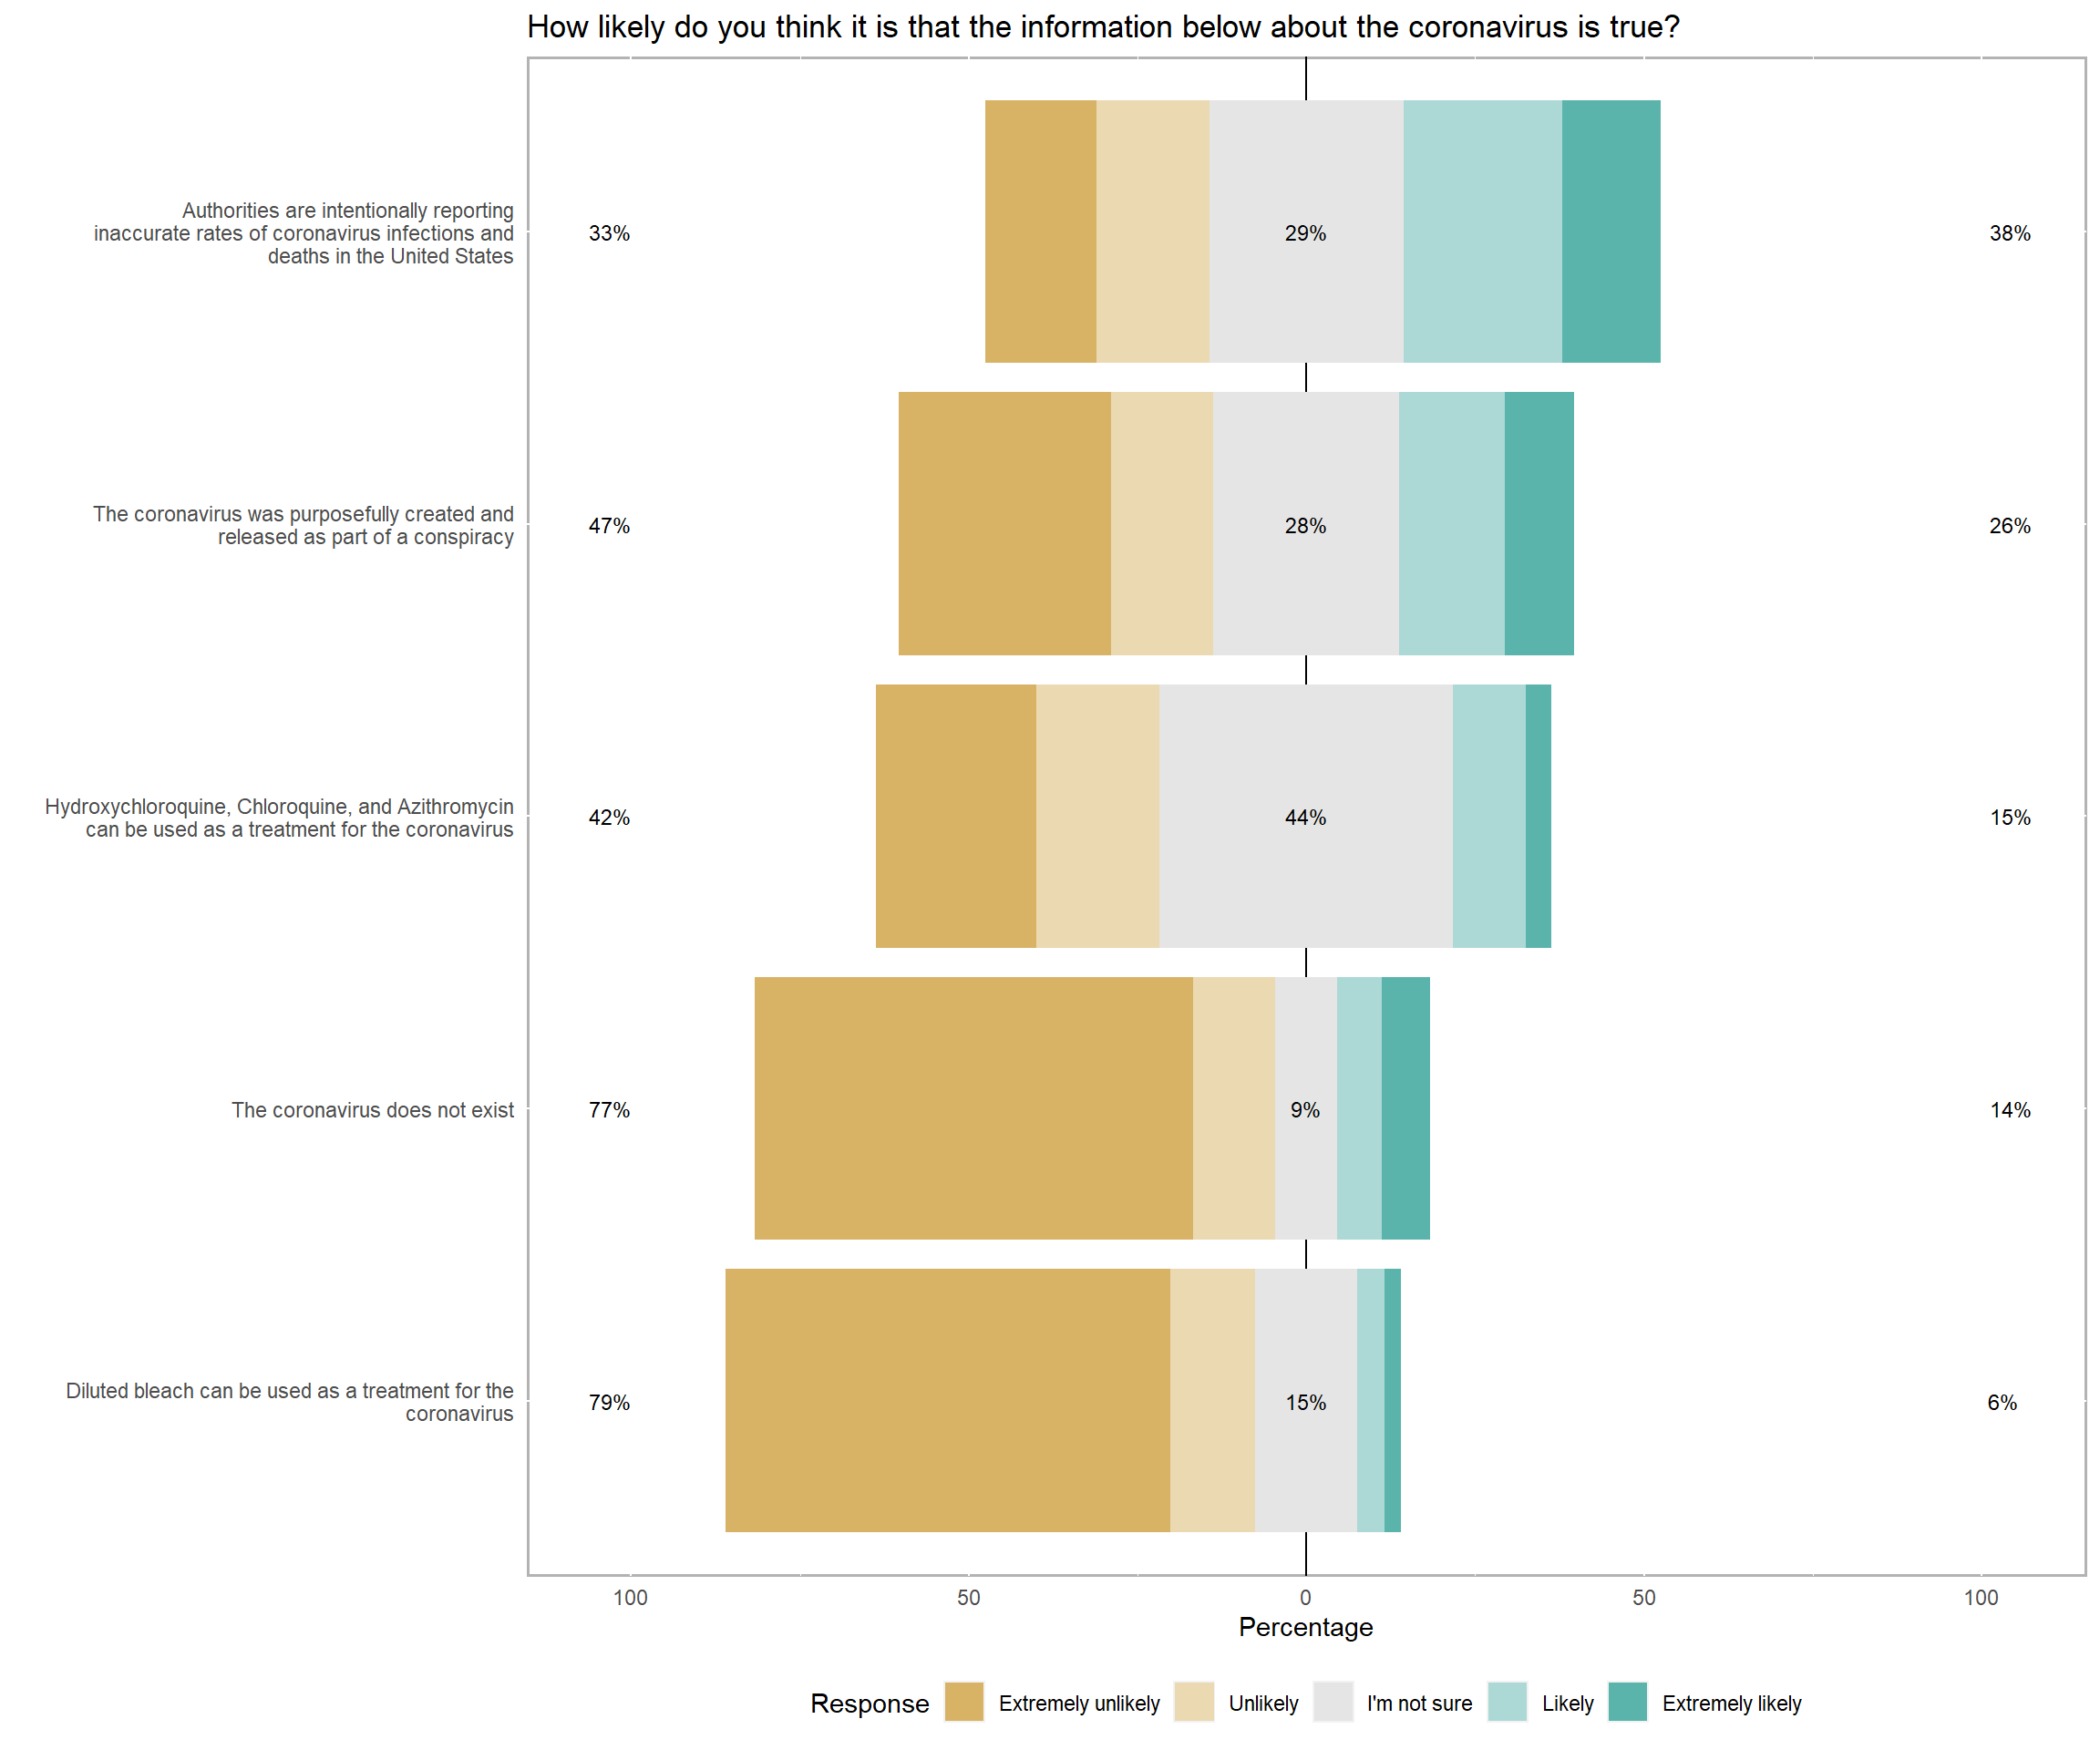
| income_reduction [ordered, factor] | 1. Not reduced at all 2. Somewhat reduced 3. Moderately reduced 4. Very reduced 5. Exremely reduced |
|
 |
54 (9.36%) |
Generated by summarytools 0.9.6 (R version 3.6.2)
2020-09-18
2.2 Corona status
| Variable | Stats / Values | Freqs (% of Valid) | Graph | Missing | ||||||||||||
|---|---|---|---|---|---|---|---|---|---|---|---|---|---|---|---|---|
| has_tested [factor] | 1. No 2. Yes |
|
 |
0 (0%) | ||||||||||||
| is_test_positive [factor] | 1. No 2. Waiting for results 3. Yes |
|
 |
426 (73.83%) | ||||||||||||
| have_recovered [factor] | 1. No 2. Yes |
|
 |
567 (98.27%) | ||||||||||||
| know_someone_positive [factor] | 1. No 2. Yes |
|
 |
0 (0%) |
Generated by summarytools 0.9.6 (R version 3.6.2)
2020-09-18
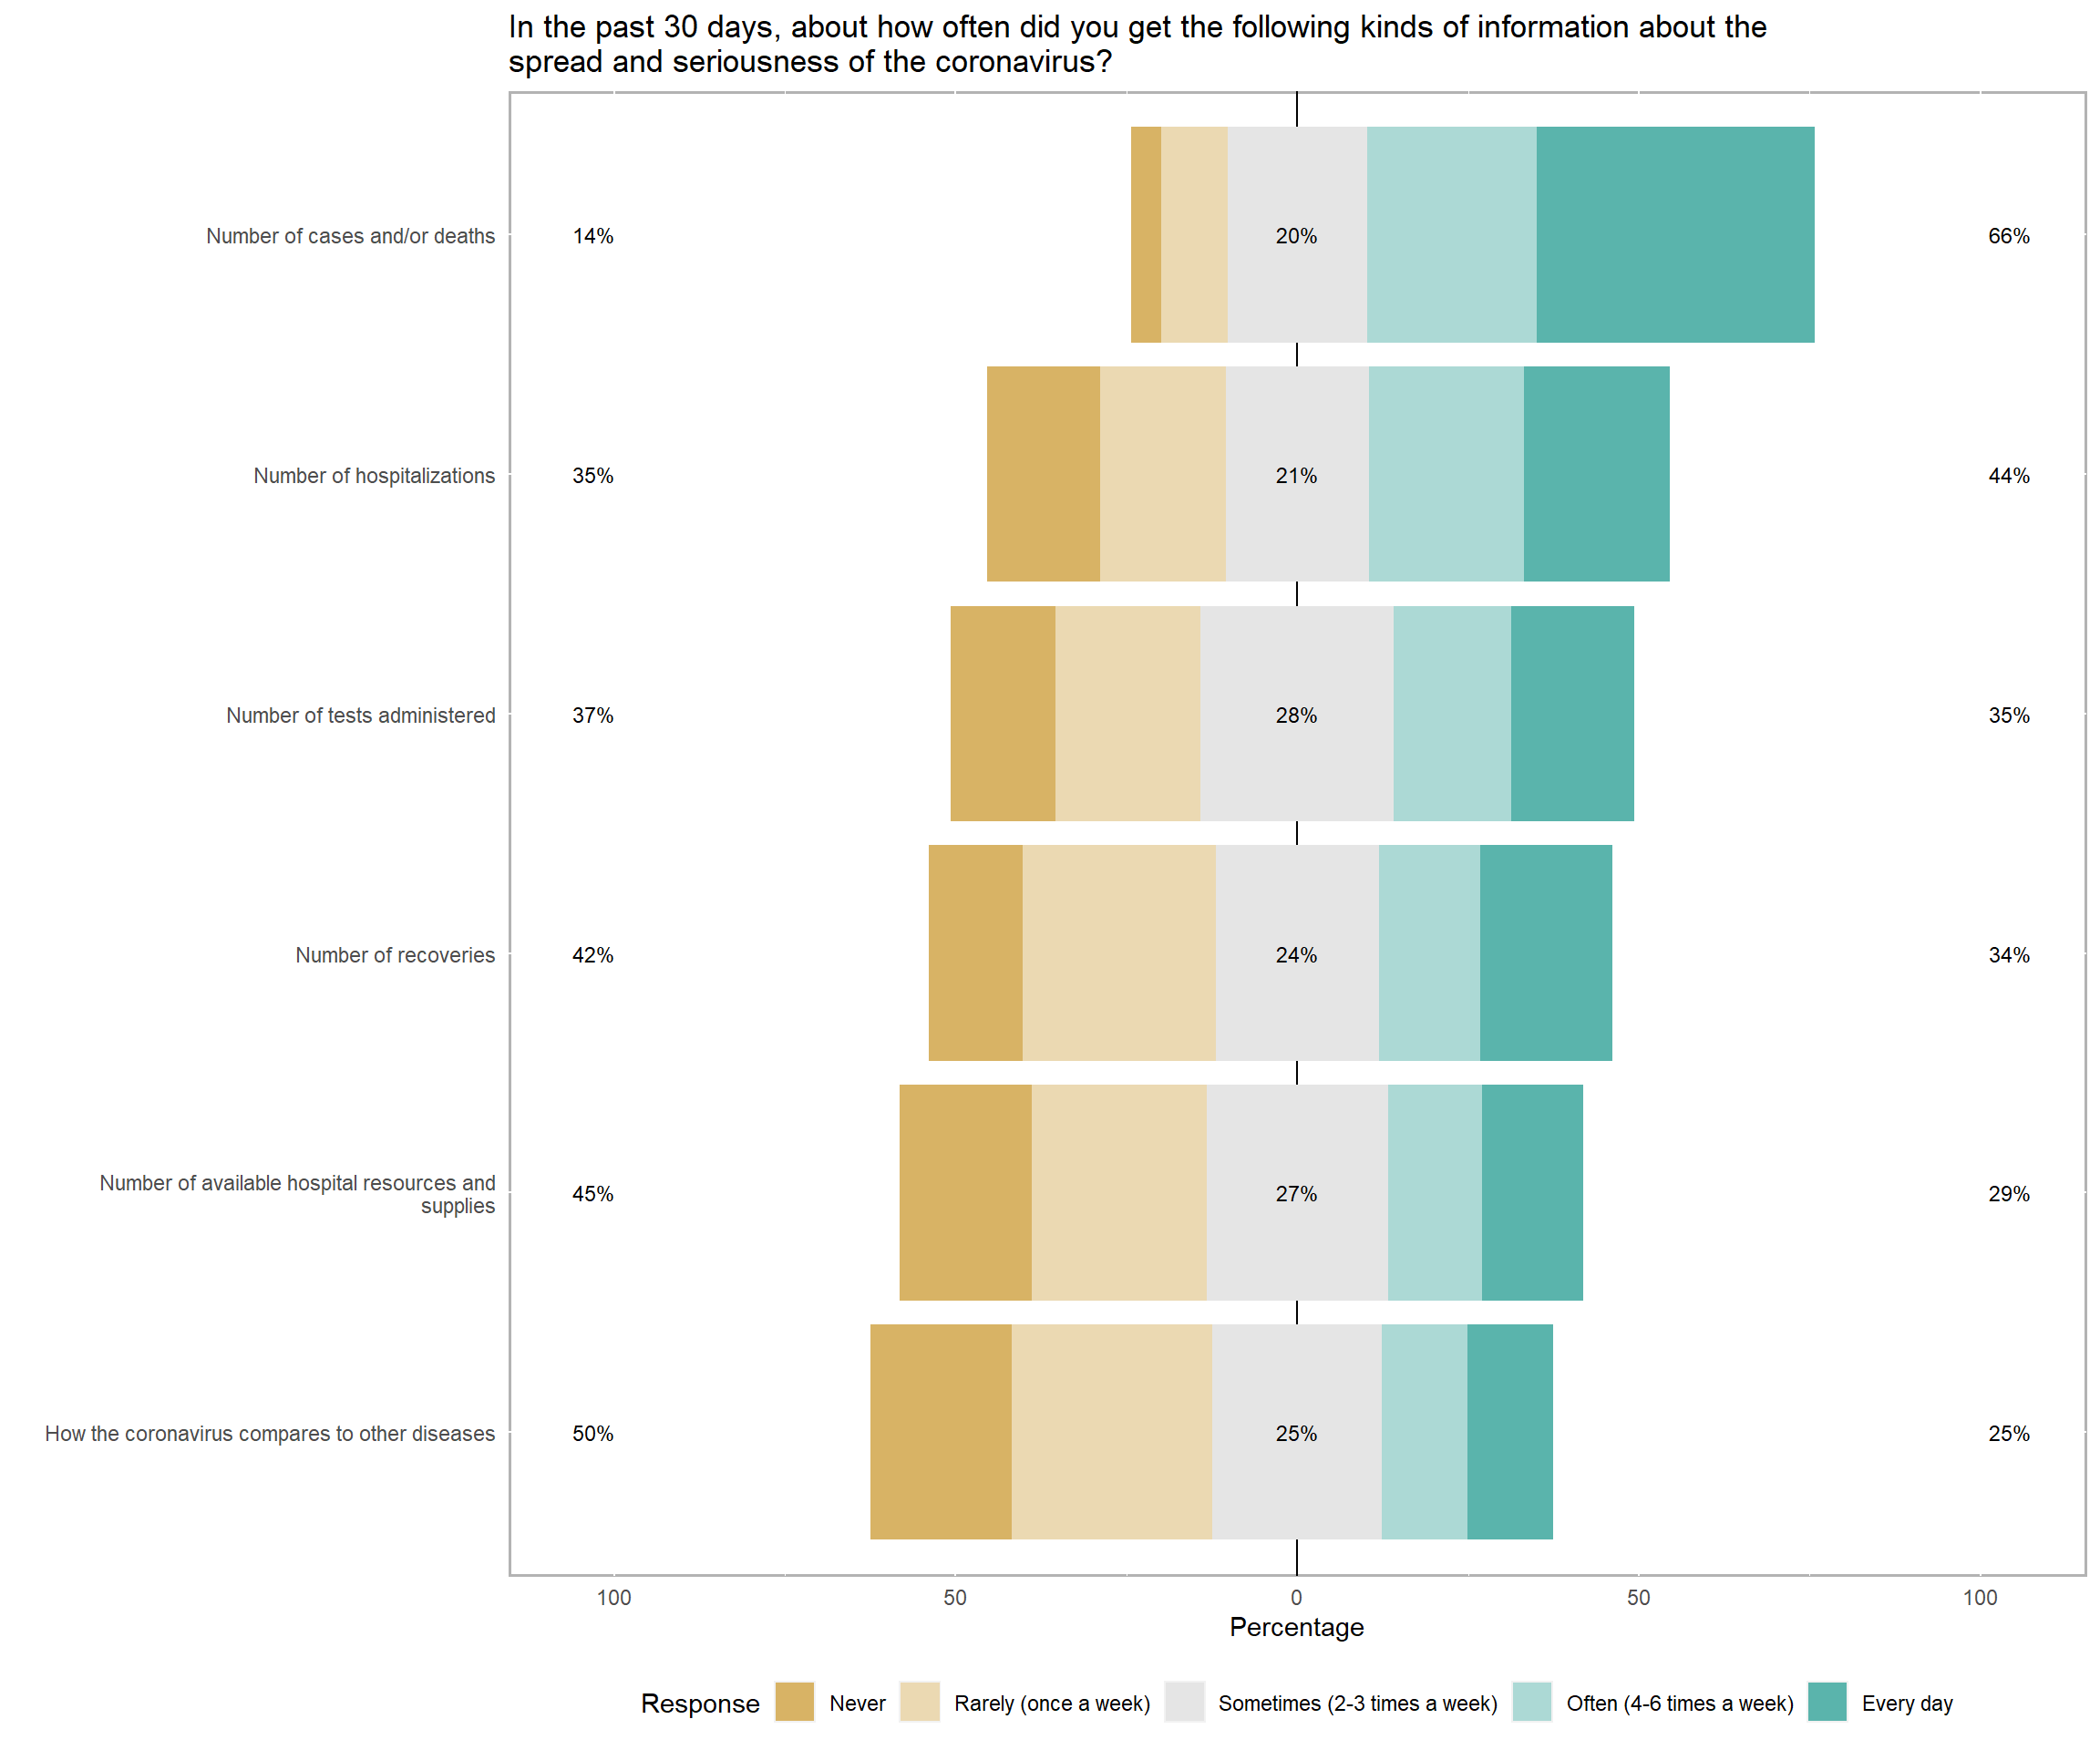
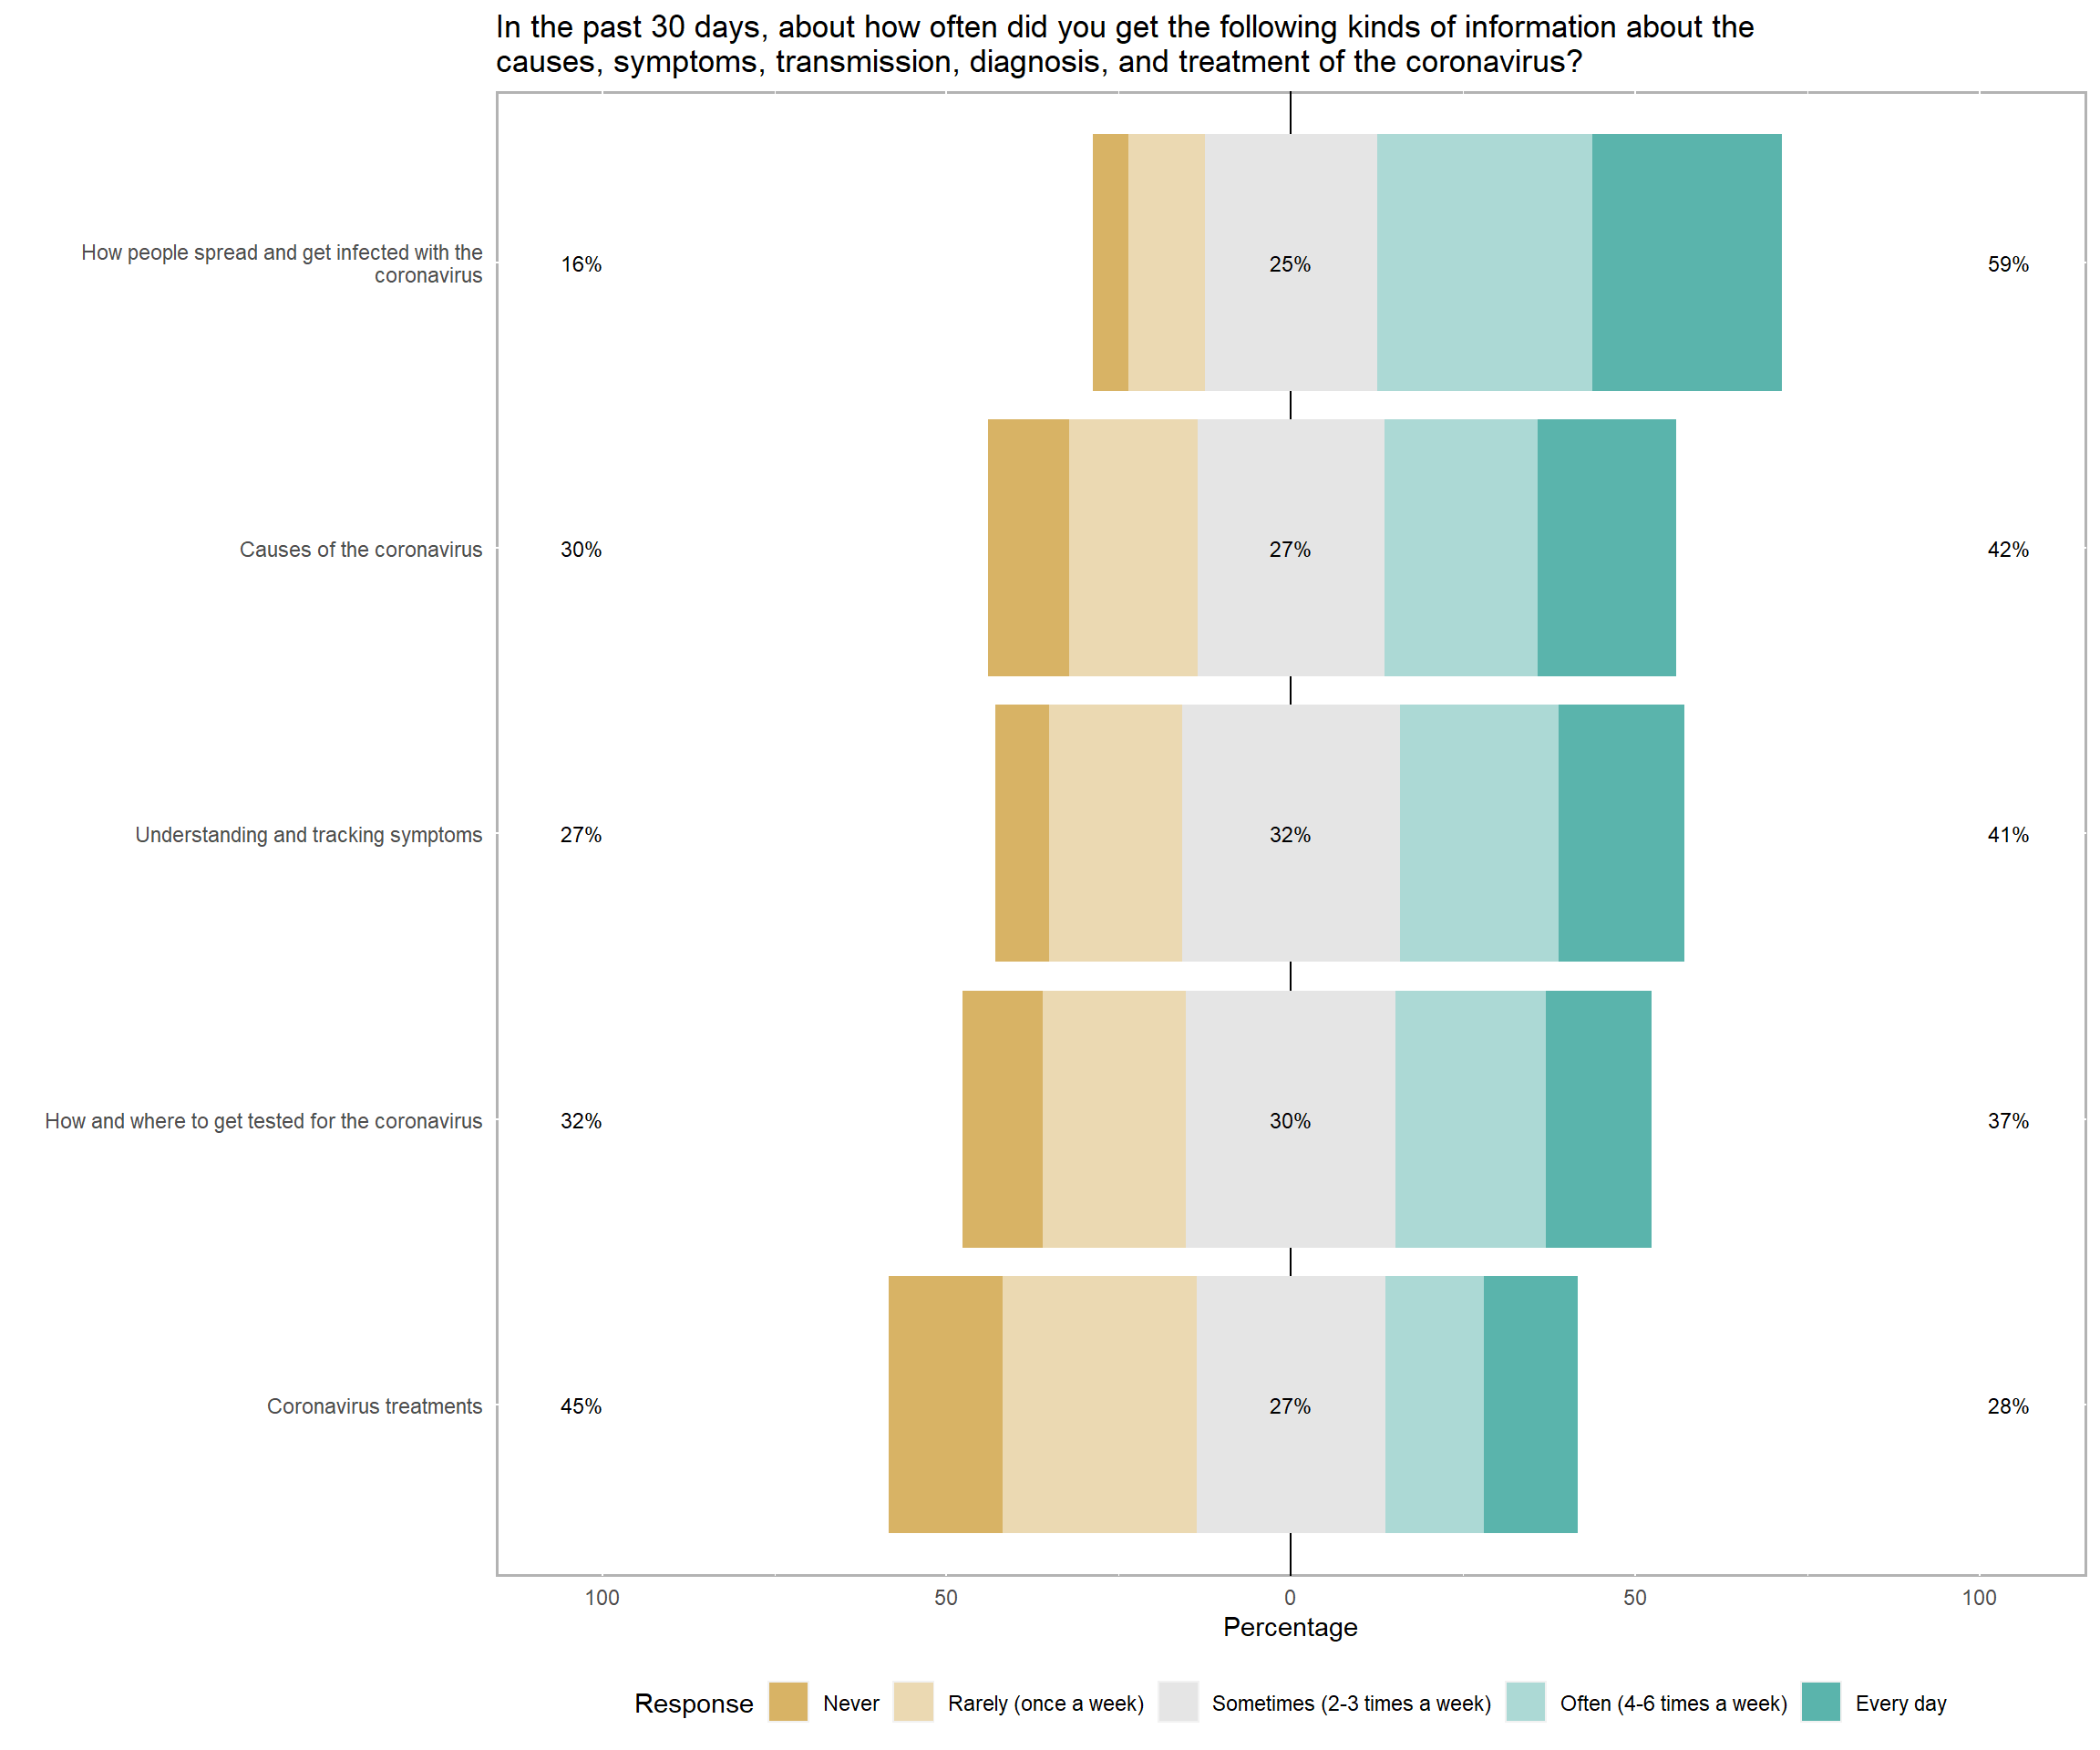
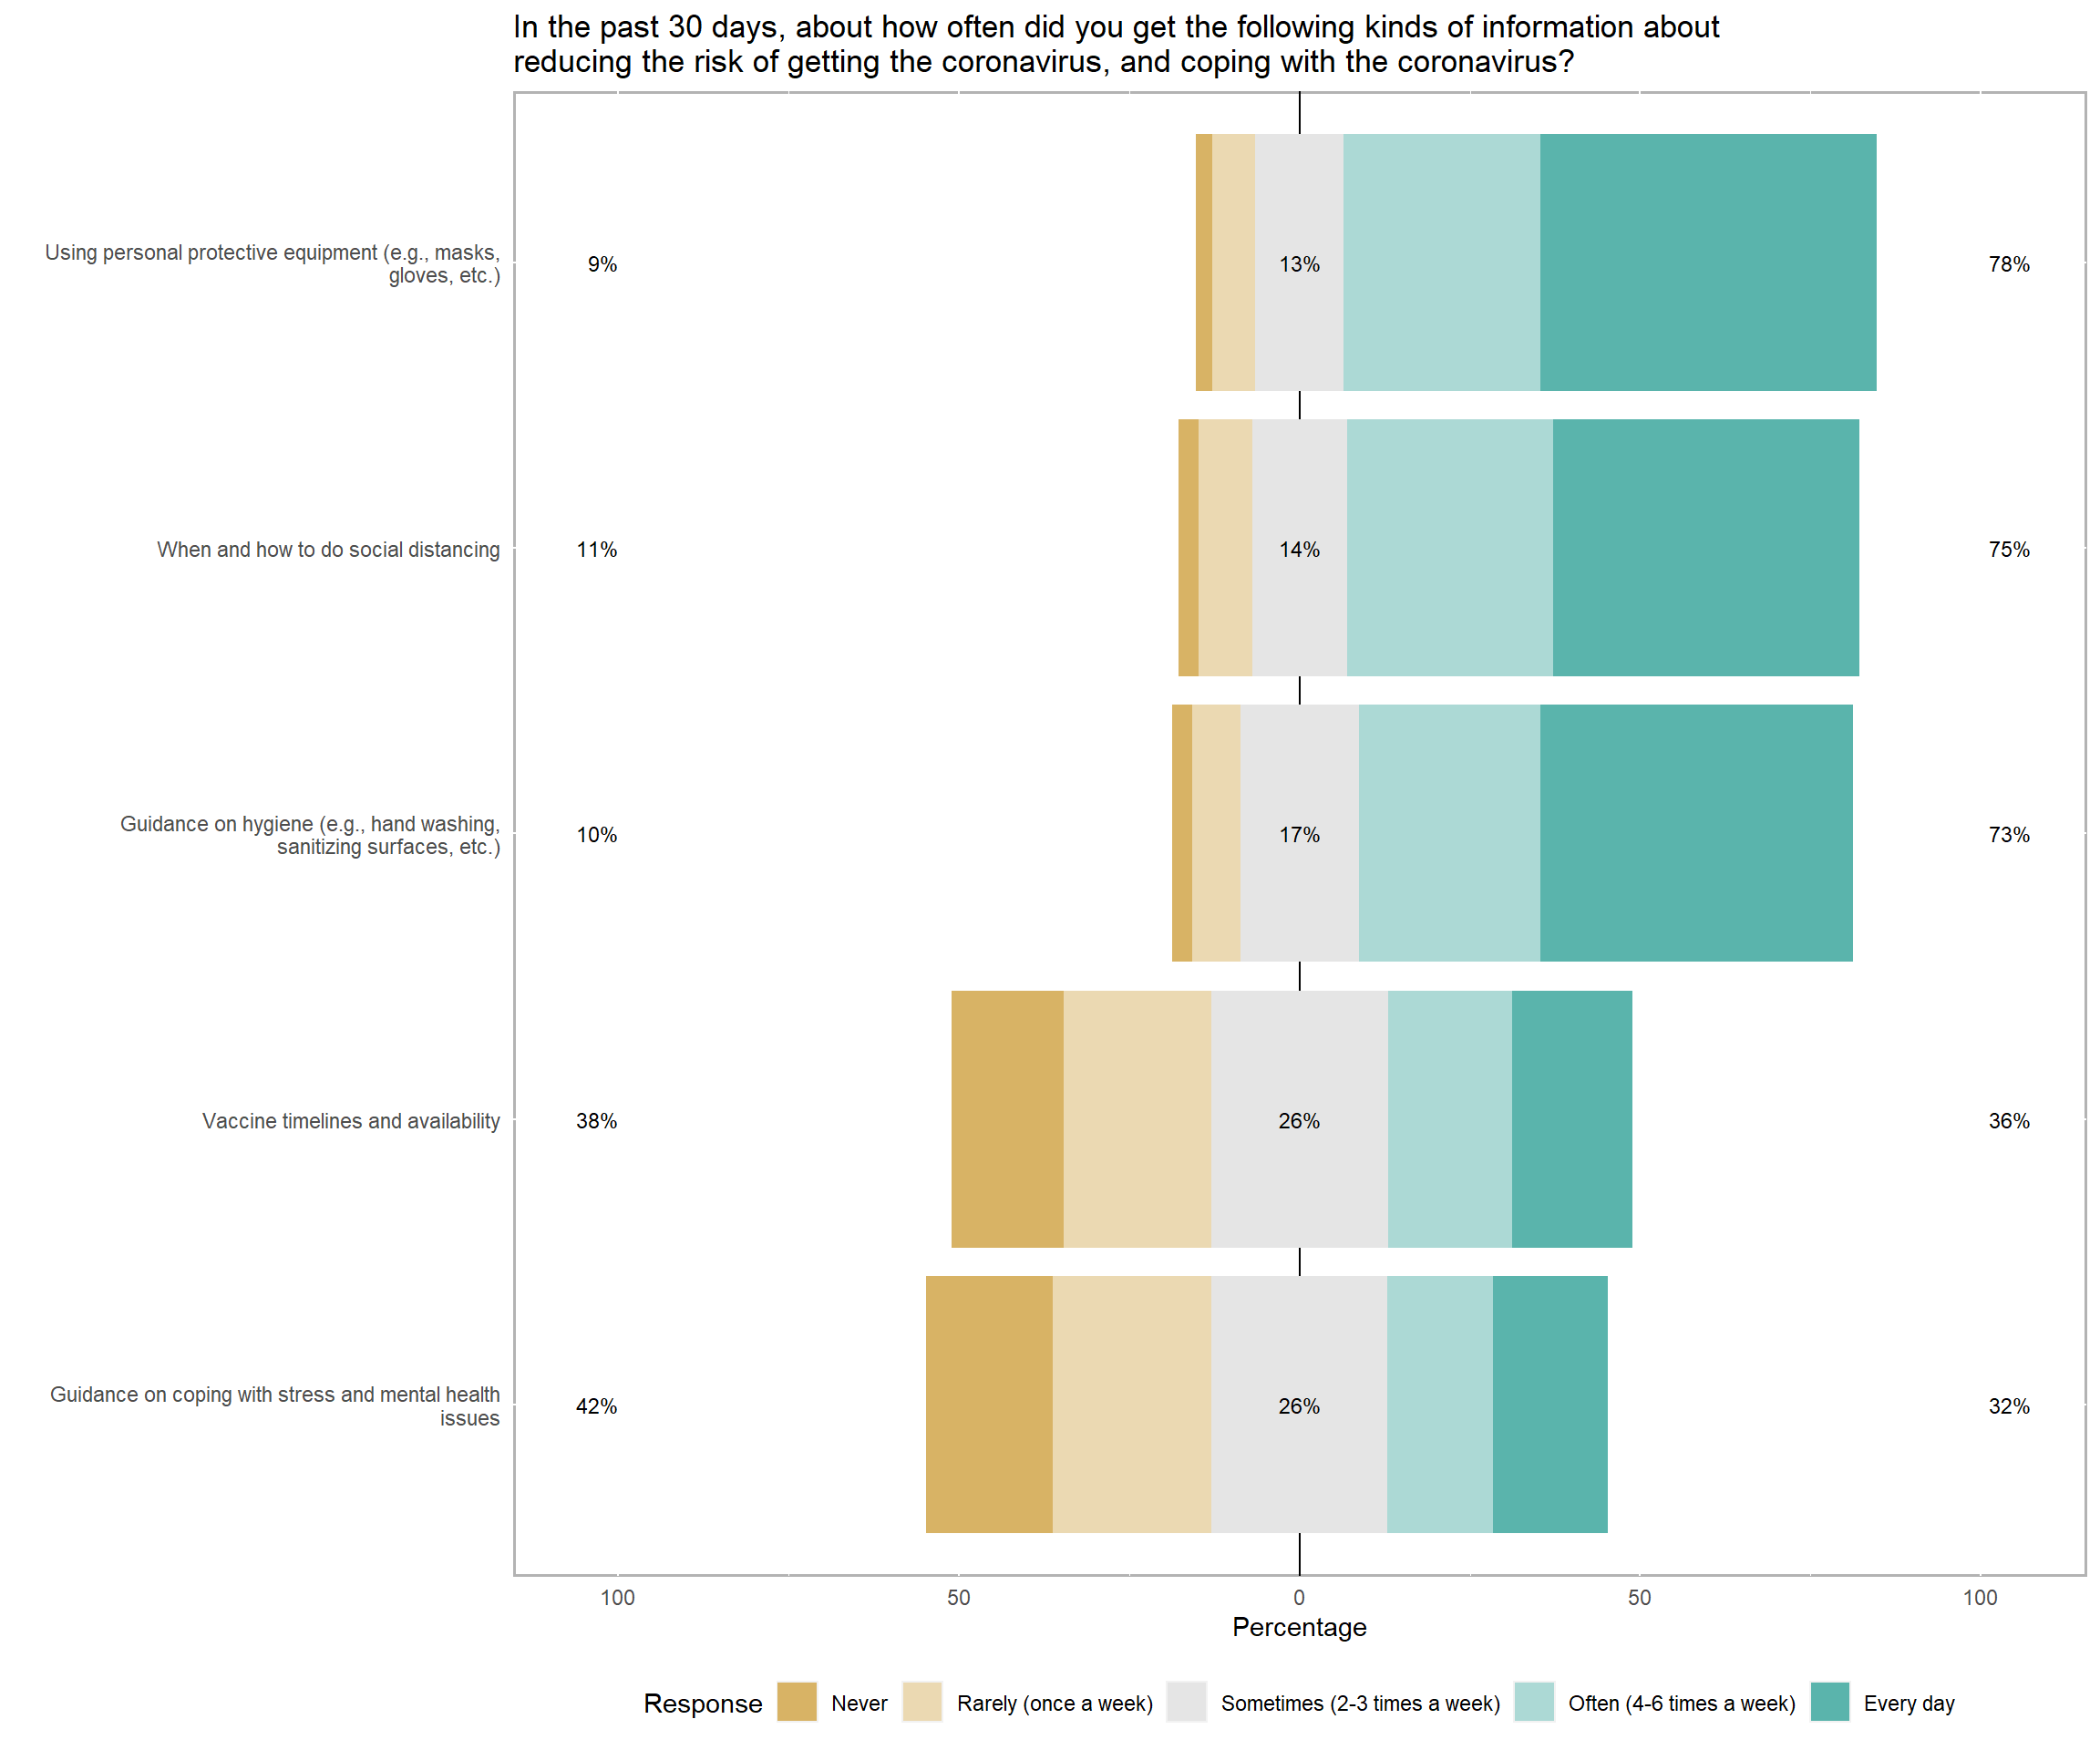
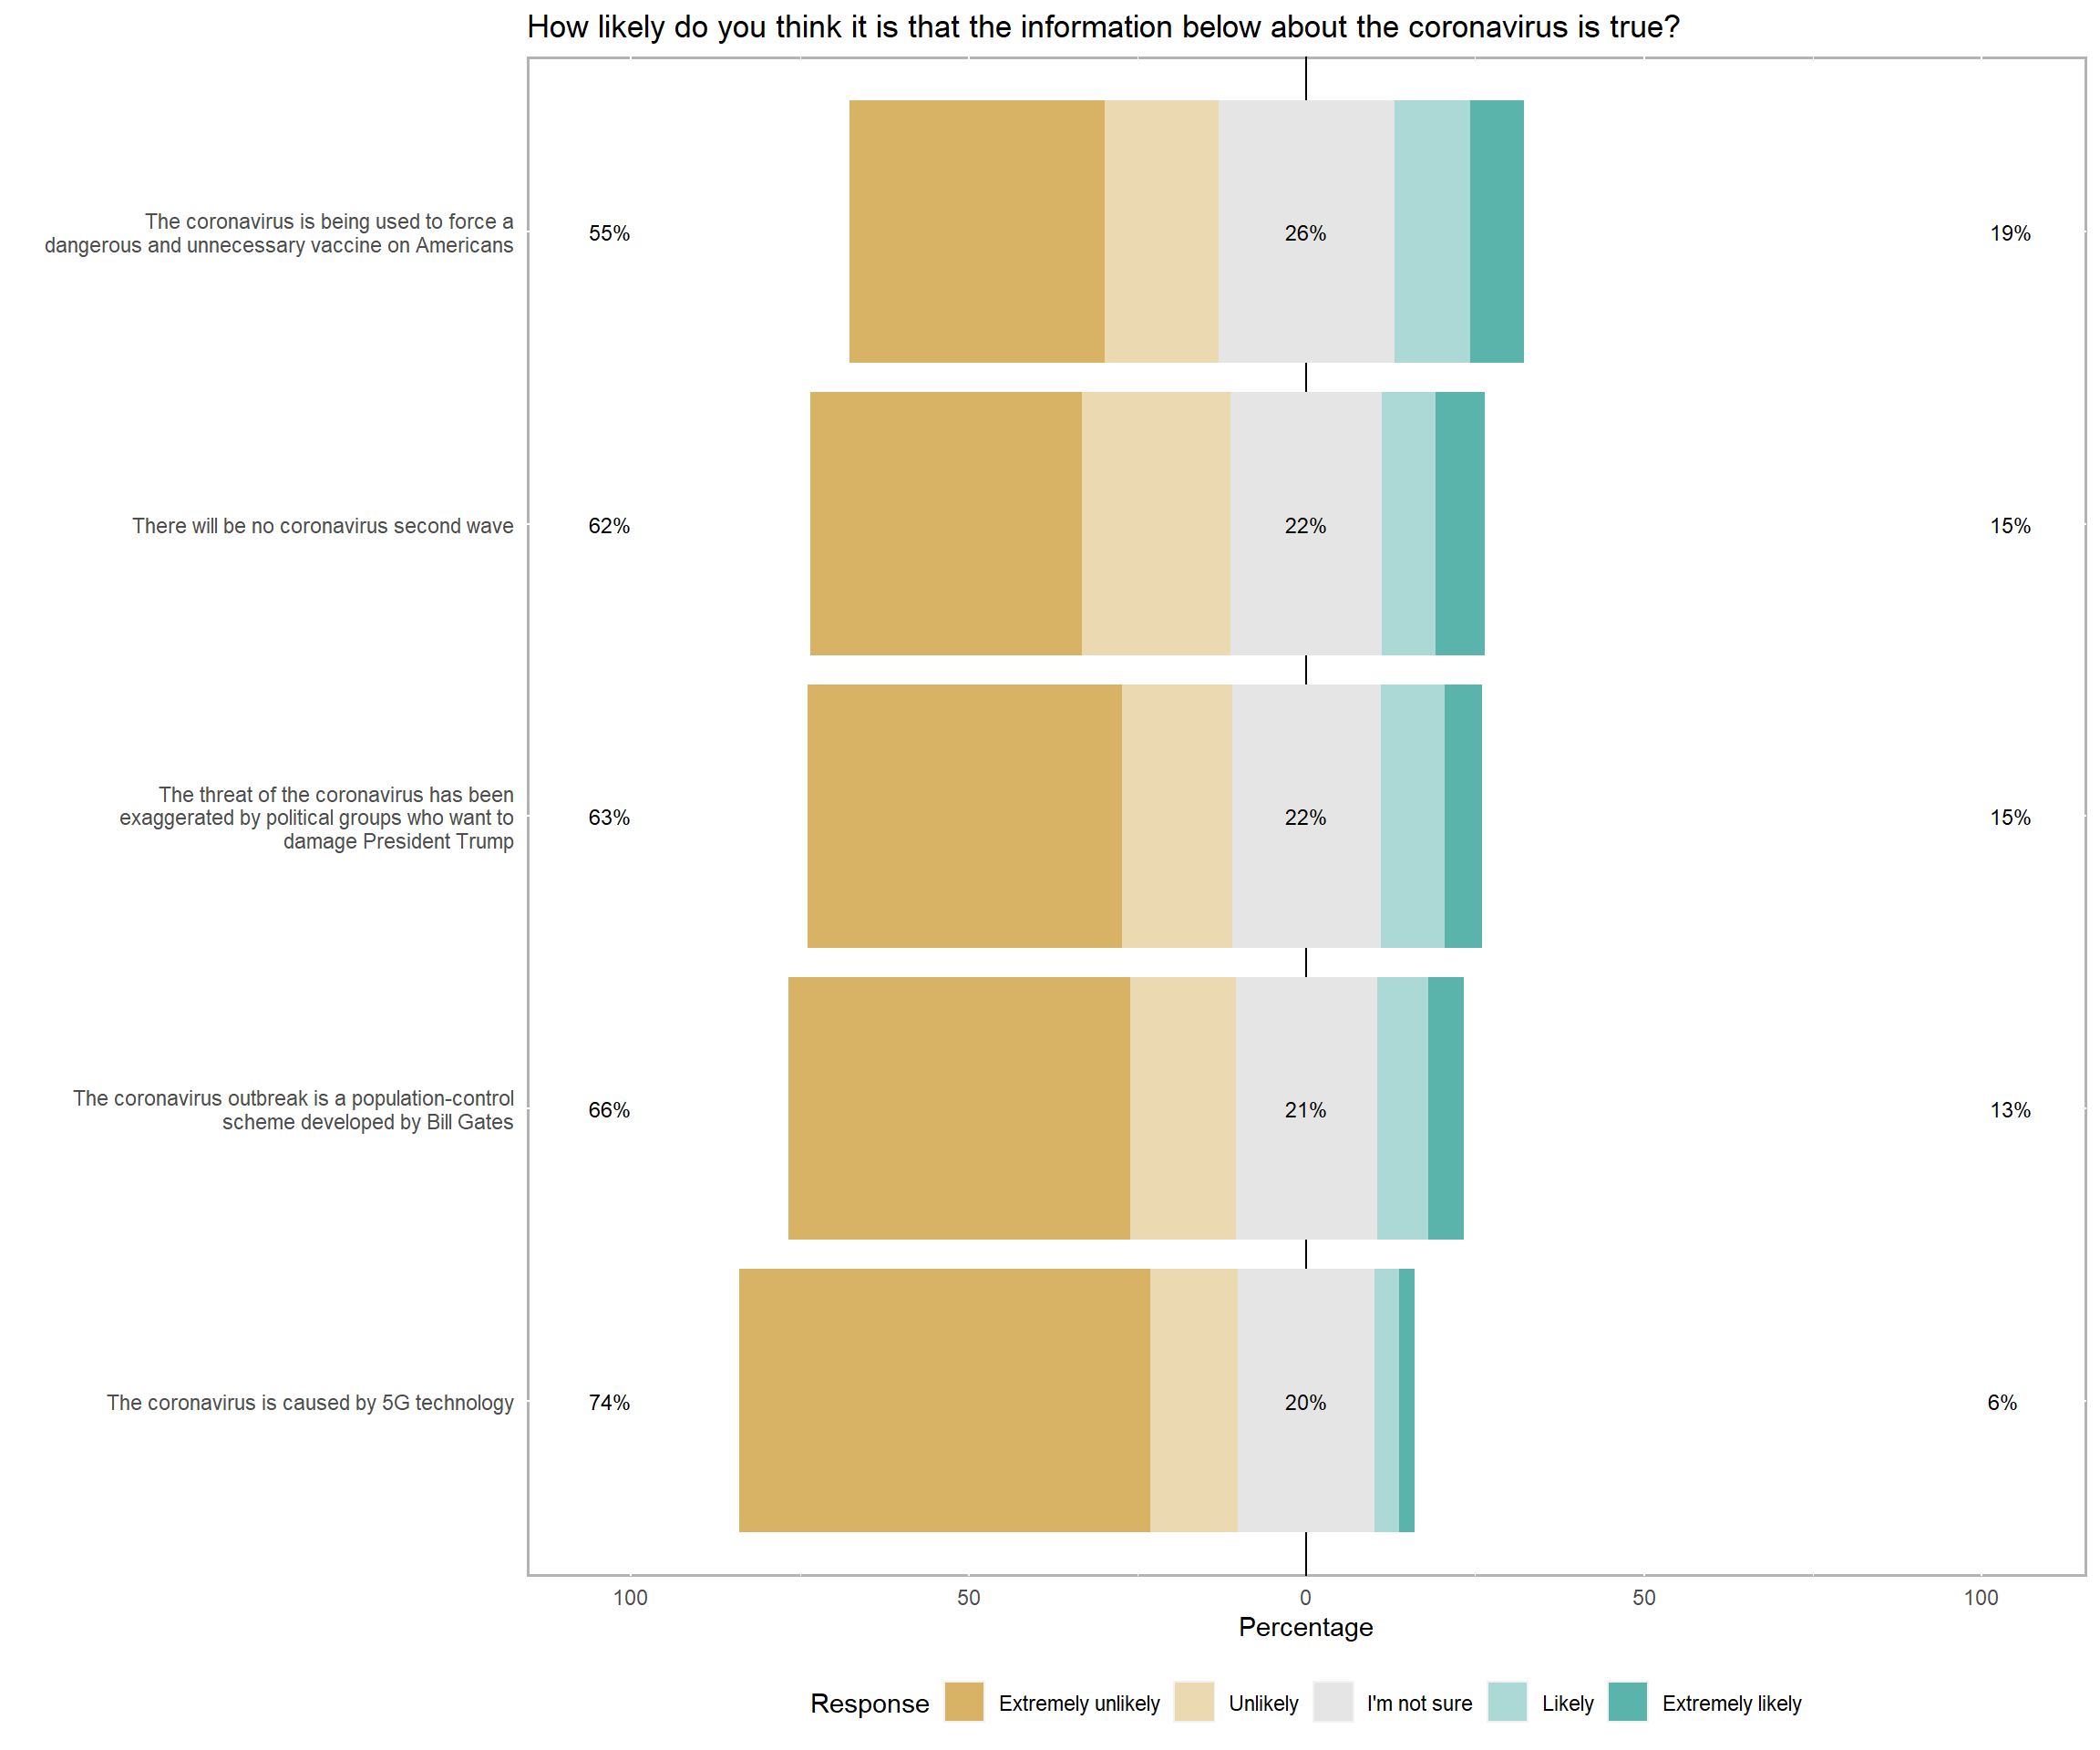
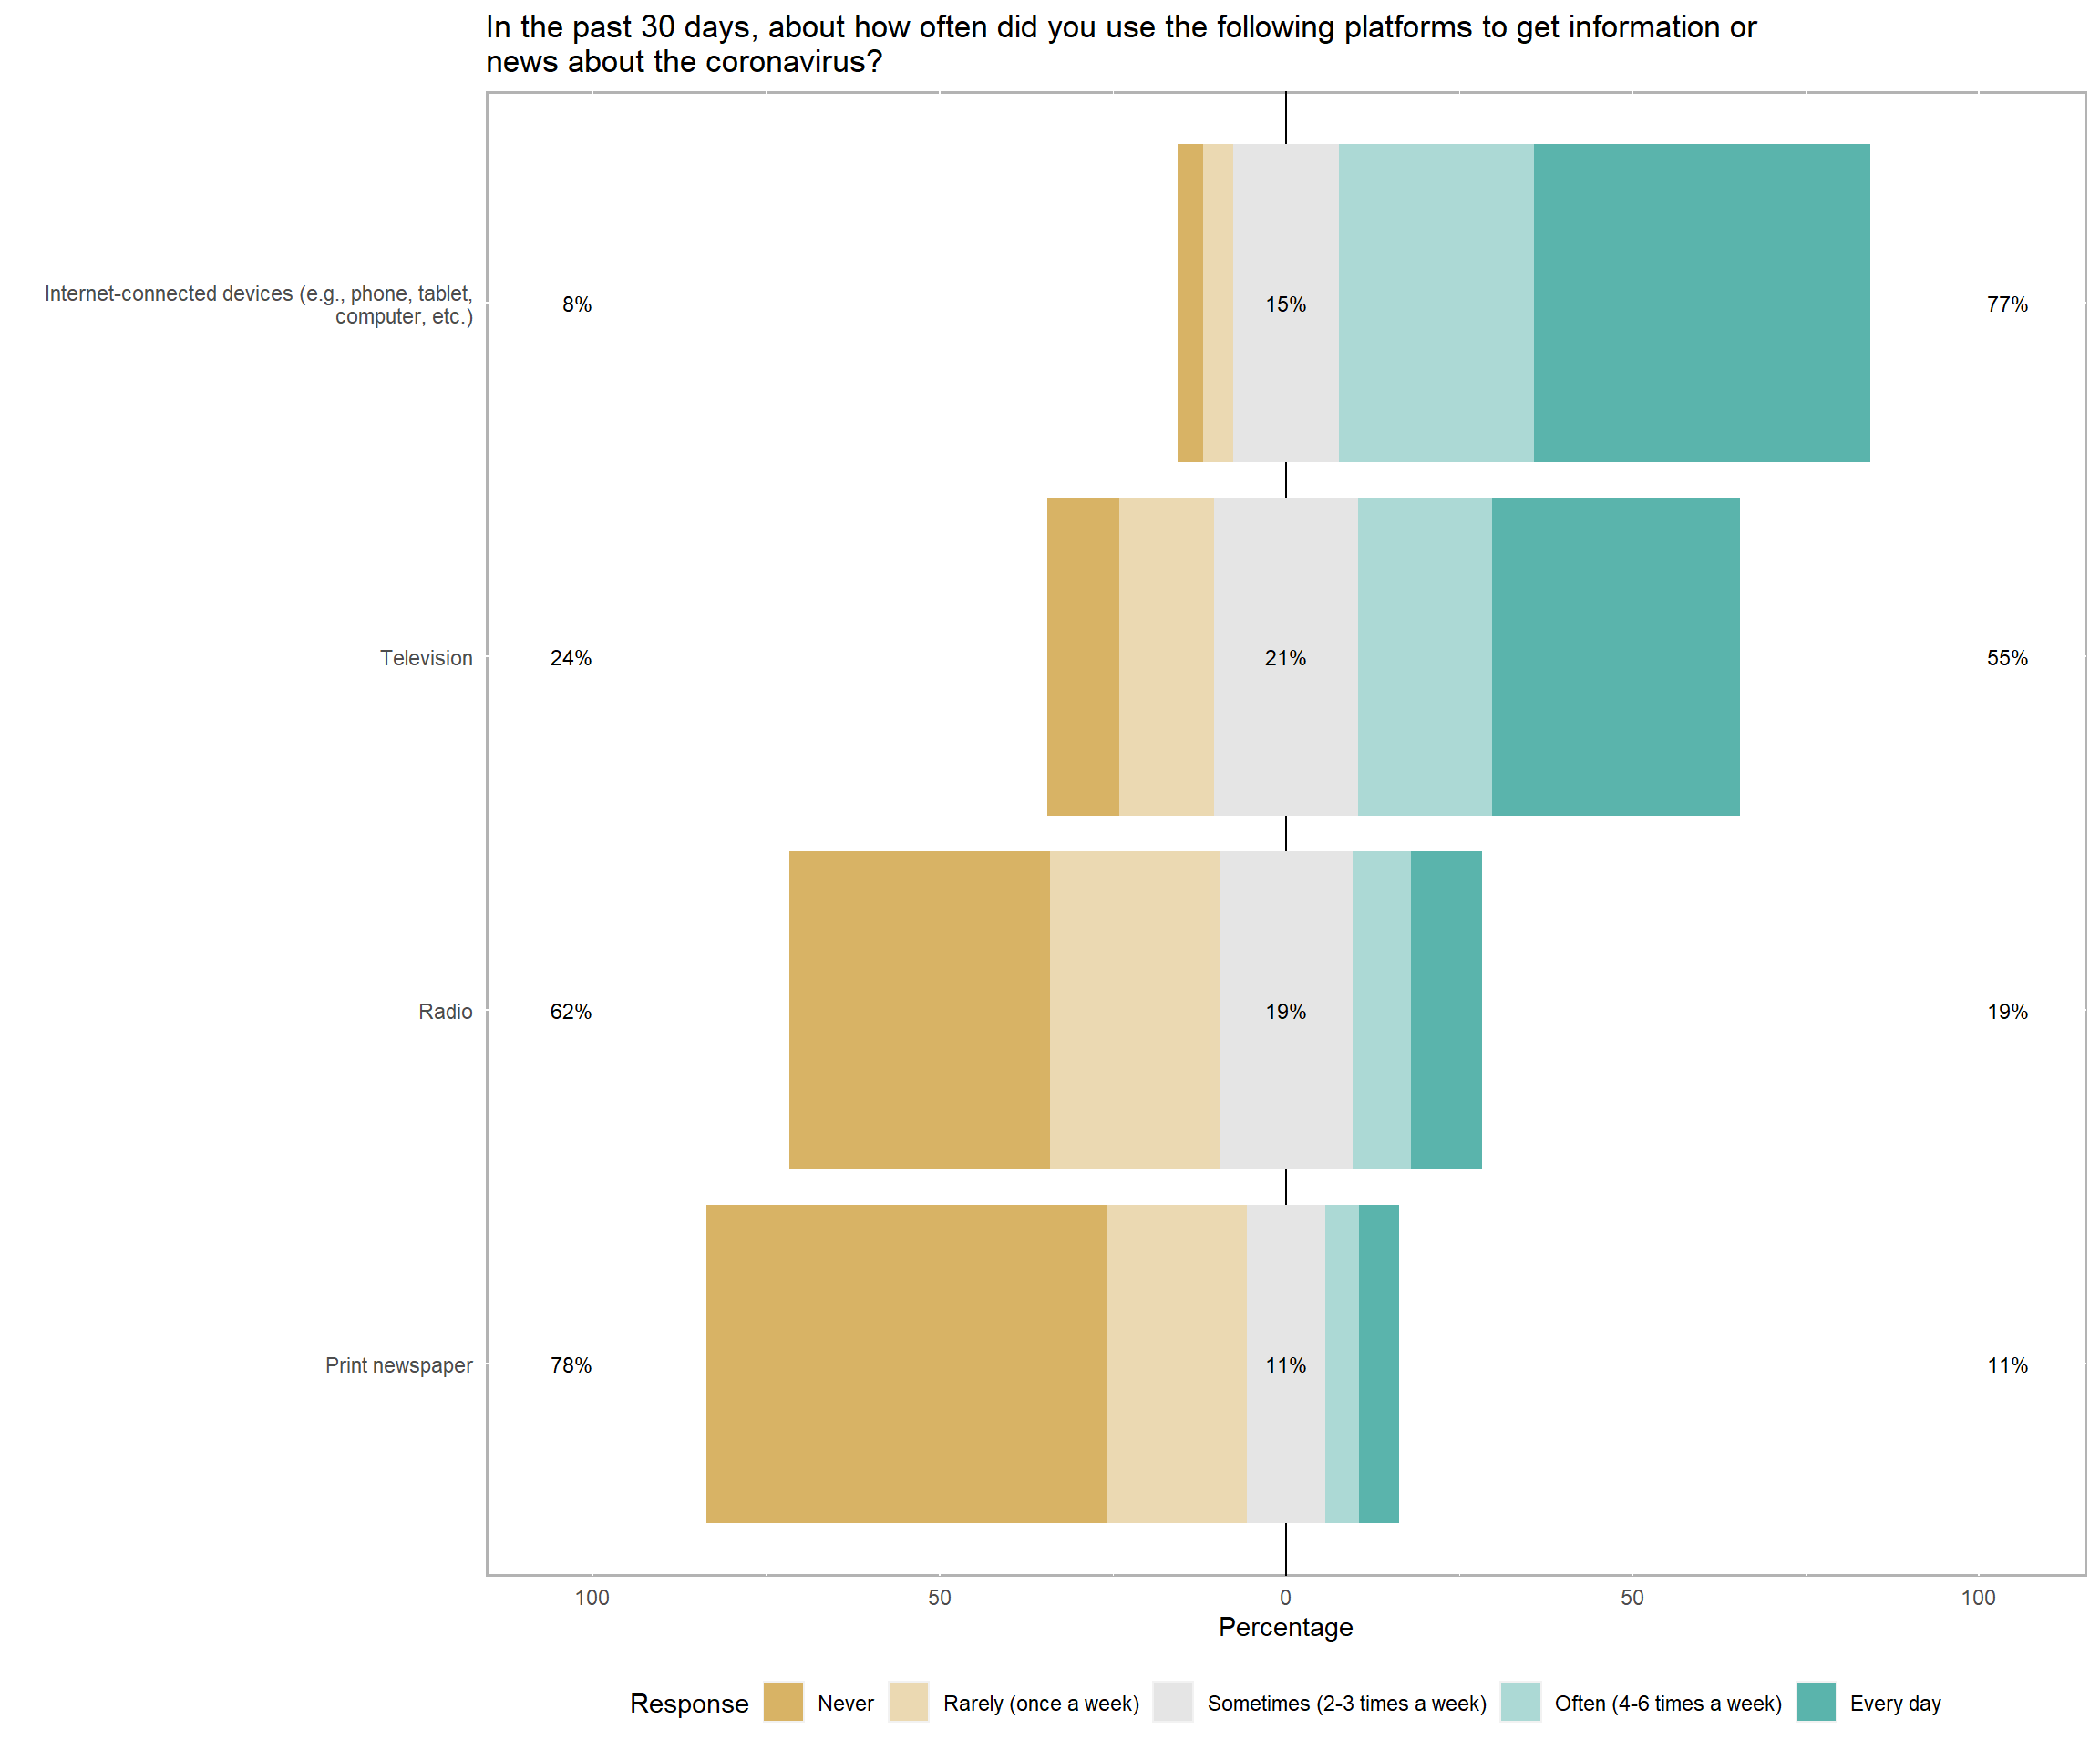
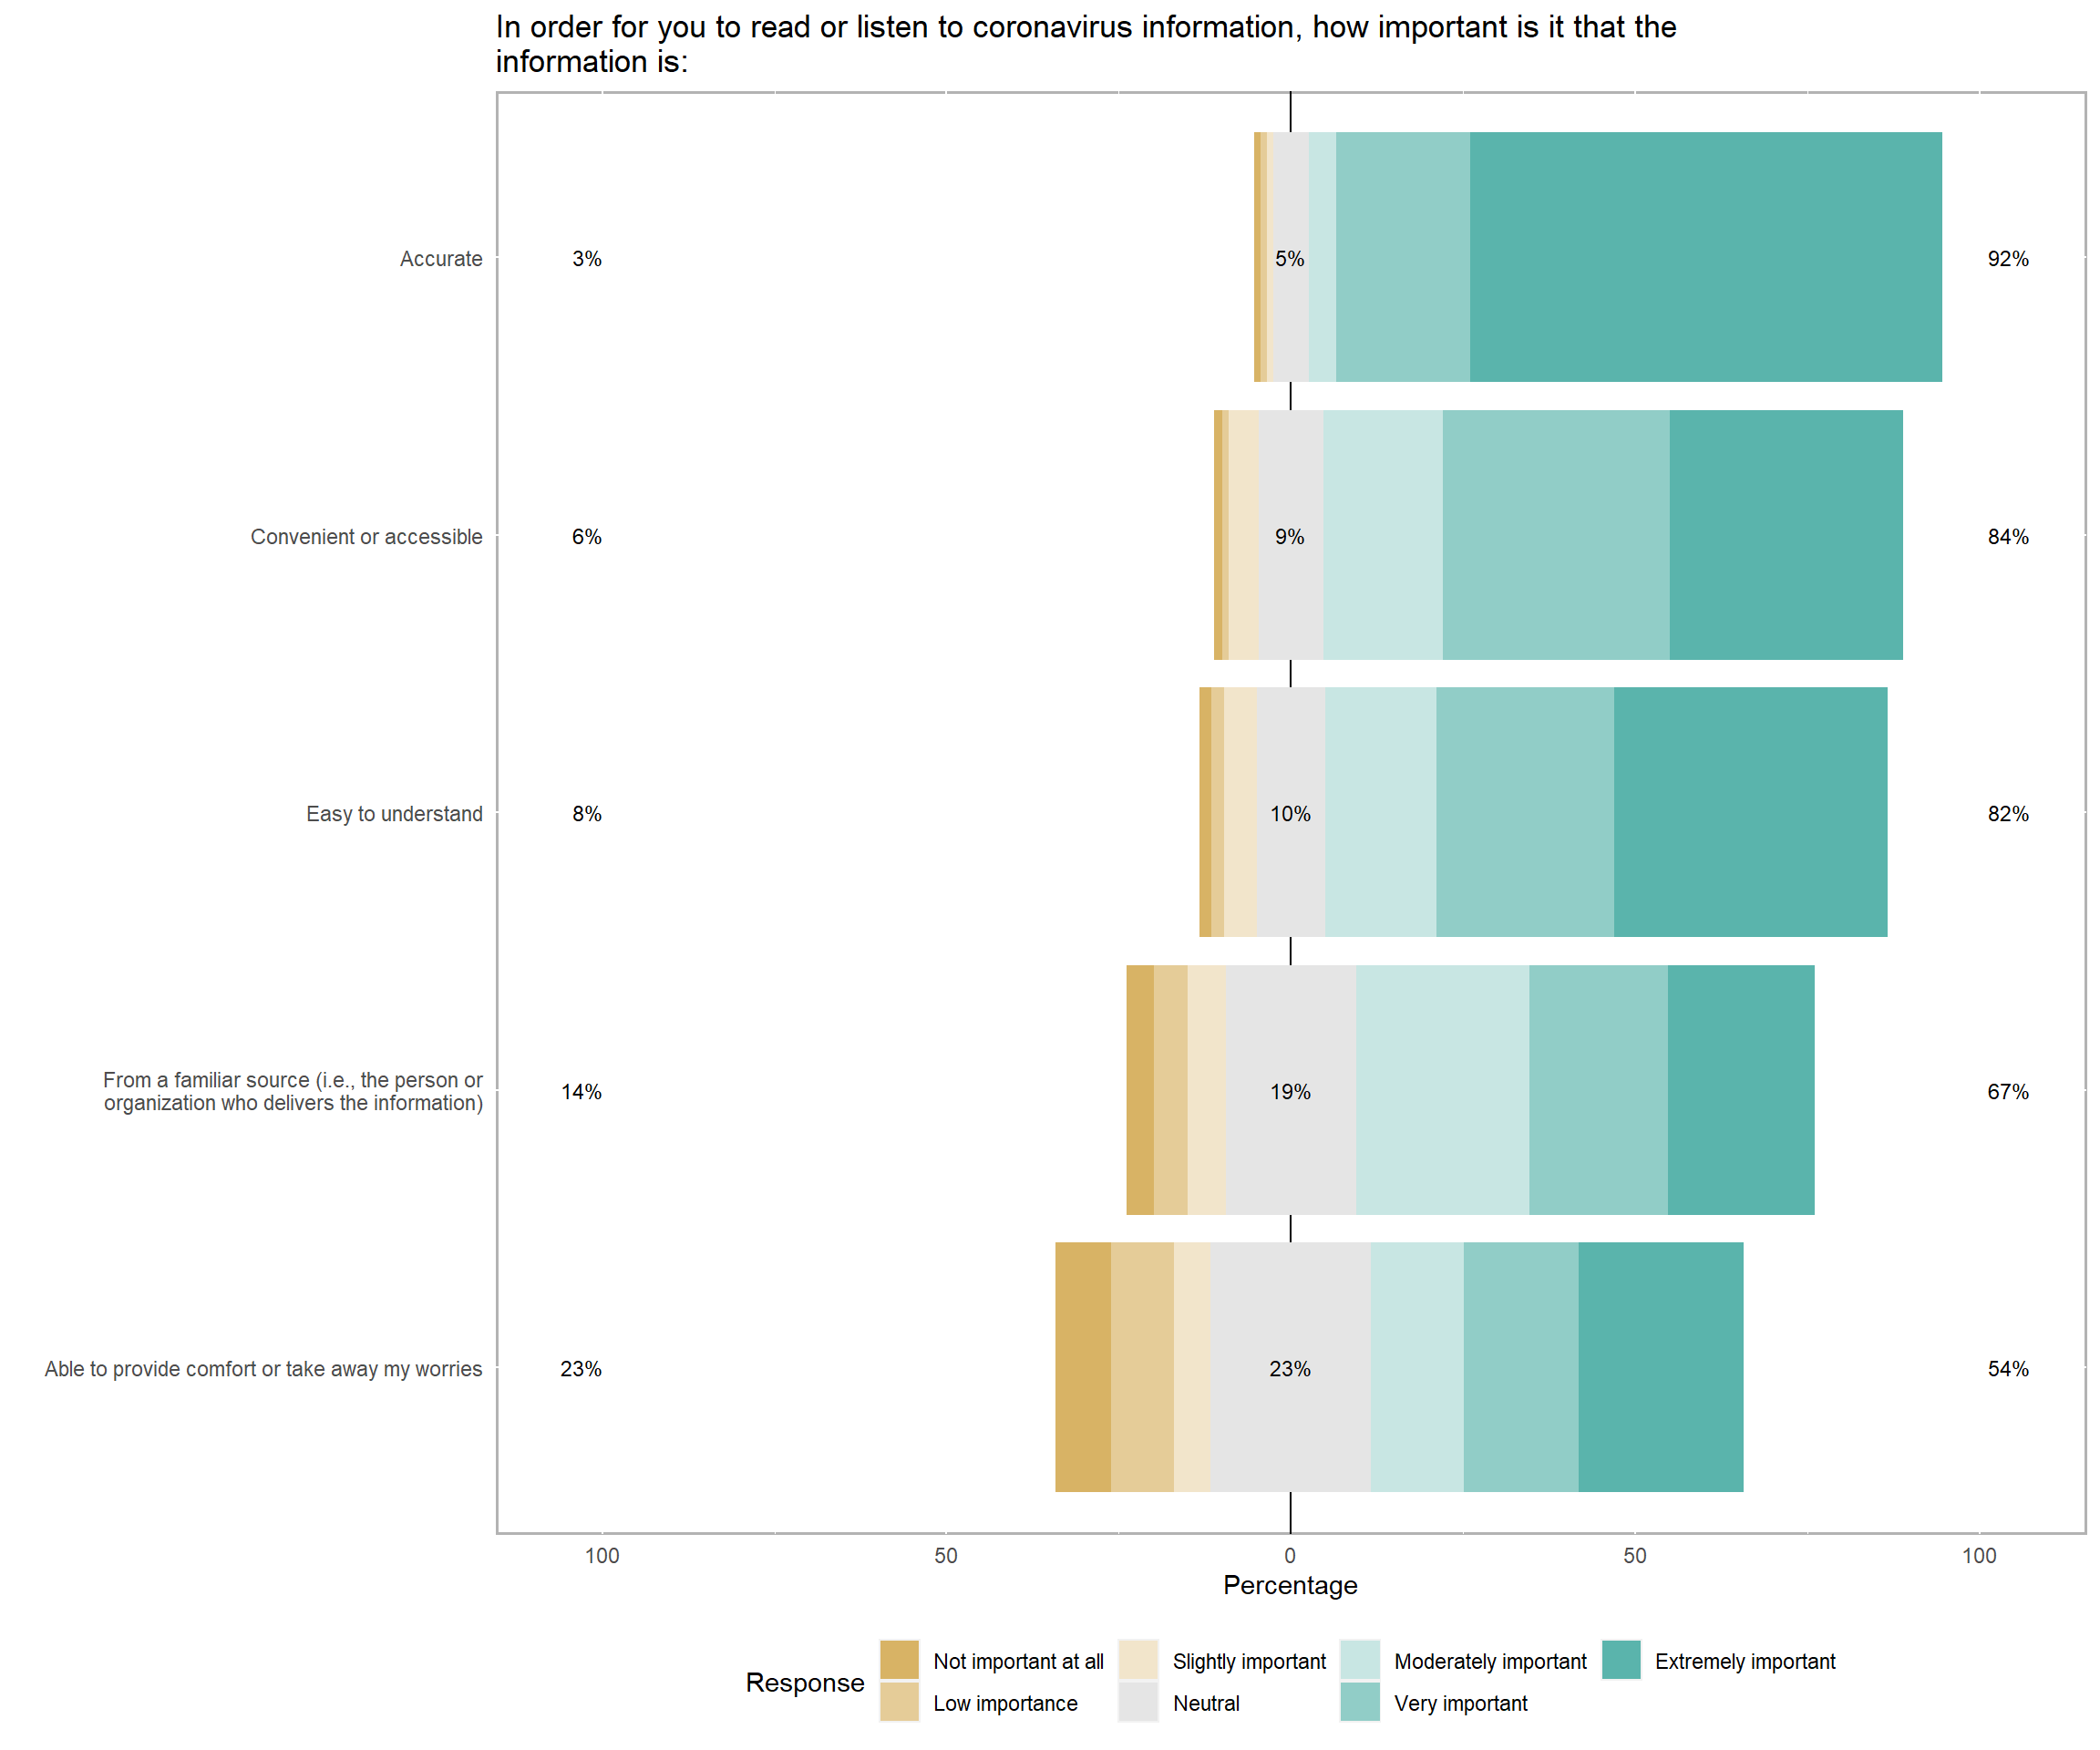
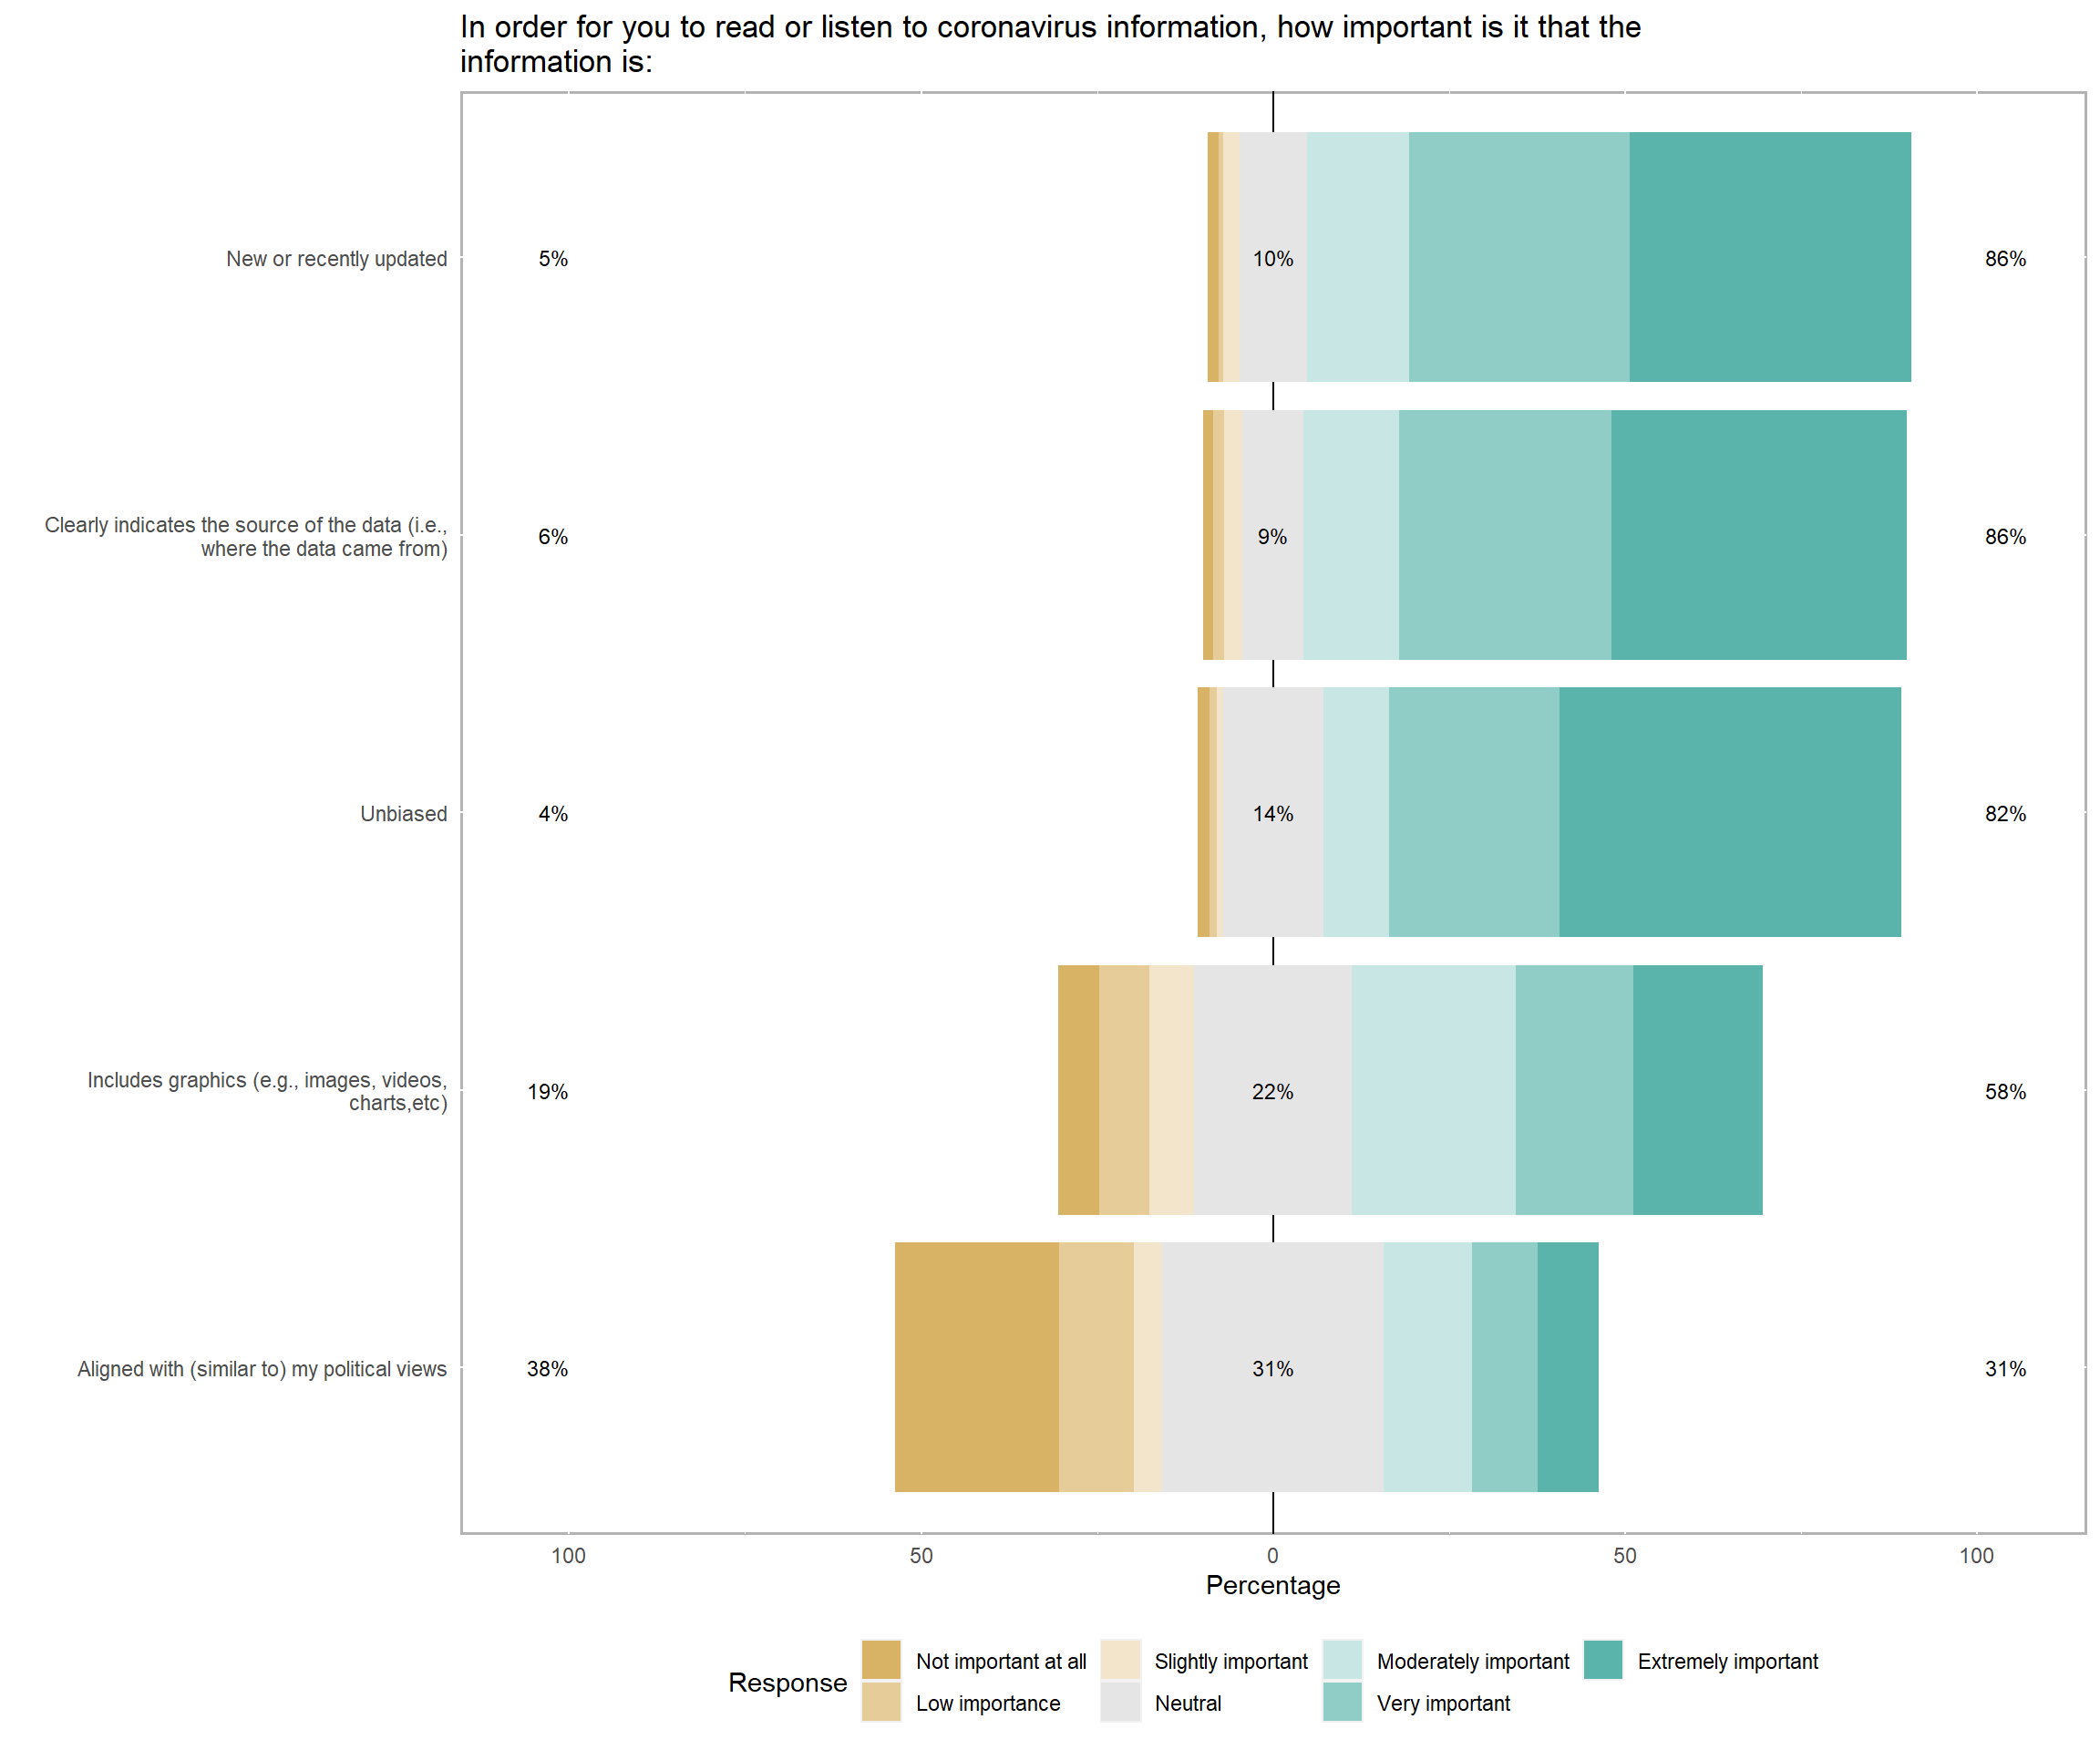
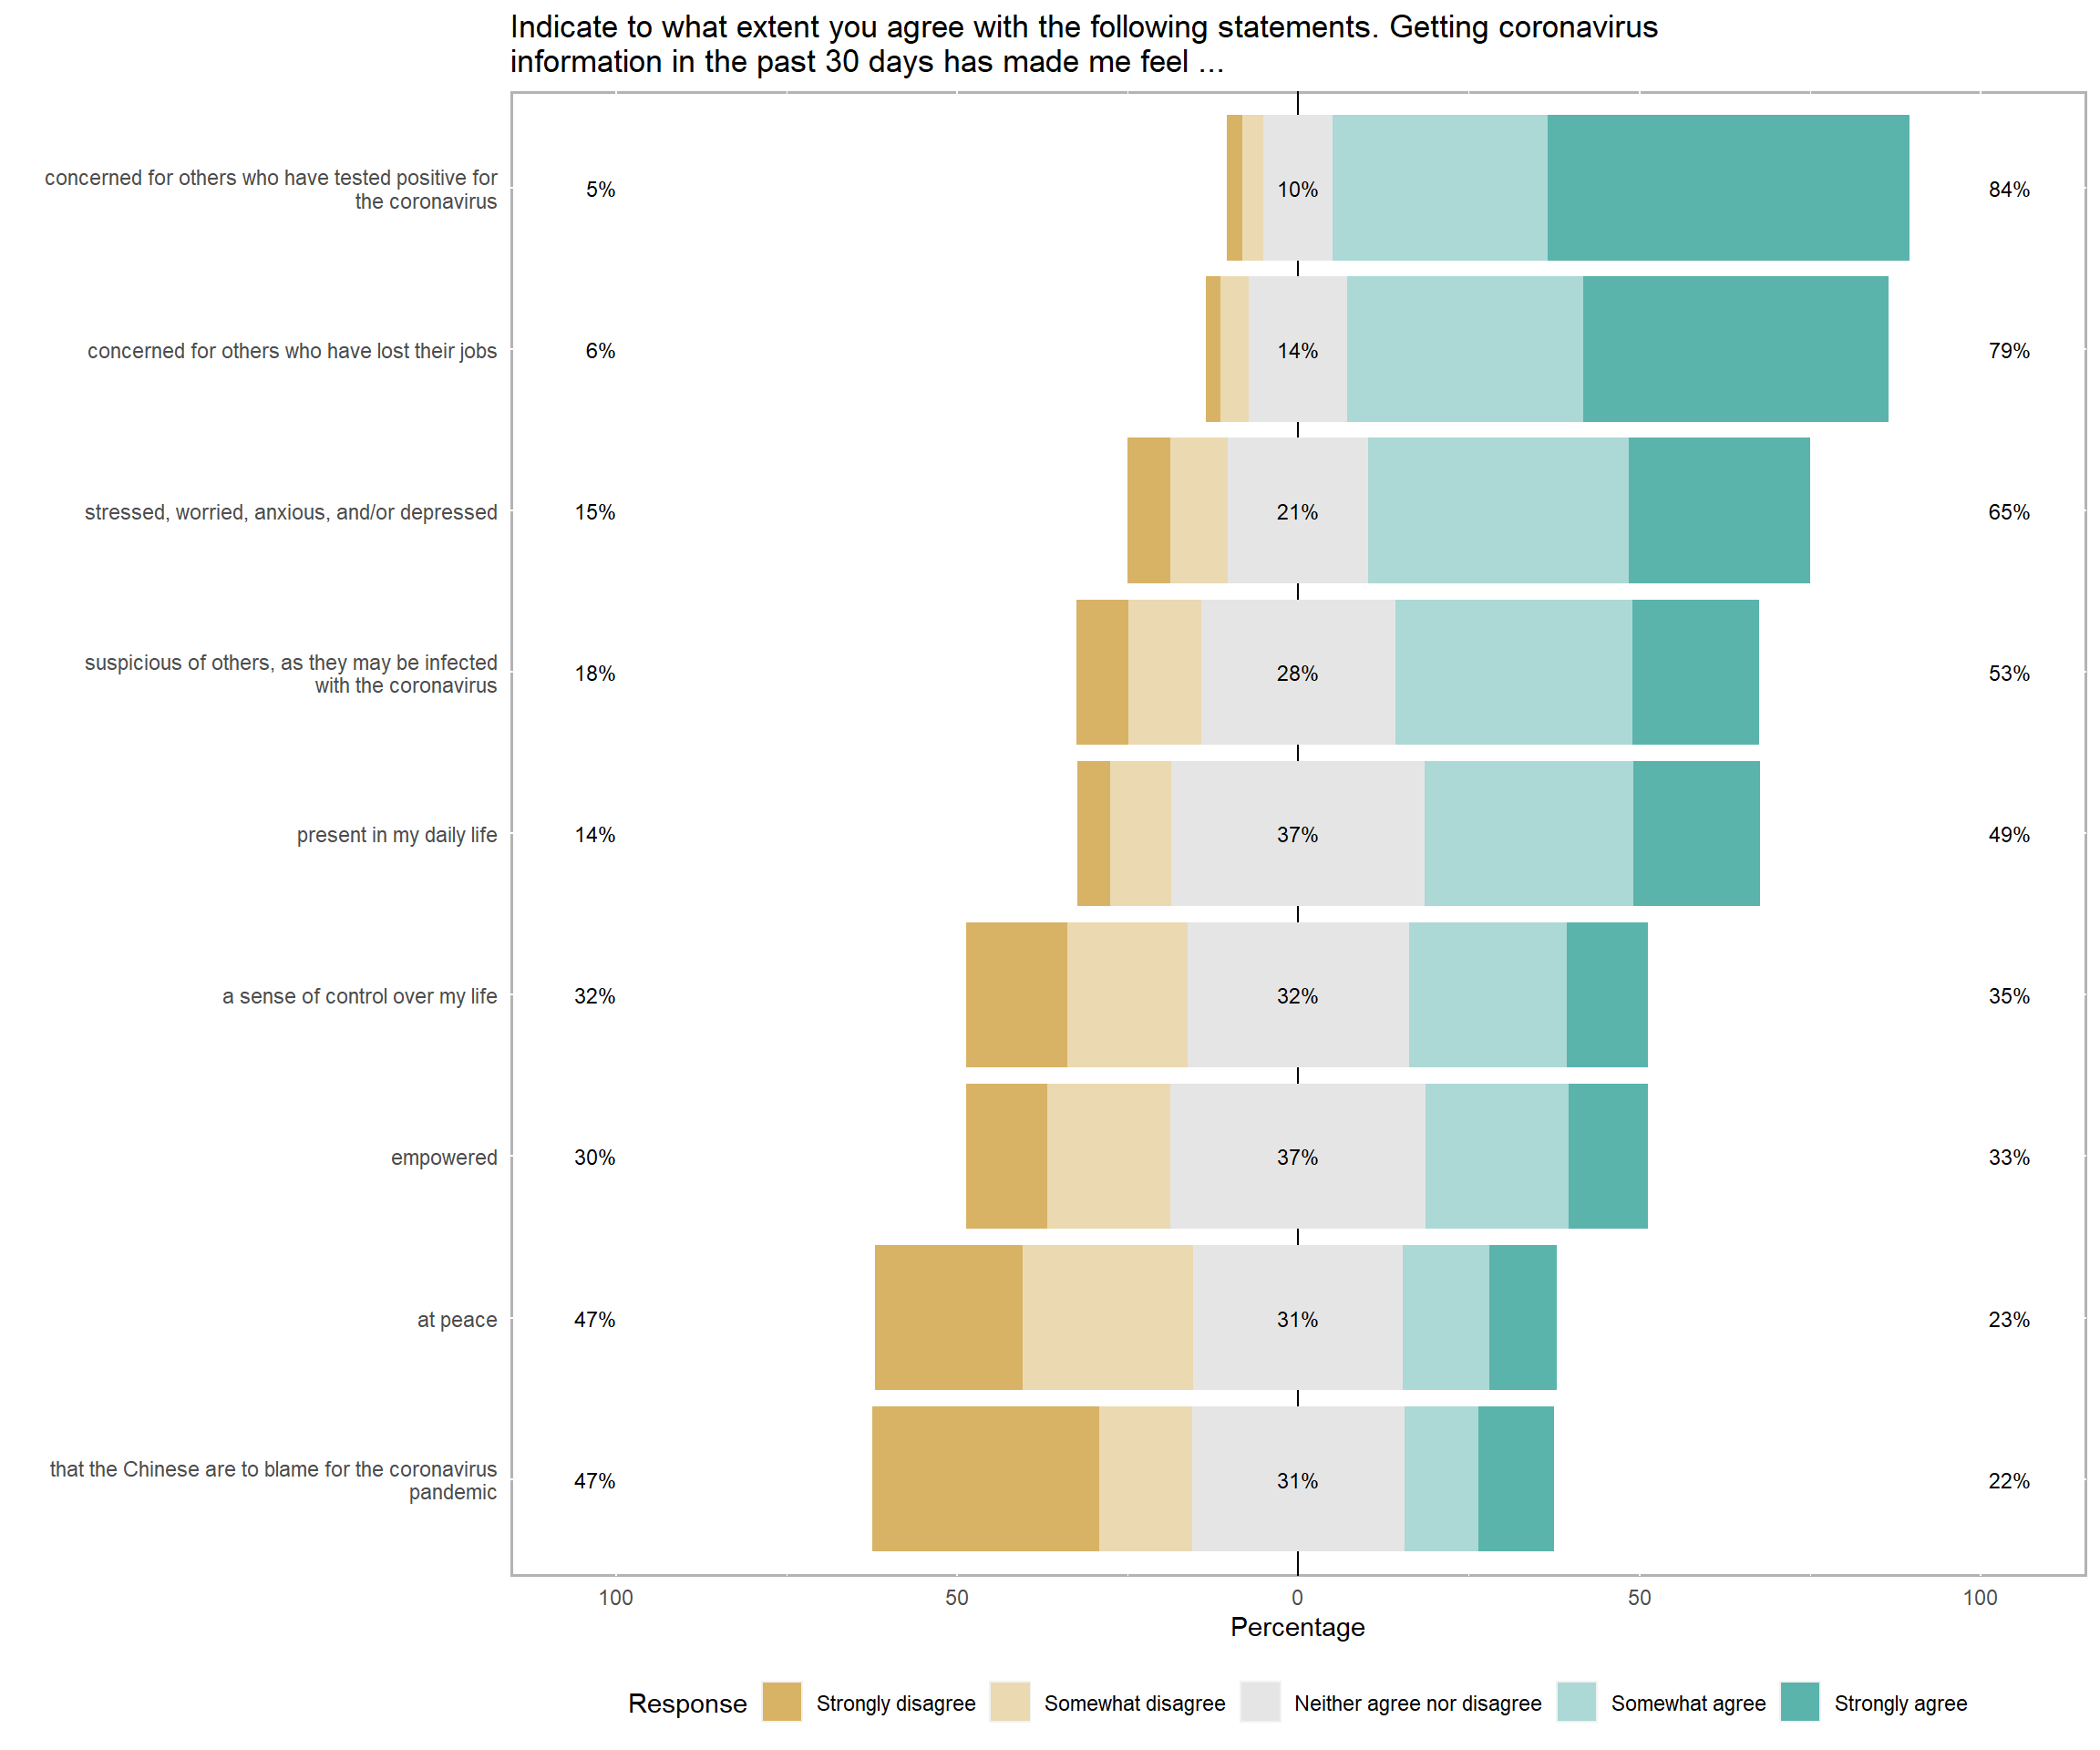
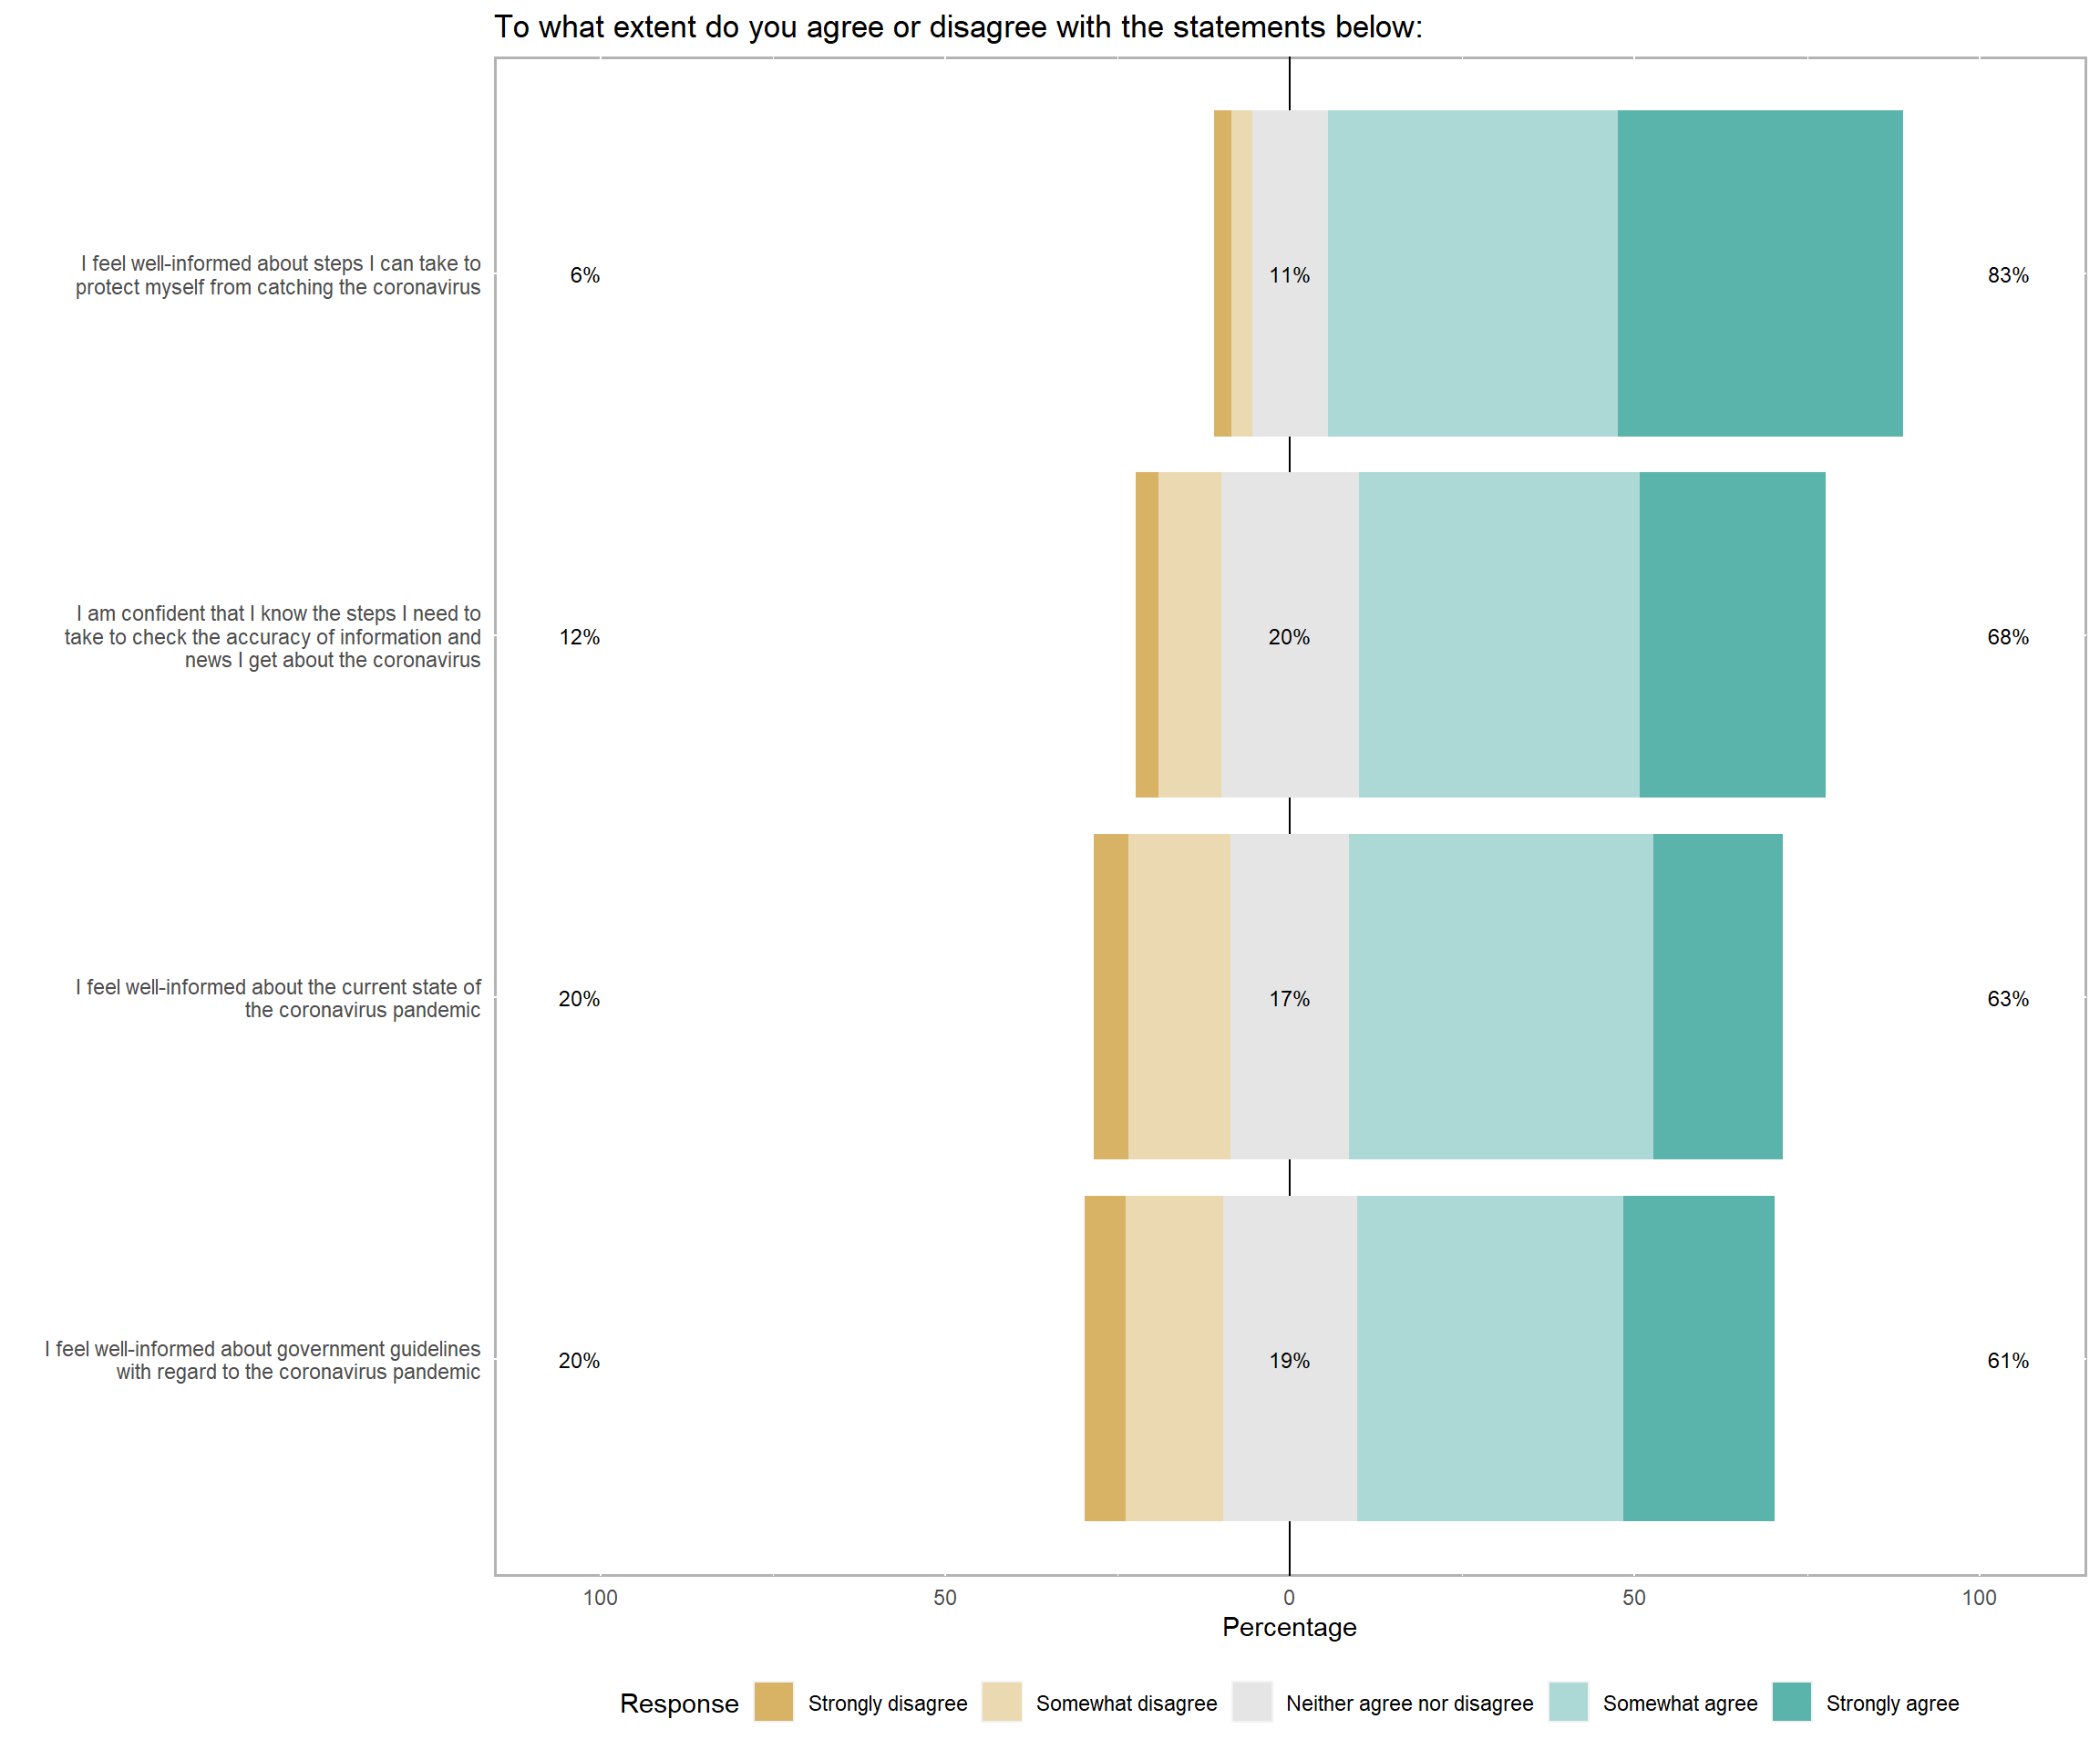
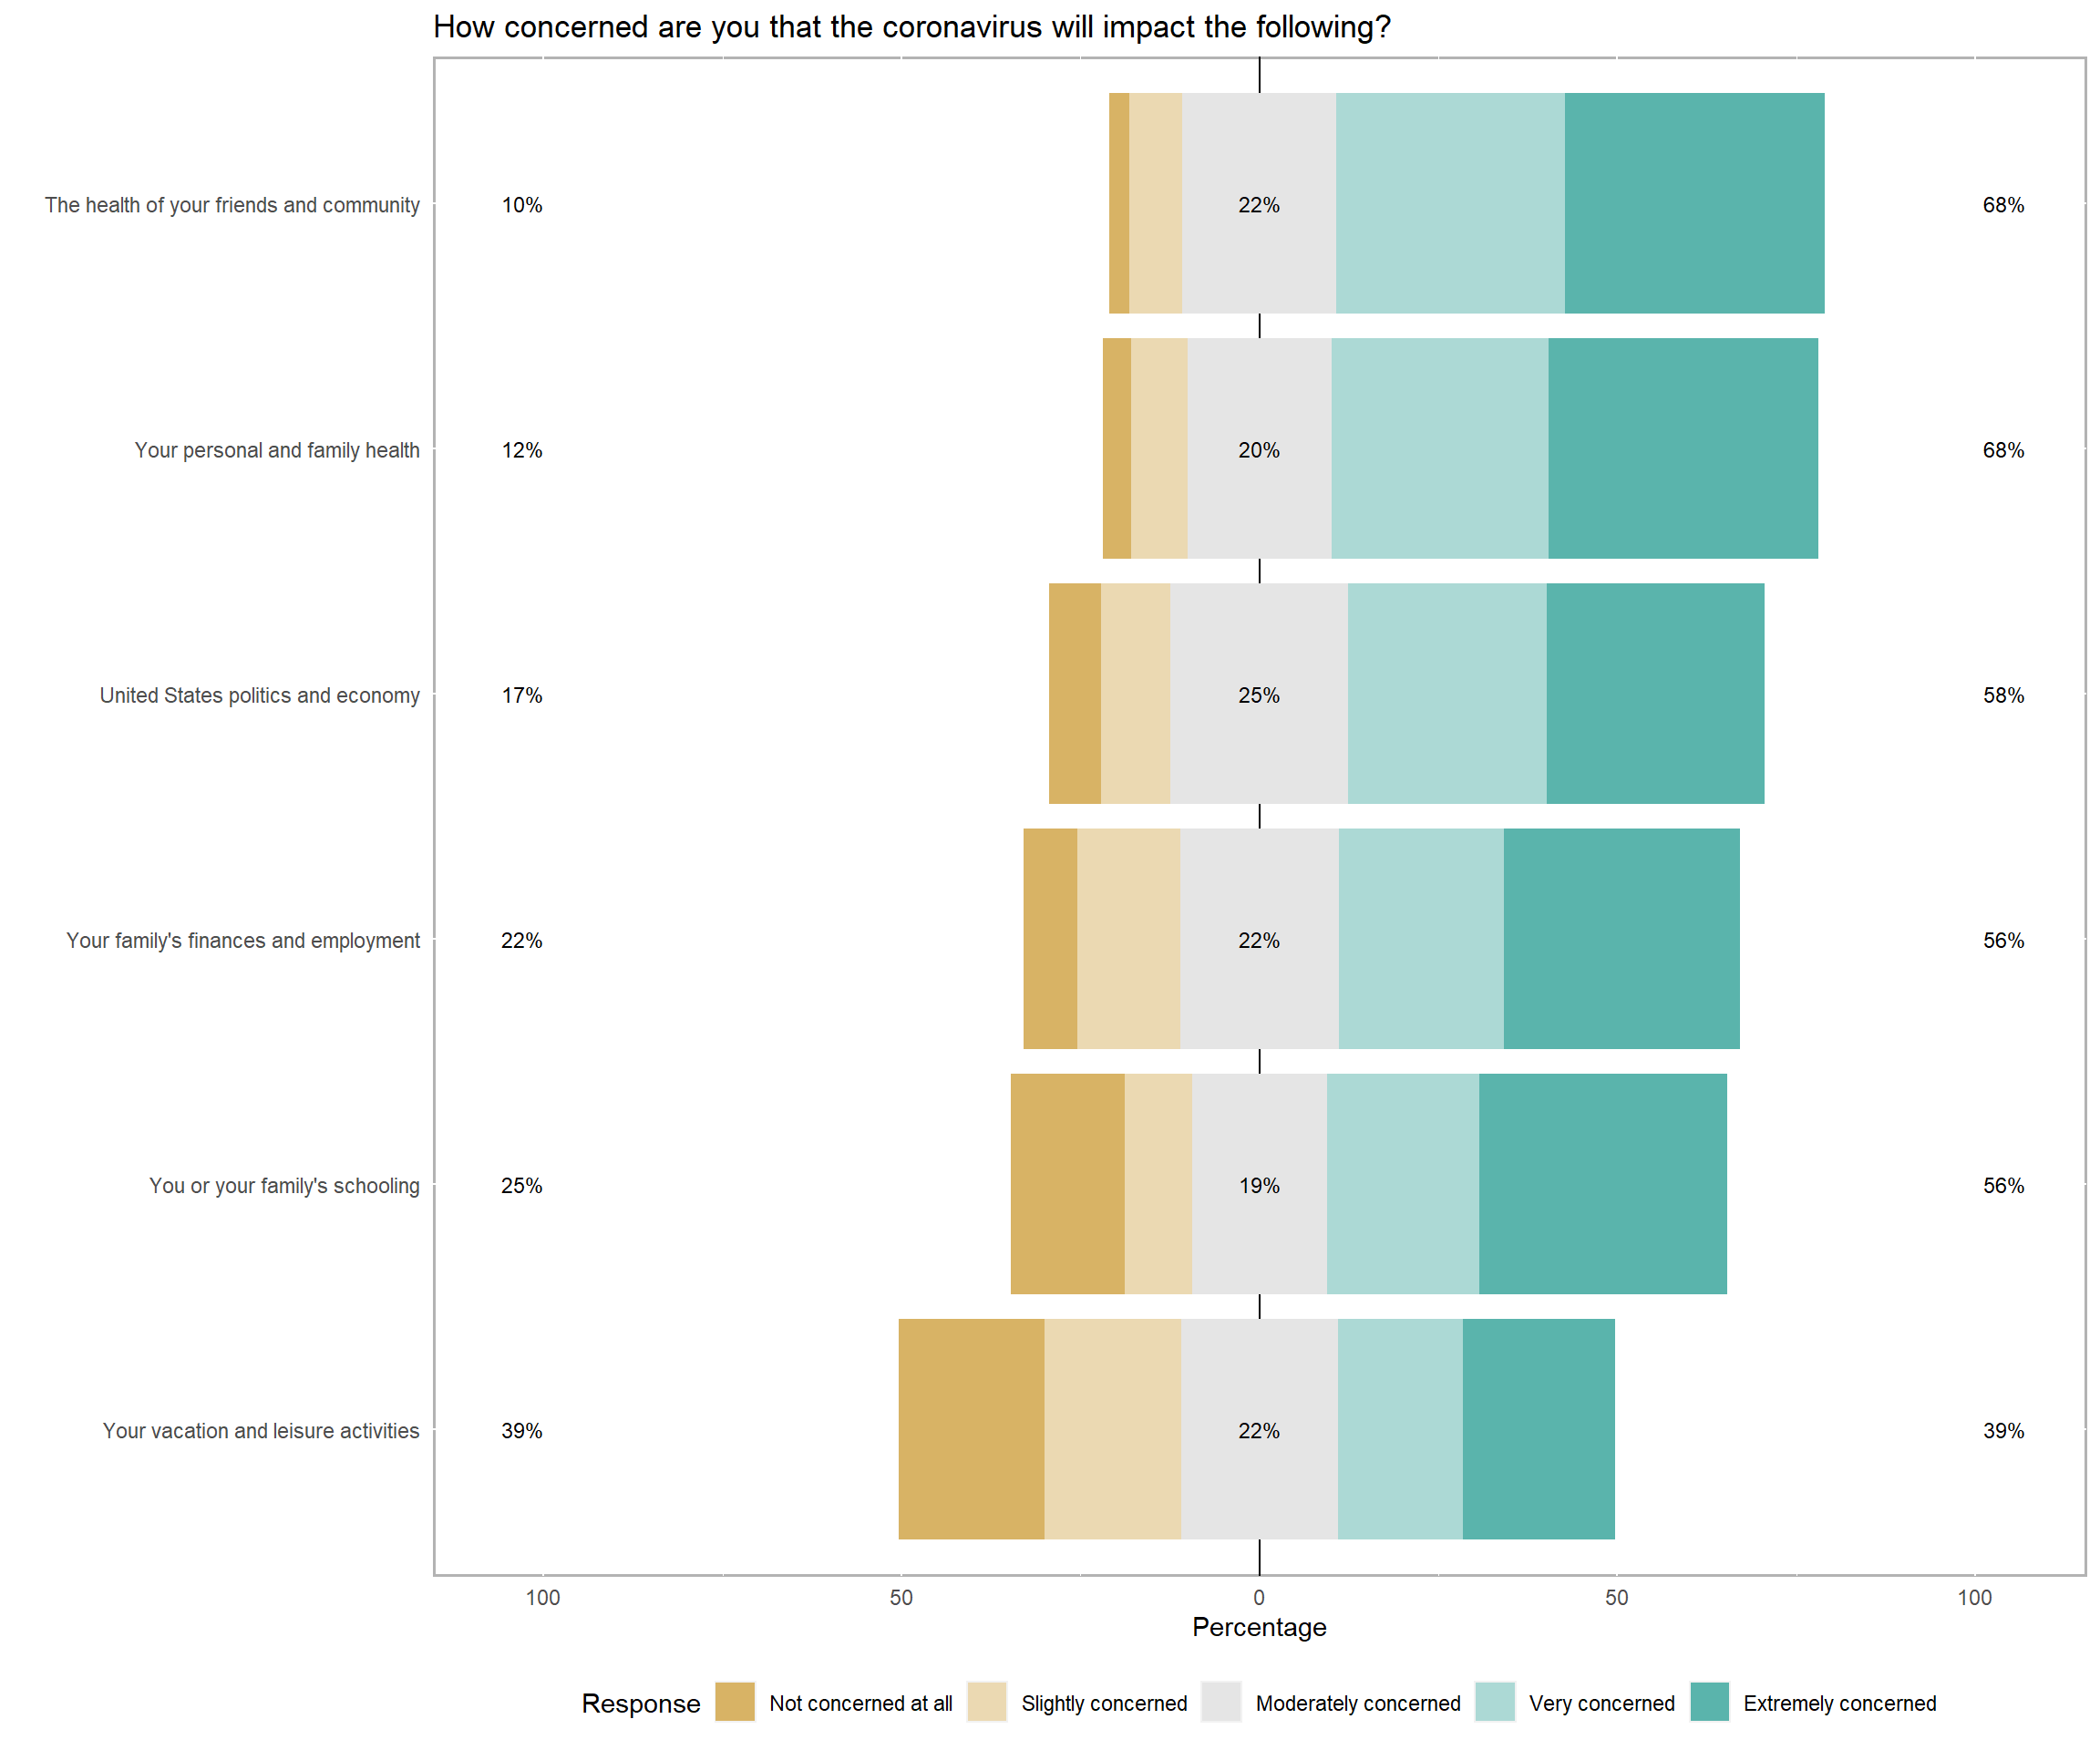
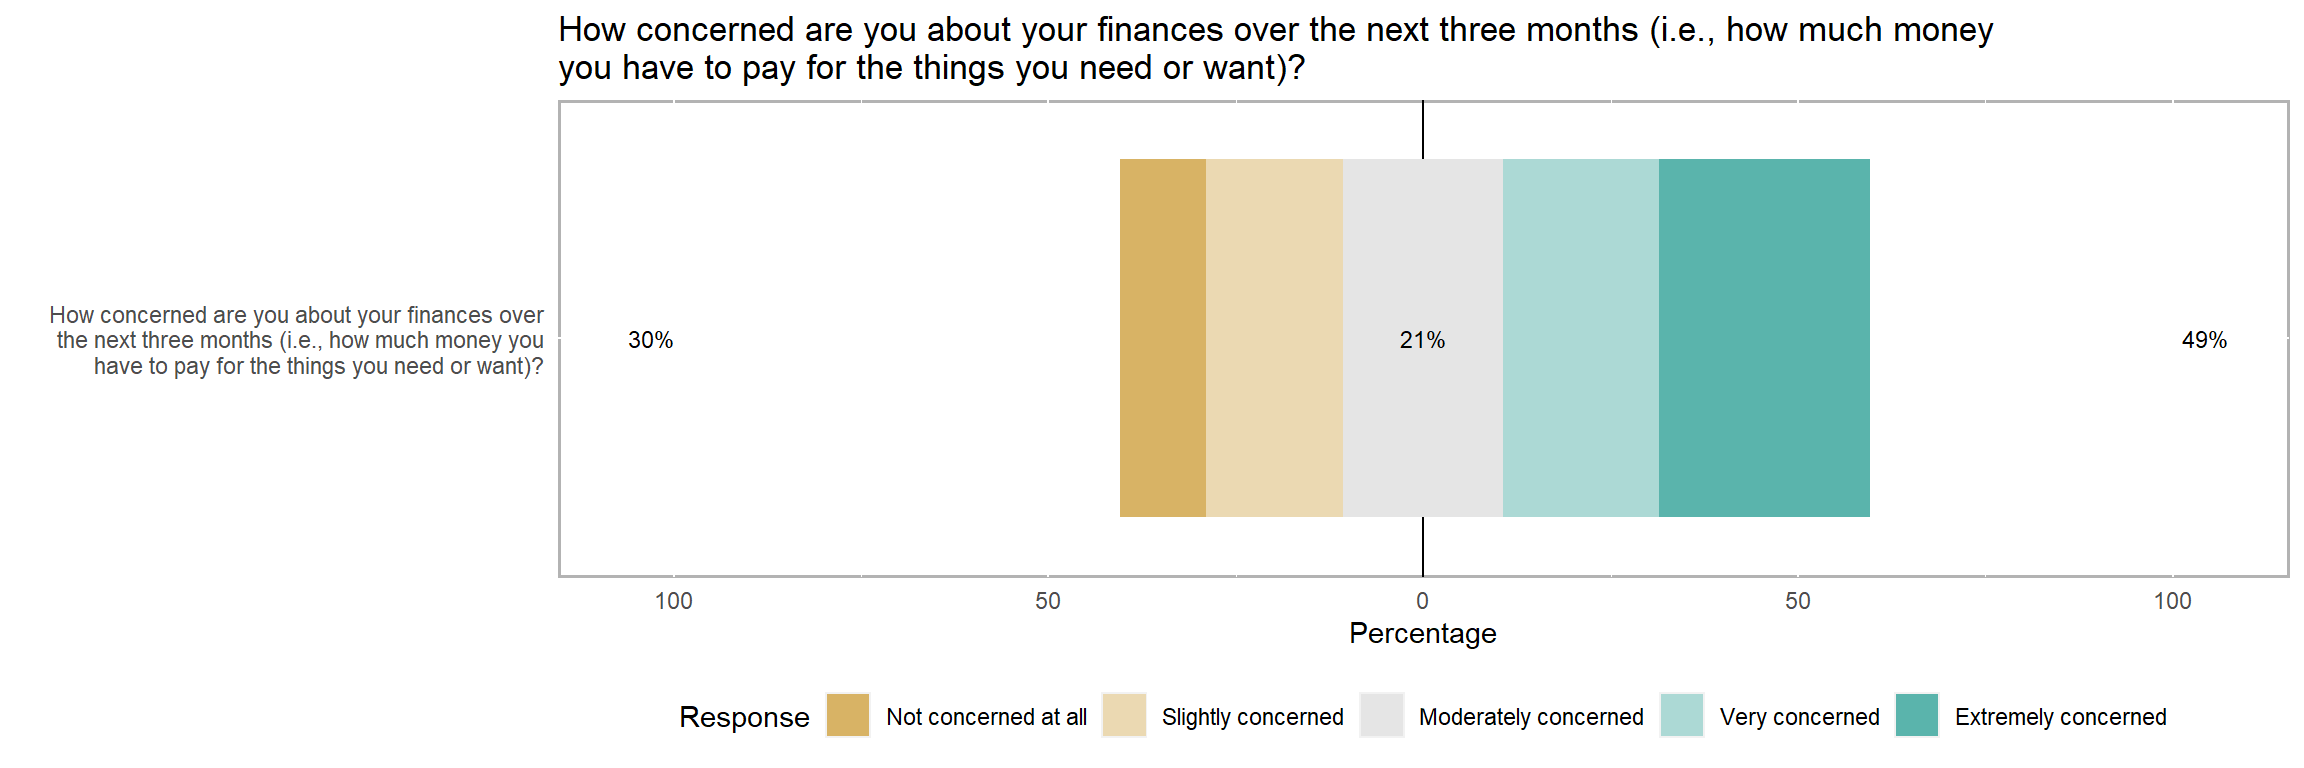
2.3 Likert Questions