Exercise 1
The dataset femalebodyfat.csv gives the % body fat, triceps skinfold thickness (taken at the midpoint of the upperarm) and the midarm circumference (the circumference of the non-dominant arm midway between the shoulder and the elbow) for twenty healthy females aged 20 to 34.
The % body fat for each person was obtained by a cumbersome and expensive procedure requiring the immersion of the person in water. It would therefore be very helpful if a regression model with tricep skinfold thickness and midarm circumference could provide reliable predictions of the amount of body fat, since the measurements needed for the predictor variables are straightforward to obtain.
You should begin as usual by reading in the data:
bf <- read.csv("femalebodyfat.csv")Answer the questions below to find a way to predict the amount of body fat in a 20 to 34 year old woman from her skinfold thickness and midarm circumference:
- Use an appropriate exploratory analysis to explore the relationships between % body fat, triceps skinfold thickness and midarm circumference.
You could use the function pairs(). Use F1 or help(pairs) to see what paramters can be used in the function.
pairs(bf, lower.panel = NULL) 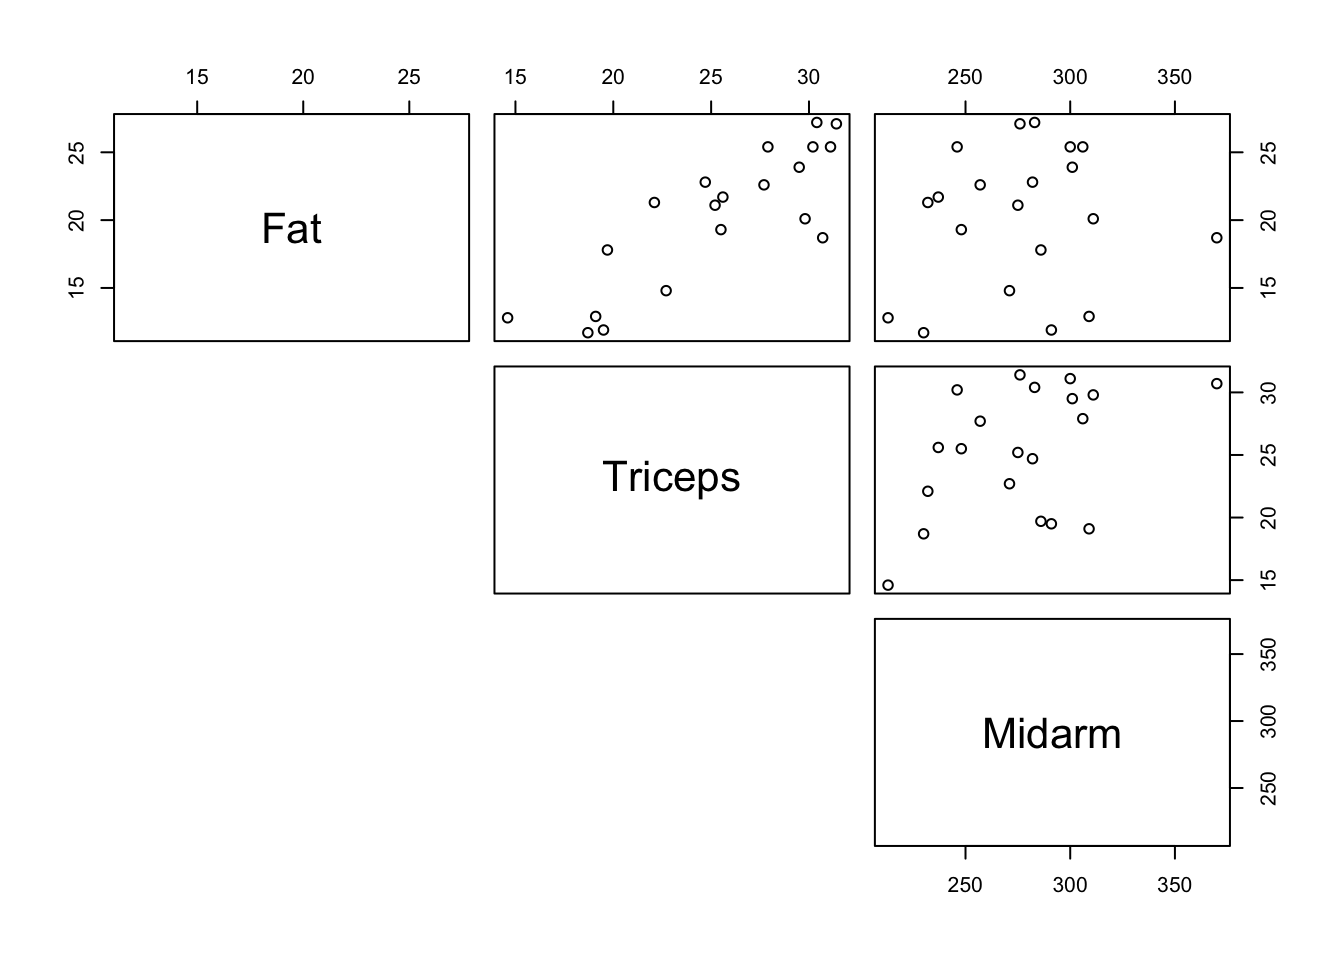
#This shows a moderate positive linear relationship between % body fat and triceps skinfold thickness.
#There doesn't seem to be much of a relationship between % body fat and midarm circumference but we will continue to explore whether it is useful to the model.- Define a multiple linear regression model for the data in order to predict % body fat from triceps skinfold thickness and midarm circumference.
Try an additive model for your data (\(y_1\) ~ \(x_1\) + \(x_2\)).
modelfat <- lm(Fat ~ Triceps+Midarm, data = bf)- Perform the appropriate statistical analysis to comment on the adequacy of your model and choose the correct answers below:
You will need a fiited residual plot and a Q-Q plot for your analysis. You could also look at the \(R^2\) value using Summary(), and the significance of the variables using anova()
plot(rstandard(modelfat) ~ fitted(modelfat))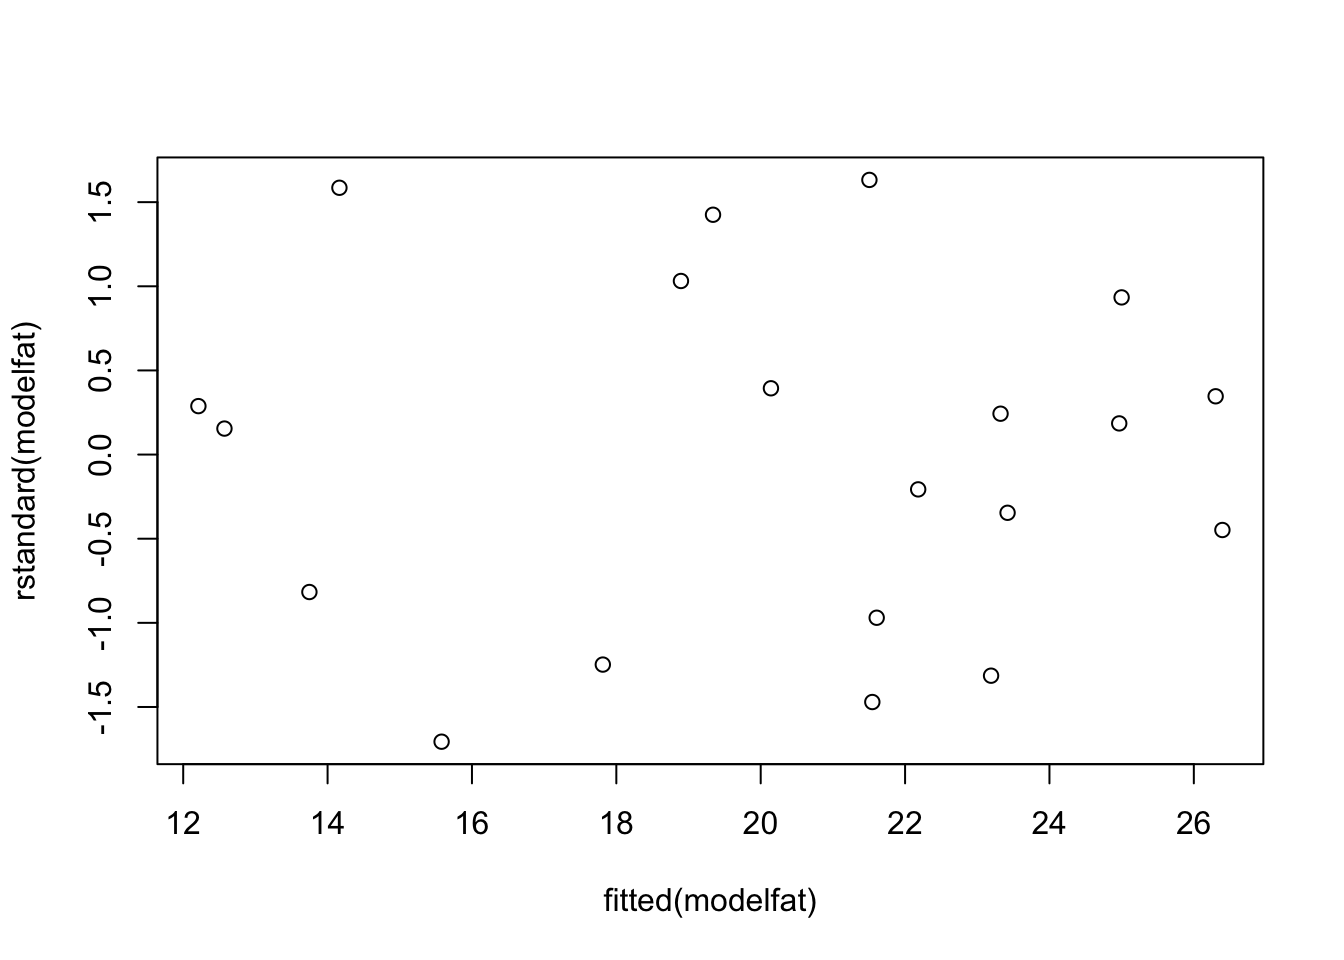
qqnorm(rstandard(modelfat))
qqline(rstandard(modelfat))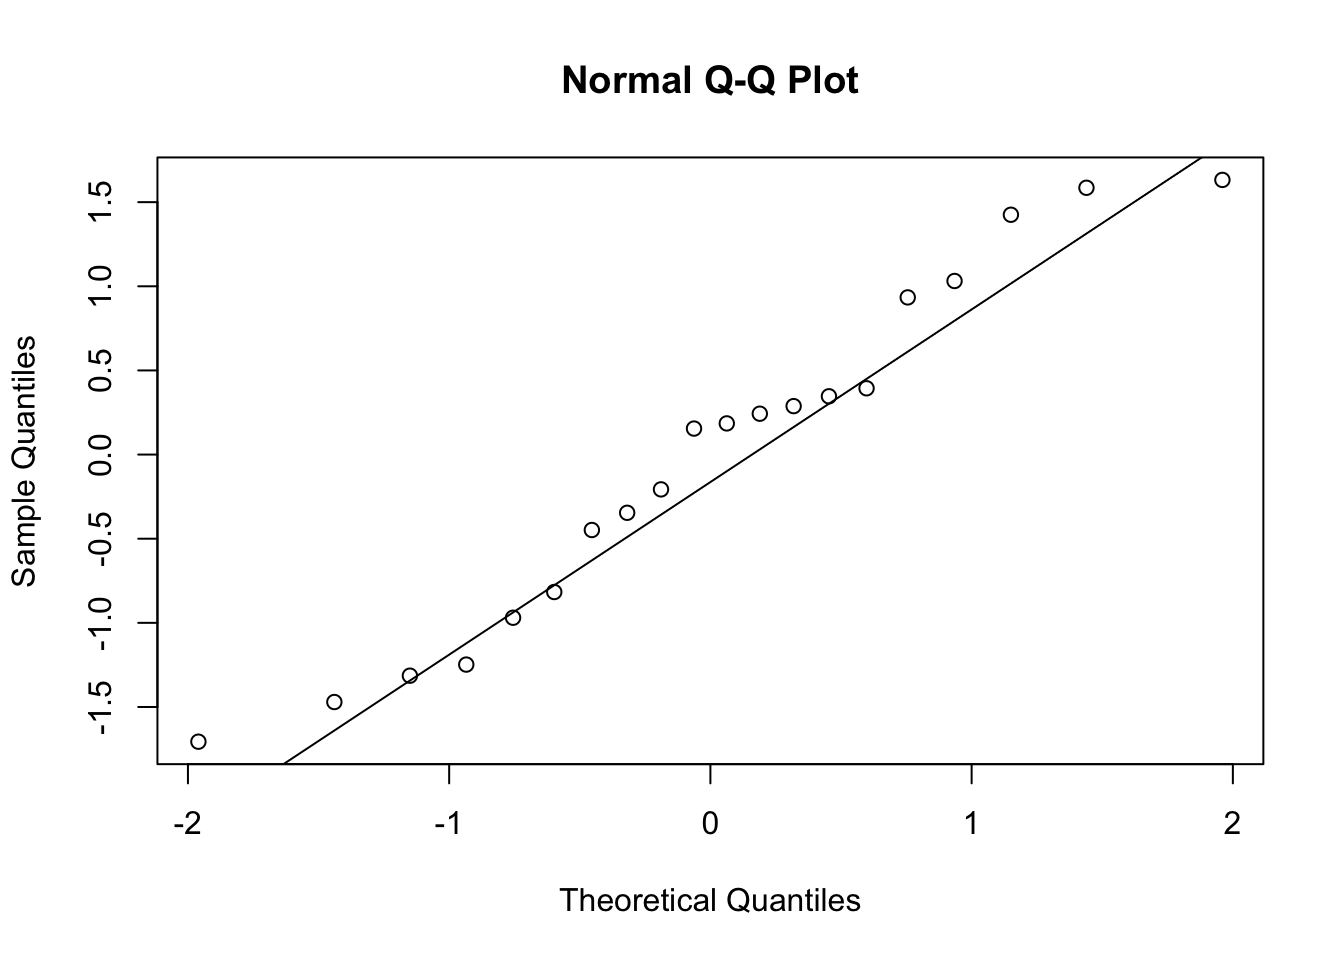
summary(modelfat)##
## Call:
## lm(formula = Fat ~ Triceps + Midarm, data = bf)
##
## Residuals:
## Min 1Q Median 3Q Max
## -3.8794 -1.9627 0.3811 1.2688 3.8942
##
## Coefficients:
## Estimate Std. Error t value Pr(>|t|)
## (Intercept) 6.79163 4.48829 1.513 0.1486
## Triceps 1.00058 0.12823 7.803 5.12e-07 ***
## Midarm -0.04314 0.01766 -2.443 0.0258 *
## ---
## Signif. codes: 0 '***' 0.001 '**' 0.01 '*' 0.05 '.' 0.1 ' ' 1
##
## Residual standard error: 2.496 on 17 degrees of freedom
## Multiple R-squared: 0.7862, Adjusted R-squared: 0.761
## F-statistic: 31.25 on 2 and 17 DF, p-value: 2.022e-06anova(modelfat)## Analysis of Variance Table
##
## Response: Fat
## Df Sum Sq Mean Sq F value Pr(>F)
## Triceps 1 352.27 352.27 56.5312 8.406e-07 ***
## Midarm 1 37.19 37.19 5.9674 0.02579 *
## Residuals 17 105.93 6.23
## ---
## Signif. codes: 0 '***' 0.001 '**' 0.01 '*' 0.05 '.' 0.1 ' ' 1The residual vs fitted values plot shows that the points fairly evenly scattered above and below the, which suggests it reasonable to assume that the random errors have mean equal to . The vertical variation of the points also seems to be reasonable.
In the normal probability plot, we see that points exactly lie on diagonal line. This indicates that the Normality assumption be perfectly satisfied.
The \(R^2\) value is which high enough to mean the model is appropriate fit.
The \(p\) values for the predictor variables are both than 0.005 so have a significant effect on the response .
- Use R to compute a 95% confidence interval for the coefficient of each predictor in the model.
You can use the confint() function on the model to get a confidence interval for both predictors
confint(modelfat)## 2.5 % 97.5 %
## (Intercept) -2.67783060 16.261085426
## Triceps 0.73003885 1.271130967
## Midarm -0.08040683 -0.005881575- Comment on your intervals.
The confidence interval for the variable 'triceps' contain zero so it we conclude that it make a statistically significant contribution in addition to the predictor 'midarm' in explaining the variability in 'body fat'. Therefore 'triceps' should be the model. The coefficient for 'triceps' is highly likely to lie between and .
The confidence interval for the variable 'midarm' contain zero so it we conclude that it make a statistically significant contribution in addition to the predictor 'triceps' in explaining the variability in 'body fat'. Therefore 'midarm' should be the model. The coefficient for 'midarm' is highly likely to lie between and .
- Find a 95% confidence interval for the mean % body fat for a female (aged 20 to 34) whose triceps skinfold thickness is 25mm and midarm circumference is 310mm.
Define the prediction dataframe for the given predictor values and use the predict() function with that dataframe. Be careful to use the correct parameter to get a confidence interval not a prediction interval.
predframe <- data.frame(Triceps = 25, Midarm = 310)
predict(modelfat, int = "c", newdata = predframe)
## fit lwr upr
## 1 18.43155 16.67794 20.18516This means the average for a woman aged 20 to 34 is likely to lie between and .
- Find a 95% prediction interval for the % body fat of a future female with skinfold thickness of 20, and midarm circumference of 250 .
Define the prediction dataframe for the given predictor values and use the predict() function with that dataframe. Be careful to use the correct parameter to get a prediction interval not a confidence interval.
# prediction interval for % body fat of a female with Tricep skinfold thickness of 20mm and midarm circumference 250mm
predframe <- data.frame(Triceps = 20, Midarm = 250)
predict(modelfat, int = "p", newdata = predframe)
## fit lwr upr
## 1 16.01728 10.46253 21.57202- Interpret the interval.
If a female with skinfold thickness of 20mm, and midarm circumference of 250mm were selected randomly from the of healthy 20-34 year old women, it is highly likely that it would have a % body fat between and . Comparing with the 95% confidence interval, the 95% prediction interval has a range.