TLTE-889 Project
2022-07-24
Chapter 1 Chance Model
1.1 Coin Flipping Simulation
# The following code simulates the number of head obtained from flipping a coin 10 times.
resultContainer <- numeric(length=10)
for (i in 1: 10){
# in each trail, there are only two possible outcomes, 0 represents tail and 1 represents head.
  resultContainer[i] <- sample(0:1,1)
}
# Each value in the resultContainer represents result from flipping the coin each time, since one repetition contains 10 trails, there are 10 values in resultContainer.
resultContainer
## [1] 0 1 0 0 0 0 1 1 0 0# sumHead represents the total number of head obtained from flipping the coin 10 times.
sumHead <- sum(resultContainer)
sumHead## [1] 31.2 Doris & Buzz Simulation
# oneRep saves result of one repetion (16 trails). In each trial, outcome is 0 or 1.
oneRep <- rep(NA,16)
# container saves result of all 100 replications.
container <- t(replicate(100,oneRep))
for (i in 1:100) {
  for (j in 1:16){
    # 0 stands for Buzz guessing wrong and 1 stands for Buzz guessing correctly.
    container[i,j] <- sample(0:1,1)
  }
}
# calculate number of head in each replication and save the result in the dis100Rep vector
dis100Rep <- rowSums(container)
# create a dataframe "simulatedDisM" saving result for each repetition
repLabel <- 1:100
simulatedDis <- cbind(repLabel,dis100Rep)
simulatedDisM <- as.data.frame(simulatedDis)
head(simulatedDisM)
## repLabel dis100Rep
## 1 1 10
## 2 2 6
## 3 3 6
## 4 4 8
## 5 5 8
## 6 6 8# plot the resulted dataframe in a dot plot.
library(ggplot2)
ggplot(simulatedDisM, aes(x = dis100Rep)) +
geom_dotplot(method="histodot",binwidth = 0.2)+
theme(
axis.text.y=element_blank(), #remove y axis labels
axis.ticks.y=element_blank() #remove y axis ticks
)+
scale_x_continuous(breaks=c(1:16))+
labs(x="Number of Head")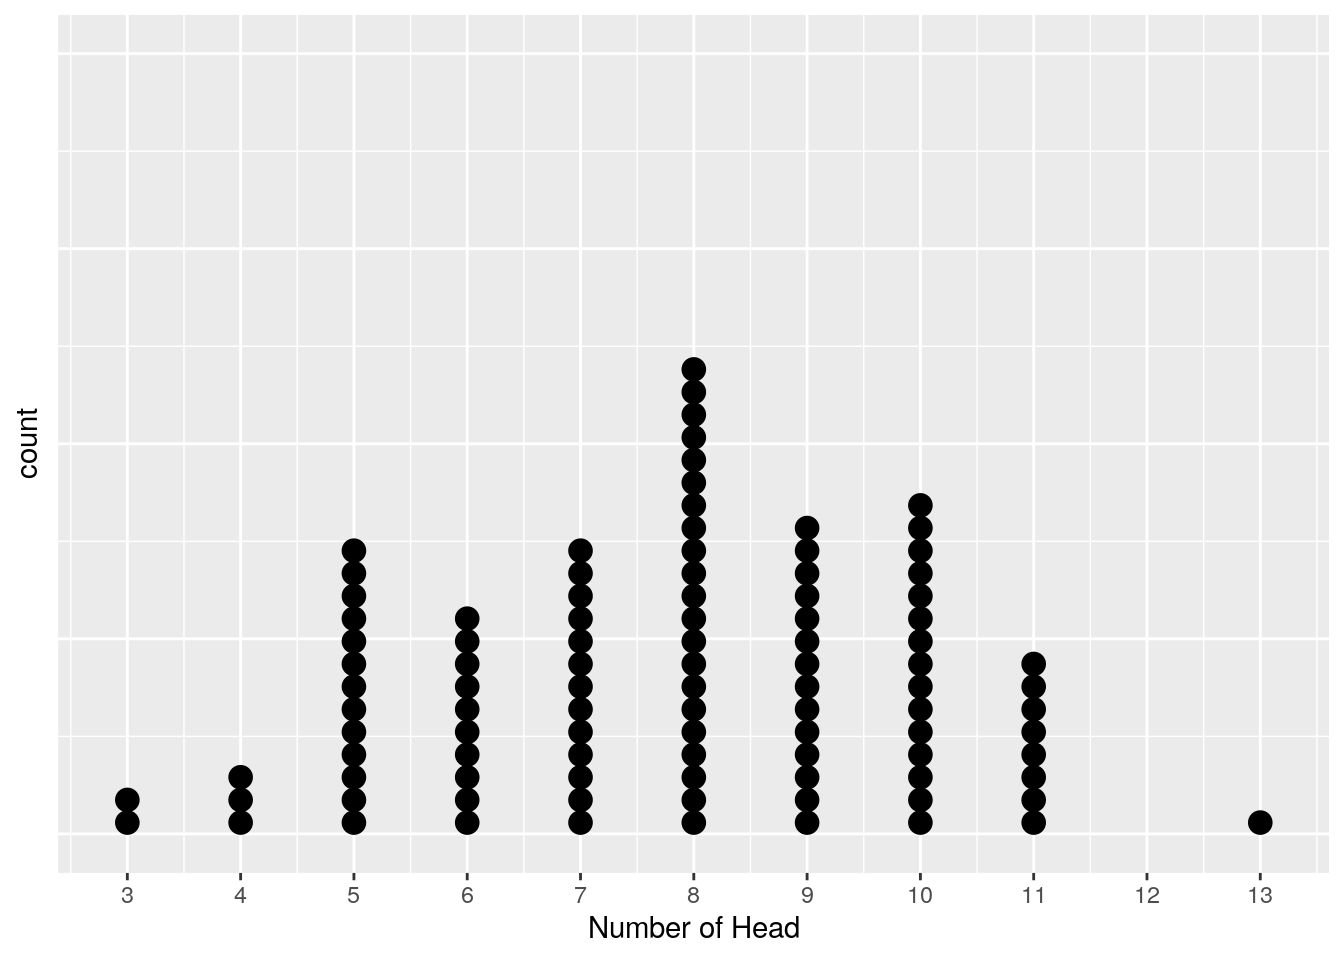
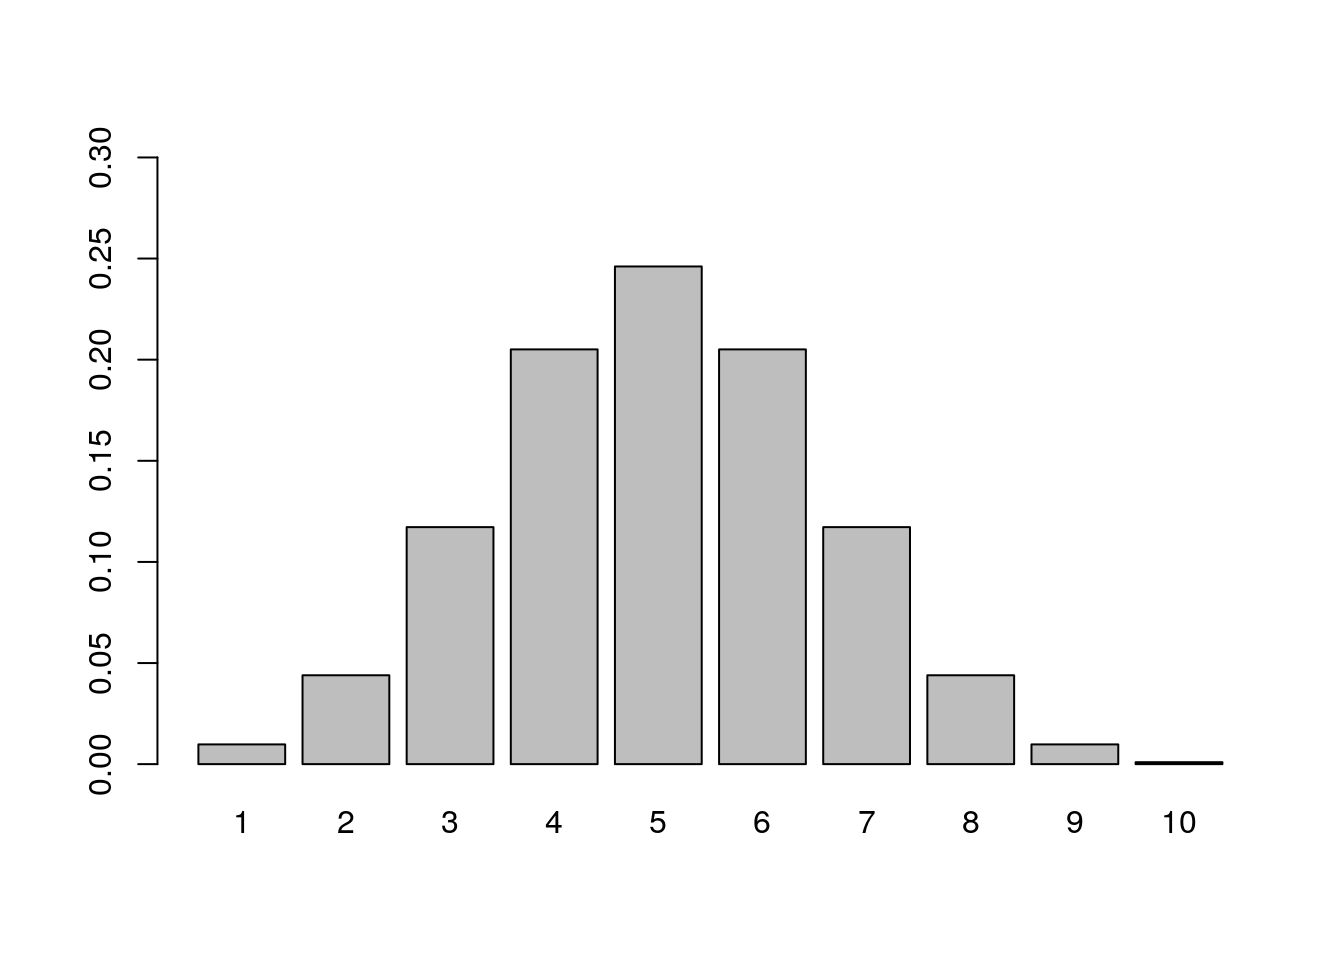
1.3 Binomial Distribution Calculator
# This example illustrate how to calculate the probablibity of obtaining 0 success from flipping a coin 10 times
numberTrial <- 10
numberSuccess <- 0
successProb <- 0.5
probability <- function(n, x) {
    factorial(n) / factorial(n-x) / factorial(x)*0.5^x*0.5^(n-x)
  }
prob0 <- probability(numberTrial,numberSuccess)

# Plot the distribution of getting number of heads from flipping a coin 10 times
distvector <- vector('numeric',length = 10)
for (i in 1:10){
  distvector[i] <- probability(10,i)
}
dis <- as.data.frame(cbind(seq(1,10),distvector))
barplot(dis$distvector,ylim=c(0,0.3),names.arg = dis$V1)