Section 8 PowerBI native visuals
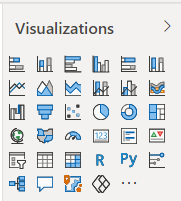
native
PowerBi offers a group of native visualizations that we will build most of the dashboard using them.
8.1 Comparison visuals
8.1.1 Comparing Numerical values of 1 or more categories
8.1.1.1 Clustered bar/Column chart
8.1.2 Comparing Numerical values of 1 or more categories and Comparing their totals
8.1.2.1 Stacked bar/Column chart
8.1.3 Comparing Percentages
8.1.3.1 100% Stacked Bar/Coumn chart
8.2 Change over time visuals
8.2.1 Displaying Numerical values of 1 or more categories over time dimension
8.2.1.1 Line/Area chart
8.2.2 Displaying Numerical values of 1 or more categories over time dimension with focus on Ranking and changes
8.2.2.1 Ribbon chart
8.2.3 Displaying Numerical values of 1 or more categories over time dimension with focus on their total
8.3 Combo charts
Adding time dimension to comparison visuals or Adding categorical values to change over time visuals