Chapter 4 Topic 02
4.1 Statistical Model
Statistical model for each observations \(i\) (using the same \(k\) regressors across \(m\) equations),
\[\begin{align*} \underset{\left(m \times 1\right)}{y_{i}} &= \underset{\left(m\times mk\right)}{\overline{X}_{i}} \underset{\left(mk \times 1\right)}{\beta} + \underset{\left(m \times 1\right)}{e_{i}}, \\ \begin{bmatrix} y_{1i} \\ y_{2i} \\ \vdots \\ y_{mi} \end{bmatrix} &= \begin{bmatrix} x_{1i}^{'} & 0 & \cdots & 0 \\ 0 & x_{2i}^{'} & \cdots & 0 \\ \vdots & \vdots & \ddots & 0 \\ 0 & 0& \cdots & x_{mi}^{'} \end{bmatrix} + \begin{bmatrix} \beta_{1} \\ \beta_{2} \\ \vdots \\ \beta_{m} \end{bmatrix} + \begin{bmatrix} u_{1i} \\ u_{2i} \\ \vdots \\ u_{mi} \end{bmatrix}, \end{align*}\]
with,
- \(y_{ji}\) and \(e_{ji}\) are scalars for \(j=1,...,m\).
- \(x_{ji}\) are \(\left(k \times 1\right)\) matrix for \(j=1,...,m\).
- \(\beta\) are \(\left(k \times 1\right)\) matrix for \(j=1,...,m\).
Using the same \(k\) regressors across \(m\) equations this could be simplified to,
\[\begin{align*} \underset{\left(m \times 1\right)}{y_{i}} &= \underset{\left(m\times mk\right)}{\left(\underset{\left(m \times m\right)}{I_{m}} \otimes \underset{\left(1\times k\right)}{x_{i}^{'}}\right)} \underset{\left(mk \times 1\right)}{\beta} + \underset{\left(m \times 1\right)}{e_{i}}. \end{align*}\]
Statistical model in matrix notation across observations \(i\) (using the same \(k\) regressors across \(m\) equations),
\[\begin{align*} \underset{\left(n \times m\right)}{Y} &= \underset{\left(n\times k\right)}{X} \underset{\left(k \times m\right)}{B} + \underset{\left(n \times k\right)}{E}. \end{align*}\]
4.2 Simulation
4.2.1 Set up
# clear workspace
rm (list = ls(all=TRUE))

# set seed
set.seed(1234567, kind="Mersenne-Twister")
4.2.2 Data Generating Process
\[\begin{align*} y_t B + x_t A &= u_t \\ u_t &= u_{t-1} P + v_t \\ v_t &= N\left(0, V_t\right) \\ V_t &= S_t S_t^{'} \\ S_t &= C + D w_t \\ x_{1t} &\sim U\left[x_{1l},x_{1u}\right] \\ x_{1t} &\sim N \left(\mu_{x_{1}},\sigma_{x_{1}}^2\right) \end{align*}\]
4.2.3 Simulation
# number of observations
t <- 2000

# parameters
b1 <- 0.6
b2 <- 0.2

a1 <- 0.4
a2 <- -0.5

c11 <- 1.0
c21 <- 0.5
c22 <- 2.0

d11  <- 0.5
d21  <- 0.2
d22  <- 0.2

p11 <- 0.8
p12 <- 0.1
p21 <- -0.2
p22 <- 0.6

b  <-  matrix(c(1, -b2,
                -b1, 1), nrow=2, byrow=T)
a  <- matrix(c(-a1, 0,
               0, -a2), nrow=2, byrow=T)
c  <-  matrix(c(c11,  0,
                c21, c22), nrow=2, byrow=T)
d  <-  matrix(c(d11,  0,
                d21,  d22), nrow=2, byrow=T)

# exogenous variables
x <- cbind(10*runif(t), 3*rnorm(t))
w <- runif(t)

# disturbances
zeros <- array(0, c(t,2))
u <- zeros
v <- zeros
for (i in 2:t) {
  l      <- c + d * w[i]
  v[i,]  <- rnorm(2) %*% t(l)
  u[i,1] <- p11*u[i-1,1] + p12*u[i-1,2] + v[i,1]
  u[i,2] <- p21*u[i-1,1] + p22*u[i-1,2] + v[i,2]
}

# simulate the reduced form
y <- zeros
for (i in seq(t)) {
  y[i,] <- -x[i,] %*% a %*% solve(b) + u[i,] %*% solve(b)
}
4.3 Least-Squares Estimator
Use the model in matrix notation across observations \(i\).
# dimensions
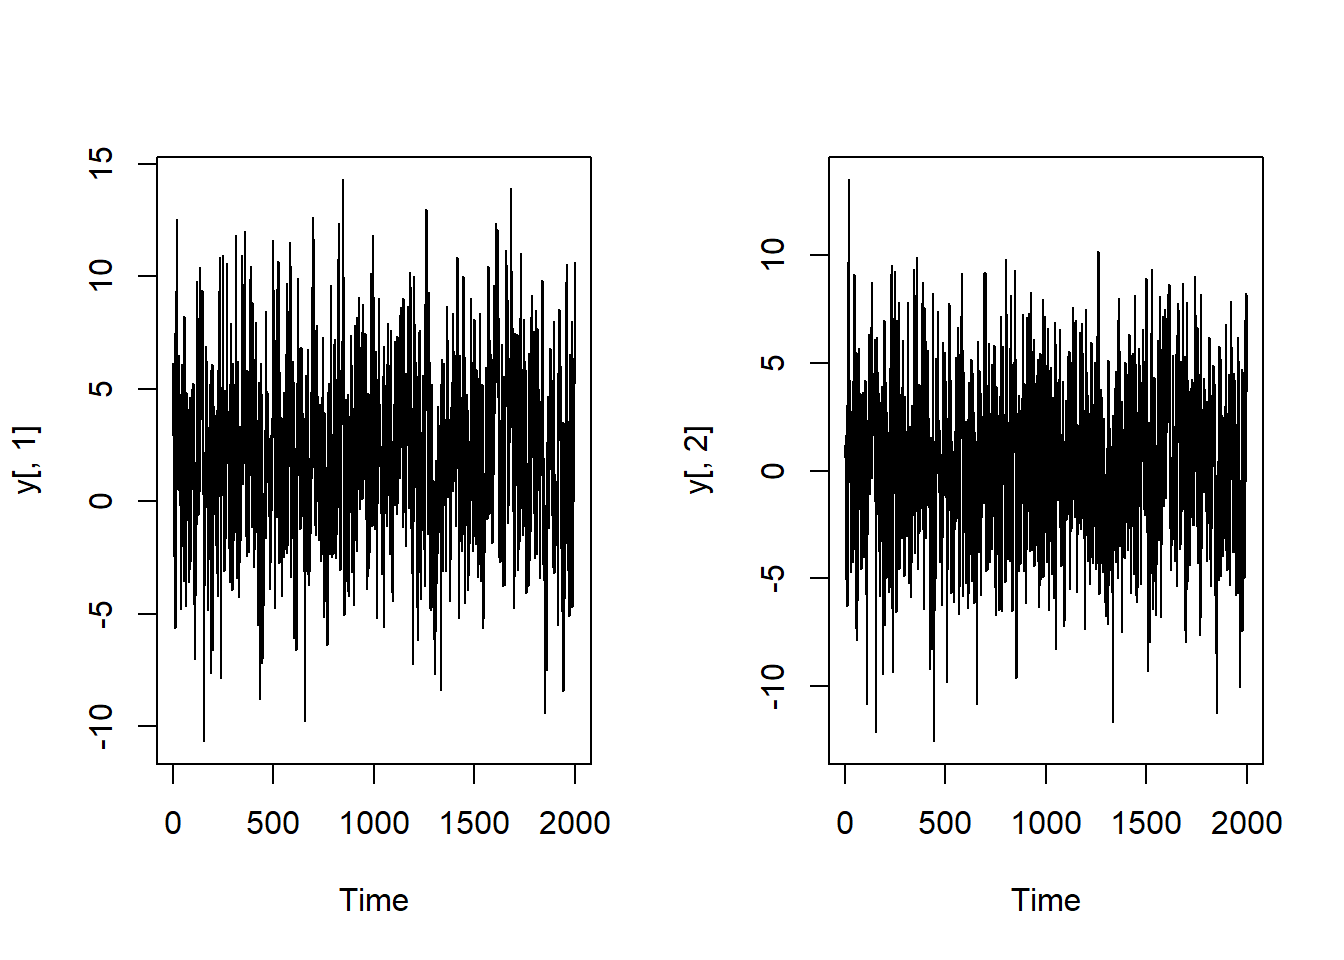
m <- ncol(y);m## [1] 2t <- nrow(y);t## [1] 2000k <- ncol(x);k## [1] 2# stack regressands and regressors
Y <- as.vector(y) # stack y over observations
length(Y)## [1] 4000X <- diag(m) %x% x # stack x over observations
dim(X)## [1] 4000 4# estimation
lm.res <- lm(Y ~ X - 1)
lm.res$coefficients## X1 X2 X3 X4
## 0.44495050 -0.37735285 0.07649982 -0.60879807# comoare with reduced form parameters for simmulation
as.vector(ab)## [1] 0.45454545 -0.34090909 0.09090909 -0.56818182# expand residuals again
u <- matrix(lm.res$residuals, ncol = m)
dim(u)## [1] 2000 2Sig.u <- 1/t * t(u) %*% u
Sig.u## [,1] [,2]
## [1,] 10.861852 7.894577
## [2,] 7.894577 9.537205# comoare with reduced form parameters for simmulation
# ???