Test of Bookdown
2023-01-09
Kapitel 1 HTML formatting
Centered text
More centered text
The contents of the below subsections are located in a sub folder.
1.1 Basic text
This is an R Markdown document. Markdown is a simple formatting syntax for authoring HTML, PDF, and MS Word documents. For more details on using R Markdown see http://rmarkdown.rstudio.com.
When you click the Knit button a document will be generated that includes both content as well as the output of any embedded R code chunks within the document. You can embed an R code chunk like this:
summary(cars)## speed dist
## Min. : 4.0 Min. : 2.00
## 1st Qu.:12.0 1st Qu.: 26.00
## Median :15.0 Median : 36.00
## Mean :15.4 Mean : 42.98
## 3rd Qu.:19.0 3rd Qu.: 56.00
## Max. :25.0 Max. :120.001.2 Including plots
You can also embed plots, for example:


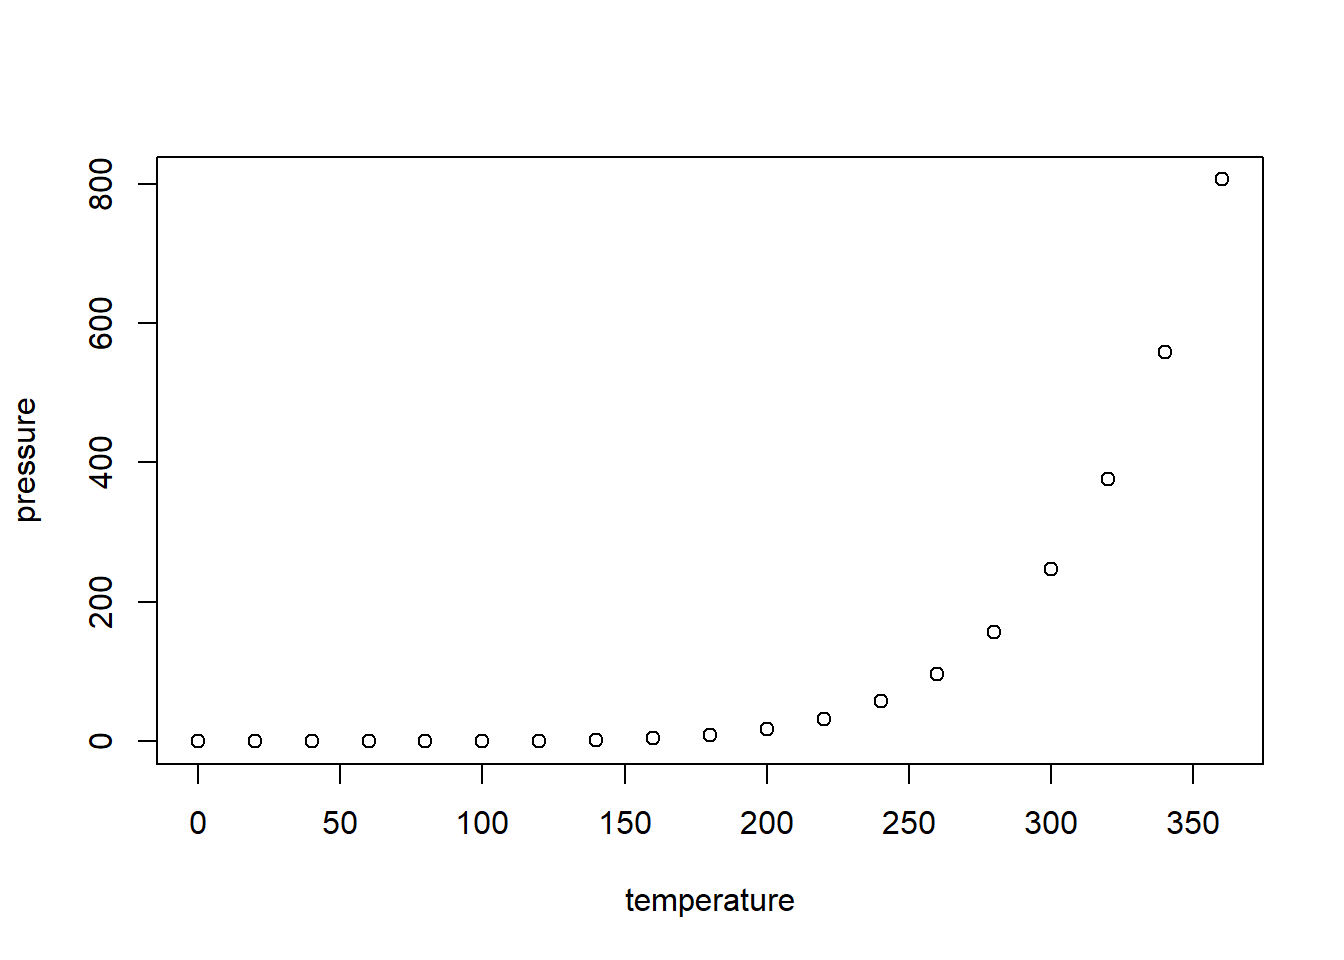
Note that the echo = FALSE parameter was added to the code chunk to prevent printing of the R code that generated the plot.
1.3 Including images
knitr::include_graphics(normalizePath("../test_images/cbs_logo.png"))Figure 1.1: This is CBS’ logo
This is section 1.3
See Figure 1.2.
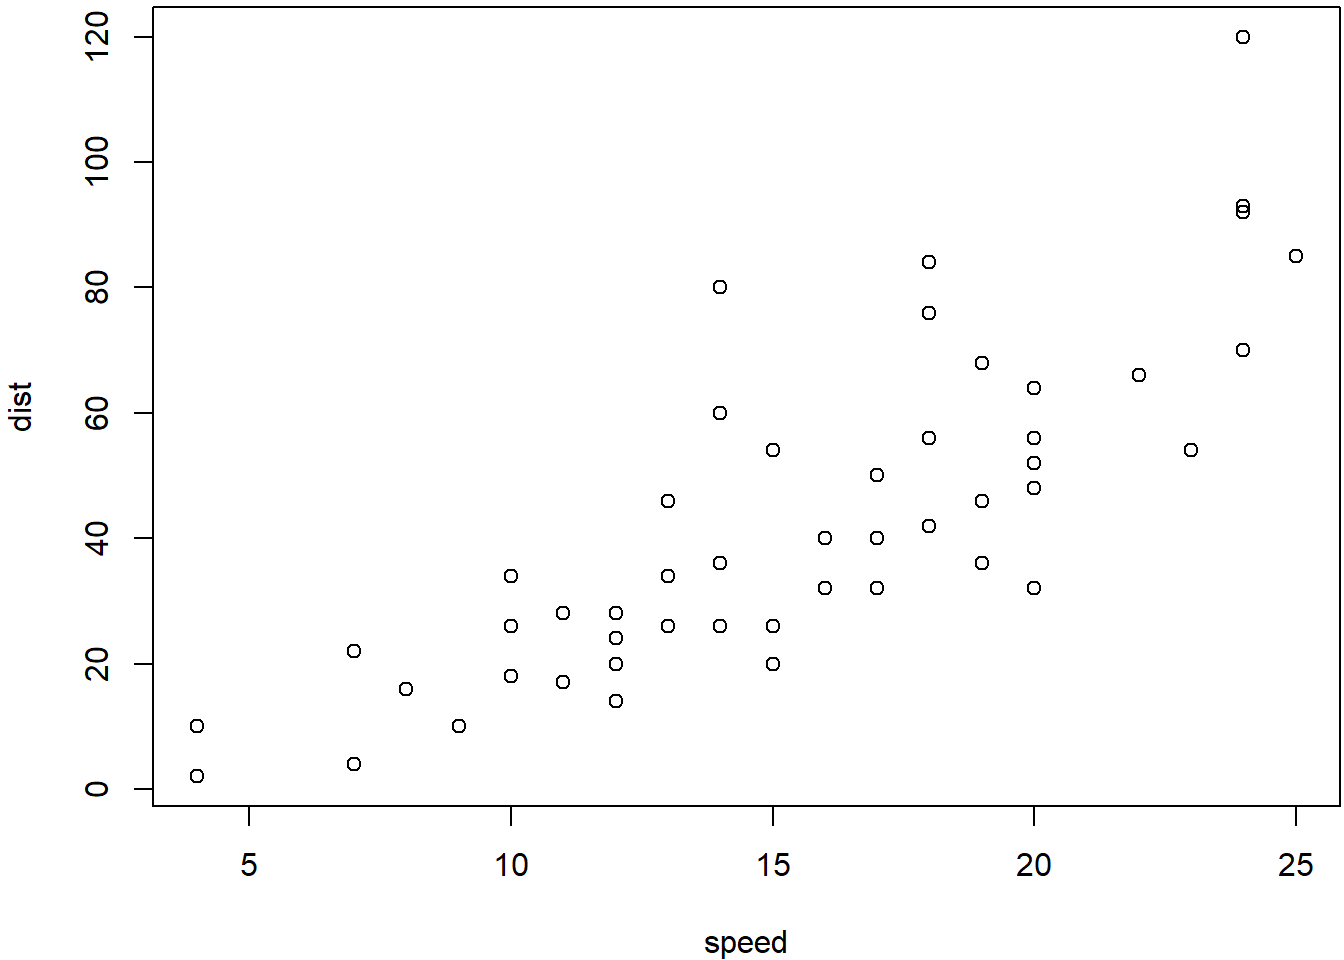
Figure 1.2: The cars data.
Also see Equation (1.1).
\[\begin{equation} \bar{X} = \frac{\sum_{i=1}^n X_i}{n} \tag{1.1} \end{equation}\]
And see Table 1.1.
| mpg | cyl | disp | hp | drat | |
|---|---|---|---|---|---|
| Mazda RX4 | 21.0 | 6 | 160 | 110 | 3.90 |
| Mazda RX4 Wag | 21.0 | 6 | 160 | 110 | 3.90 |
| Datsun 710 | 22.8 | 4 | 108 | 93 | 3.85 |
| Hornet 4 Drive | 21.4 | 6 | 258 | 110 | 3.08 |
| Hornet Sportabout | 18.7 | 8 | 360 | 175 | 3.15 |
Resultat: Transformation fra \(N(\mu,\sigma)\) til \(t\)
1.4 Tip boxes
You use a div tip by writing ::: following by the name that you assigned to it in the CSS after the div.
1.5 Own boxes
Resultat: Fordeling af \(\hat\mu\) (“my-hat”)
Lad \(X_1,...,X_n\) være indbyrdes uafhængige observationer af en variabel, der er normalfordelt \(N(\mu,\sigma)\). Vi estimerer normalfordelingens parametre ved \[\hat\mu=\frac{1}{n}\sum_{i=1}^nX_i\hspace{2cm}\hat\sigma=\sqrt{\frac{1}{n-1}\sum_{i=1}^n\left(X_i-\hat\mu\right)^2}\] Estimatet af \(\mu\) bliver selv normalfordelt \[\hat\mu\sim N\left(\mu,\frac{\sigma}{\sqrt{n}}\right)\]
Or we could do like this.
Another Definition
Praesent iaculis sed metus sed imperdiet. Nunc vitae augue bibendum, pulvinar neque id, suscipit justo. Quisque convallis, erat vel consectetur mattis, ante est euismod mauris, at condimentum enim erat id lorem. Phasellus volutpat id sapien a sollicitudin. Maecenas nec hendrerit felis.
or like this.
Another Definition
Praesent iaculis sed metus sed imperdiet. Nunc vitae augue bibendum, pulvinar neque id, suscipit justo. Quisque convallis, erat vel consectetur mattis, ante est euismod mauris, at condimentum enim erat id lorem. Phasellus volutpat id sapien a sollicitudin. Maecenas nec hendrerit felis.