References
7.4 1.1 Welcome to the Course!
Hi everyone, welcome to the course. This is the introduction to R course at Ewha Womans University.
R is a great programming language for statistical analysis and data science. I hope you enjoy R in this course and find many useful applications for your own field.
This course is designed for students who don’t have any programming background in social science.
In this lecture note,
this fontrepresents R commands,variable names,and package names.In order to maximize your learning in this semester,you should read the weekly reading assignment in our textbook, R for Data Science.
If you have any question on this lecture (e.g.,errors in running R, questions about quiz), please send your questions to r.ewha.questions.2021@gmail.com. Then, land TA(Teaching Assistant) will answer your questions.
In this lecture notes, I will include interactive code chunks provided by DataCamp that will allow you to actually run and practice R codes within this lecture notes.Please type
3+4and clikRunbutton to ask R to calculate the expression.
7.5 1.2 Types of Data Analysis
Before talking about R and social problems,let’s talk about the types of data analysis first.
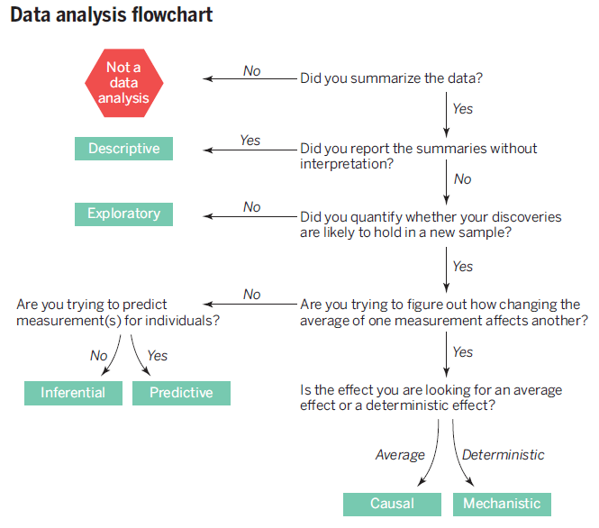
Leek & peng(2015) categorized data analysis into the 6 types as presented in the table below, and emphasized “mistaking the type of question being considered is the most common error in data analysis.”
| Types of Data Analysis | Questions being asked |
|---|---|
| Descriptive data analysis(기술통계분석) | seek to summarize(요약) the measurement in a single data set without further interpretation(e.g., US Census) |
| Exploratory data analysis(탐색적자료분석) | search for discoveries(발견),trends,correlations, or relationships between the measurements to generate ideas or hypotheses(e.g., The four-star planetary system Tatooine) |
| Inferential data analysis(추론분석) | quantify whether an observed pattern will likely hold beyond the data set in hand or in population(모집단)(e.g.,a study of whether air pollution correlates with life expectancy in US) |
| Predictive data analysis(예측분석) | predict(예측)another measurement (the outcome) on a single person or unit(e.g.,prediction of how people will vote in an election) |
| Casual data analysis(인과관계분석) | seek to find out what happens to one measurement on average if you make another measurement change(인과,e.g.,casual relationship between smoking and cancer) |
| Mechanistic data analysis(결정론적관계분석) | seek to show that changing one measurement always and exclusively leads to a specific,deterministic behavior in another(인과,e.g.,wing design) |

from Leek & Peng
Leek & Peng(2015)’s main point is that we should keep in mind the type of question being asked by our own data analysis. In other words, we should say what we can say, not what we want to say.
Leek & peng(2015) presents a table showing common mistakes
| Real Question Type | Perceived Quesion Type | Phrase Describing Error |
|---|---|---|
| Inferential | Causal | Correlation does not imply causation |
| Exploratory | Inferential | Data Dredging(or p-hacking) |
| Exploratory | Predictive | Overfitting(과적합) |
| Descriptive | Inferential | n of 1 analysis |
- Leek & peng(2015)mentioned a very important statement that we should keep in mind when we use data science to solve social problems:
“In nonrandomized experiments,it is usually only possible to determine the existence of a relationship between two measurements, but not the underlying mechanism or the reason for it.”
It is known that the best way to investigate causal relationship is to conduct randomized experiments. However,unlike in natural science, it is not easy to conduct randomized experiments in social science because of ethical and practical reasons. The fundamental dilemma of data analysis in social science is that we essentially want to make causal statements in the absence of randomized experiments. Many statistical tools we use are just correlational.
"In the field of the philosophy of science, it is usually said that the goals of science is explanation and prediction:
“Historically, social scientists have sought explanations of human and social phenomena that provide interpretable causal mechanisms, while often ignoring their predictive accurancy. We argue that the increasingly computational nature of social science is beginning to reverse this traditional bias against prediction.”(Hofman et al.,2017)
7.6 R Markdown
This is an R Markdown document. Markdown is a simple formatting syntax for authoring HTML, PDF, and MS Word documents. For more details on using R Markdown see http://rmarkdown.rstudio.com.
When you click the Knit button a document will be generated that includes both content as well as the output of any embedded R code chunks within the document. You can embed an R code chunk like this:
summary(cars)## speed dist
## Min. : 4.0 Min. : 2.00
## 1st Qu.:12.0 1st Qu.: 26.00
## Median :15.0 Median : 36.00
## Mean :15.4 Mean : 42.98
## 3rd Qu.:19.0 3rd Qu.: 56.00
## Max. :25.0 Max. :120.007.7 Including Plots
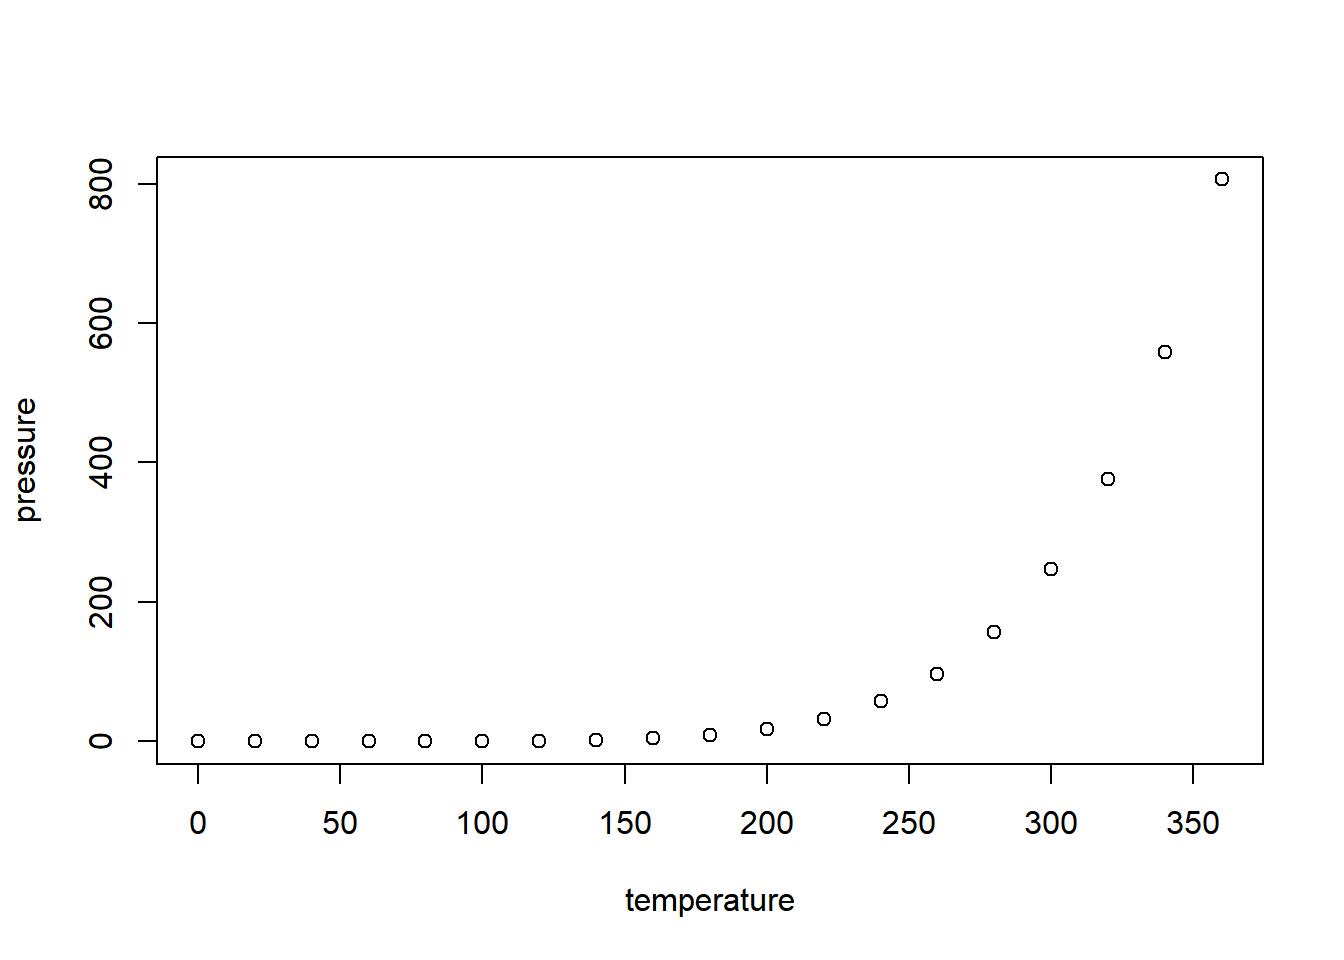
You can also embed plots, for example:

Note that the echo = FALSE parameter was added to the code chunk to prevent printing of the R code that generated the plot.