2 Unique capabilities
2.1 Data vizualizations
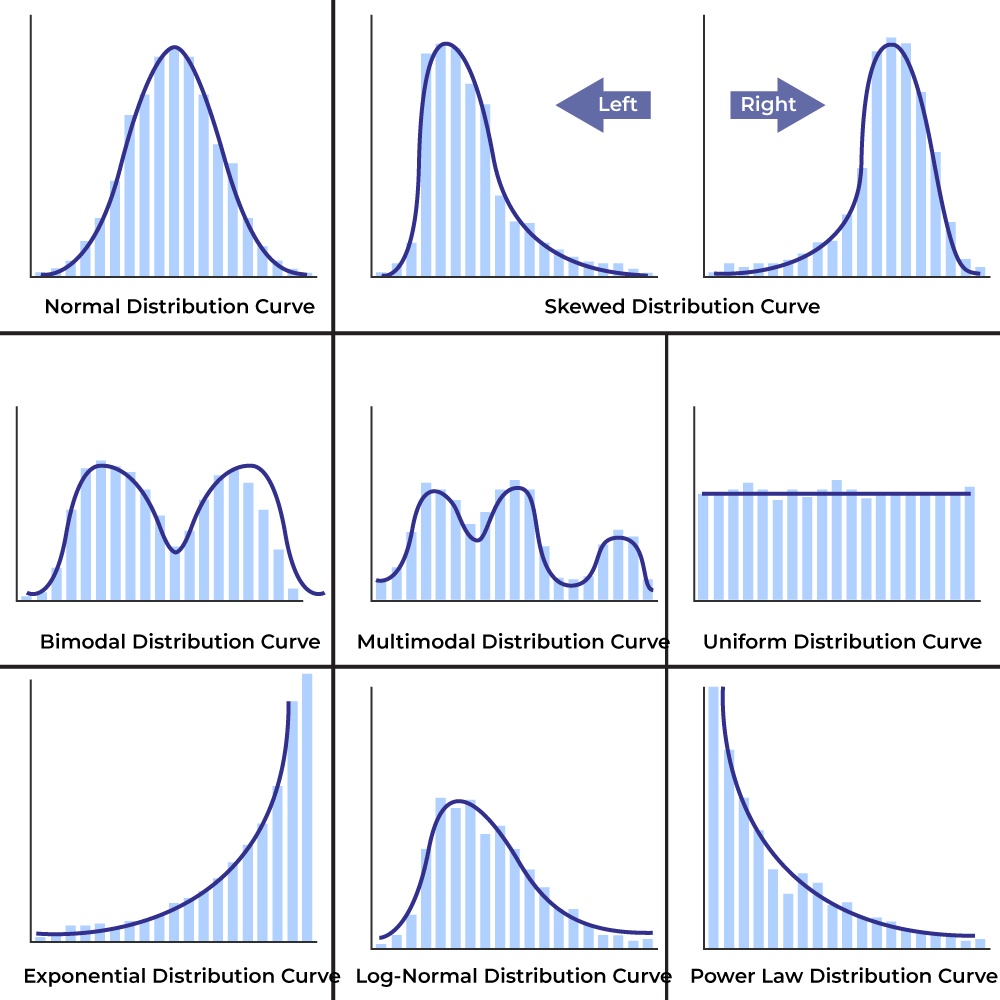
Figure 2.1 demonstrates lightbox capabilities for Quarto book images, whereby clicking isolates the image for closer inspection. This is useful for larger images that may not display on a single html page (such as the example frequency distributions of Figure 2.1).
Figure 2.2 demonstrates interactive components for graphical representations of data. In Psychometrics, this is helpful to reinforce scale(s) of measurement, obtain feedback on data clusters, and highlight differences between aggregate and individual datapoints.
2.2 Geo-spatial
Figure 2.3 is another example of interactivity - these maps can help reinforce the concept of representativeness within normative samples (e.g., where the data “came from” and who the data represents).
Note that all interactive visuals will be captured via static representation if a reader elects to download a PDF file [by accessing the button located within the toolbar]. These images are not currently optimized for static representation, so interactivity will render imperfectly within the example PDF.
2.3 Multi-media
Figure 2.4 shows yet another example - videos can be pulled from external sites (like this presentation of important Psychometric terms) or can present locally produced video files.
