1 Theories and Social Science
The focus of this book is on using quantitative empirical research to test hypotheses and build theory in political science and public policy. The book is designed to be used by graduate students in the introductory and intermediate quantitative analysis courses. It is important to note that quantitative analysis is not the only – or even the most important – kind of analysis undertaken in political science and public policy research. Qualitative analysis, including ethnographic studies, systematic cases analyses, focus groups, archival studies, and qualitative elite interviews (to name only a few approaches) are of critical importance for understanding social and political phenomena. With that understanding in mind, this book and the associated courses focus on the development and application of systematic analysis, hypothesis testing and theory building using quantitative data and modeling. Specifically, we focus on developing research design, univariate analysis, and an understanding of linear regression modeling and analysis (and related techniques). Throughout we provide with applications and examples using the R statistical platform.
1.1 The Scientific Method
Empirical research, as outlined in this book, is based on the scientific method. Science is a particular way that some epistemologists believe we can understand the world around us. Science, as a method, relies on both logic, as captured by theory, and empirical observation of the world to determine whether the theory we have developed conforms to what we actually observe. We seek to explain the world with our theories, and we test our theories by deducing and testing hypotheses. When a working hypothesis is supported, we have more confidence in our theory. When the null hypothesis is supported, it undermines our proposed theory.
Science seeks a particular kind of knowledge and has certain biases. When we are engaging in scientific research we are interested in reaching generalizations. Rather than wanting to explain why President Trump’s approval dropped, we are interested in explaining why presidential approval drops across various presidents, or, better yet, how economic conditions affect presidential approval. These generalizations should be logical (which is nothing more than saying they should be grounded in a strong theory) and they should be empirically verified (which, we will see means that we have tested hypotheses deduced from our theory). We also look for generalizations that are causal in nature. Scientists actively seek explanations grounded in causation rather than correlation. Scientific knowledge should be replicable – meaning that other scholars should be able to reach the same conclusions that you do. There should be inter-subjective agreement on scientific findings – meaning that people, with different personal experiences and biases, should still reach the same conclusion.
Scientists also tend to prefer simple explanations to complex ones. They have a bias that says the world is pretty simple and that our theories should reflect that belief. Of course, people are complex, so in the social sciences it can be dangerous to look only for the simplest explanation as most concepts we consider have multiple causes.
1.2 Theory and Empirical Research
This book is concerned with the connection between theoretical claims and empirical data. It is about using statistical modeling; in particular, the tool of regression analysis, which is used to develop and refine theories. We define theory broadly as a set of interrelated propositions that seek to explain and, in some cases, predict an observed phenomenon.
Theory: A set of interrelated propositions that seek to explain and predict an observed phenomenon.
Theories contain three important characteristics that we discuss in detail below.
Characteristics of Good Theories
- Coherent and internally consistent
- Causal in nature
- Generate testable hypotheses
1.2.1 Coherent and Internally Consistent
The set of interrelated propositions that constitute a well structured theory are based on concepts. In well-developed theories, the expected relationships among these concepts are both coherent and internally consistent. Coherence means the identification of concepts and the specified relationships among them are logical, ordered, and integrated. An internally consistent theory will explain relationships with respect to a set of common underlying causes and conditions, providing for consistency in expected relationships (and avoidance of contradictions). For systematic quantitative research, the relevant theoretical concepts are defined such that they can be measured and quantified. Some concepts are relatively easy to quantify, such as the number of votes cast for the winning Presidential candidate in a specified year or the frequency of arrests for gang-related crimes in a particular region and time period. Others are more difficult, such as the concepts of democratization, political ideology or presidential approval. Concepts that are more difficult to measure must be carefully operationalized, which is a process of relating a concept to an observation that can be measured using a defined procedure. For example, political ideology is often operationalized through public opinion surveys that ask respondents to place themselves on a Likert-type scale of ideological categories.
Concepts and Variables
A concept is a commonality across observed individual events or cases. It is a regularity that we find in complex world. Concepts are our building blocks to understanding the world and to developing theory that explains the world. Once we have identified concepts we seek to explain them by developing theories based on them. Once we have explained a concept we need to define it. We do so in two steps. First, we give it a dictionary-like definition, called a nominal definition. Then, we develop an operational definition that identifies how we can measure and quantify it.
Once a concept has been quantified, it is employed in modeling as a variable. In statistical modeling, variables are thought of as either dependent or independent variables. A dependent variable, \(Y\), is the outcome variable; this is the concept we are trying to explain and/or predict. The independent variable(s), \(X\), is the variable(s) that is used to predict or explain the dependent variable. The expected relationships between (and among) the variables are specified by the theory.
Measurement
When measuring concepts, the indicators that are used in building and testing theories should be both valid and reliable. Validity refers to how well the measurement captures the concept. Face validity, for example, refers to the plausibility and general acceptance of the measure, while the domain validity of the measure concerns the degree to which it captures all relevant aspects of the concept. Reliability, by contrast, refers to how consistent the measure is with repeated applications. A measure is reliable if, when applied to the repeated observations in similar settings, the outcomes are consistent.
Assessing the Quality of a Measure
Measurement is the process of assigning numbers to the phenomenon or concept that you are interested in. Measurement is straight-forward when we can directly observe the phenomenon. One agrees on a metric, such as inches or pounds, and then figures out how many of those units are present for the case in question. Measurement becomes more challenging when you cannot directly observe the concept of interest. In political science and public policy, some of the things we want to measure are directly observable: how many dollars were spent on a project or how many votes the incumbent receives, but many of our concepts are not observable: is issue X on the public’s agenda, how successful is a program, or how much do citizens trust the president. When the concept is not directly observable the operational definition is especially important. The operational definition explains exactly what the researcher will do to assign a number for each subject/case.
In reality, there is always some possibility that the number assigned does not reflect the true value for that case, i.e., there may be some error involved. Error can come about for any number of reasons, including mistakes in coding, the need for subjective judgments, or a measuring instrument that lacks precision. These kinds of error will generally produce inconsistent results; that is, they reduce reliability. We can assess the reliability of an indicator using one of two general approaches. One approach is a test-retest method where the same subjects are measured at two different points in time. If the measure is reliable the correlation between the two observations should be high. We can also assess reliability by using multiple indicators of the same concept and determining if there is a strong inter-correlation among them using statistical formulas such as Cronbach’s alpha or Kuder-Richardson Formula 20 (KR-20).
We can also have error when our measure is not valid. Valid indicators measure the concept we think they are measuring. The indicator should both converge with the concept and discriminate between the concept and similar yet different concepts. Unfortunately there is no failsafe way to determine whether an indicator is valid. There are, however, a few things you can do to gain confidence in the validity of the indicator. First, you can simply look at it from a logical perspective and ask if it seems like it is valid. Does it have face validity? Second, you can see if it correlates well with other indicators that are considered valid, and in ways that are consistent with theory. This is called construct validity. Third, you can determine if it works in the way expected, which is referred to as predictive validity. Finally, we have more confidence if other researchers using the same concept agree that the indicator is considered valid. This consensual validity at least ensures that different researchers are talking about the same thing.
Measurement of Different Kinds of Concepts
Measurement can be applied to different kinds of concepts, which causes measures of different concepts to vary. There are three primary levels of measurement; ordinal, interval, and nominal. Ordinal level measures indicate relative differences, such as more or less, but do not provide equal distances between intervals on the measurement scale. Therefore, ordinal measures cannot tell us how much more or less one observation is than another. Imagine a survey question asking respondents to identify their annual income. Respondents are given a choice of five different income levels: $0-20,000, $20,000-50,000, $50,000-$100,000, and $100,000+. This measure gives us an idea of the rank order of respondents’ income, but it is impossible for us to identify consistent differences between these responses. With an interval level measure, the variable is ordered and the differences between values are consistent. Sticking with the example of income, survey respondents are now asked to provide their annual income to the nearest ten thousand dollar mark (e.g., $10,000, $20,000, $30,000, ect.). This measurement technique produces an interval level variable because we have both a rank ordering and equal spacing between values. Ratio scales are interval measures with the special characteristic that the value of zero (0) indicates the absence of some property. A value of zero (0) income in our example may indicate a person does not have a job. Another example of a ratio scale is the Kelvin temperature scale, because zero (0) degrees Kelvin indicates the complete absence of heat. Finally, a nominal level measure identifies categorical differences among observations. Numerical values assigned to nominal variables have no inherent meaning, but only differentiate one ``type" (e.g., gender, race, religion) from another.
1.2.2 Theories and Causality
Theories should be causal in nature, meaning that an independent variable is thought to have a causal influence on the dependent variable. In other words, a change in the independent variable causes a change in the dependent variable. Causality can be thought of as the ``motor" that drives the model and provides the basis for explanation and (possibly) prediction.
The Basis of Causality in Theories
- Time Ordering: The cause precedes the effect, \(X \rightarrow Y\)
- Co-Variation: Changes in \(X\) are associated with changes in \(Y\)
- Non-Spuriousness: There is not a variable \(Z\) that causes both \(X\) and \(Y\)
To establish causality we want to demonstrate that a change in the independent variable is a necessary and sufficient condition for a change in the dependent variable (though more complex, interdependent relationships can also be quantitatively modeled). We can think of the independent variable as a treatment, \(\tau\), and we speculate that \(\tau\) causes a change in our dependent variable, \(Y\). The ``gold standard’’ for casual inference is an experiment where a) the level of \(\tau\) is controlled by the researcher and b) subjects are randomly assigned to a treatment or control group. The group that receives the treatment has outcome \(Y_1\) and the control group has outcome \(Y_0\); the treatment effect can be defined as \(\tau = Y_1-Y_0\). Causality is inferred because the treatment was only given to one group, and since these groups were randomly assigned other influences should wash out. Thus the difference \(\tau = Y_1-Y_0\) can be attributed to the treatment.
Given the nature of social science and public policy theorizing, we often can’t control the treatment of interest. For example, our case study in this text concerns the effect of political ideology on views about the environment. For this type of relationship, we cannot randomly assign ideology in an experimental sense. Instead, we employ statistical controls to account for the possible influences of confounding factors, such as age and gender. Using multiple regression we control for other factors that might influence the dependent variable.1
1.2.3 Generation of Testable Hypothesis
Theory building is accomplished through the testing of hypotheses derived from theory. In simple form, a theory implies (sets of) relationships among concepts. These concepts are then operationalized. Finally, models are developed to examine how the measures are related. Properly specified hypotheses can be tested with empirical data, which are derived from the application of valid and reliable measures to relevant observations. The testing and re-testing of hypotheses develops levels of confidence that we can have for the core propositions that constitute the theory. In short, empirically grounded theories must be able to posit clear hypotheses that are testable. In this text, we discuss hypotheses and test them using relevant models and data.
As noted above, this text uses the concepts of political ideology and views about the environment as a case study in order to generate and test hypotheses about the relationships between these variables. For example, based on popular media accounts, it is plausible to expect that political conservatives are less likely to be concerned about the environment than political moderates or liberals. Therefore, we can pose the working hypothesis that measures of political ideology will be systematically related to measures of concern for the environment – with conservatives showing less concern for the environment. In classical hypothesis testing, the working hypothesis is tested against a null hypothesis. A null hypothesis is an implicit hypothesis that posits the independent variable has no effect (i.e., null effect) on the dependent variable. In our example, the null hypothesis states ideology has no effect on environmental concern.
1.3 Theory and Functions
Closely related to hypothesis testing in empirical research is the concept of functional relationships – or functions. Hypotheses posit systematic relationships between variables, and those relationships are expressed as functions. For example, we can hypothesize that an individual’s productivity is related coffee consumption (productivity is a function of coffee consumption).2
Functions are ubiquitous. When we perceive relational order or patterns in the world around us, we are observing functions. Individual decisions about when to cross the street, whether to take a nap, or engage in a barroom brawl can all be ascribed to patterns (the ``walk" light was lit; someone stayed up too late last night; a Longhorn insulted the Sooner football team). Patterns are how we make sense of the world, and patterns are expressed as functions. That does not mean the functions we perceive are always correct, or that they allow us to predict perfectly. However, without functions we don’t know what to expect; chaos prevails.
In mathematical terms, a function relates an outcome variable, \(y\), to one or more inputs, \(x\). This can be expressed more generally as: \(y=f(x_{1},x_{2},x_{3},... x_{n})\), which means \(y\) is `a function of the \(x\)’s, or, \(y\) varies as a function of the \(x\)’s.
Functions form the basis of the statistical models that will be developed throughout the text. In particular, this text will focus on linear regression, which is based on linear functions such as \(y=f(x)=5+x\), where \(5\) is a constant and \(x\) is a variable. We can plot this function with the values of \(x\) ranging from \(-5\) to \(5\). This is shown in Figure 1.1.
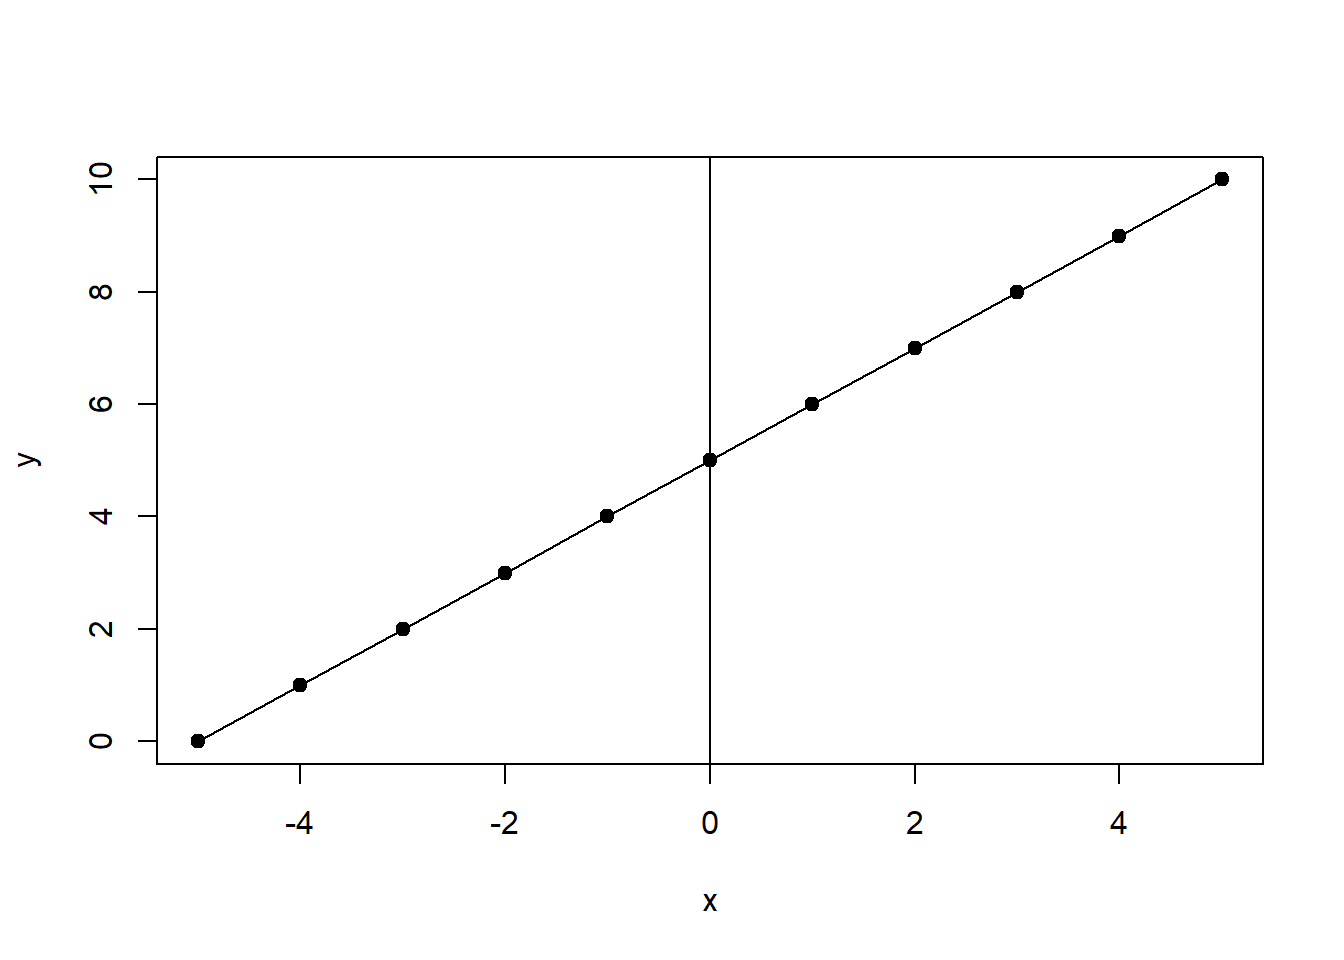
Figure 1.1: Liner Function \(y=f(x)=5+x\)
As you can see, the \(x\) values range from \(-5\) to \(5\) and the corresponding \(y\) values range from \(0\) to \(10\). The function produces a straight line because the changes in \(y\) are consistent across all values of \(x\). This type of function is the basis of the linear models we will develop, therefore these models are said to have a linear functional form.
However, non-linear functional forms are also common. For example, \(y=f(x)=3-x^2\) is a quadratic function, which is a type of polynomial function since it contains a square term (an exponent). It is plotted in Figure 1.2. This function is non-linear because the changes in \(y\) are not consistent across the full range of \(x\).
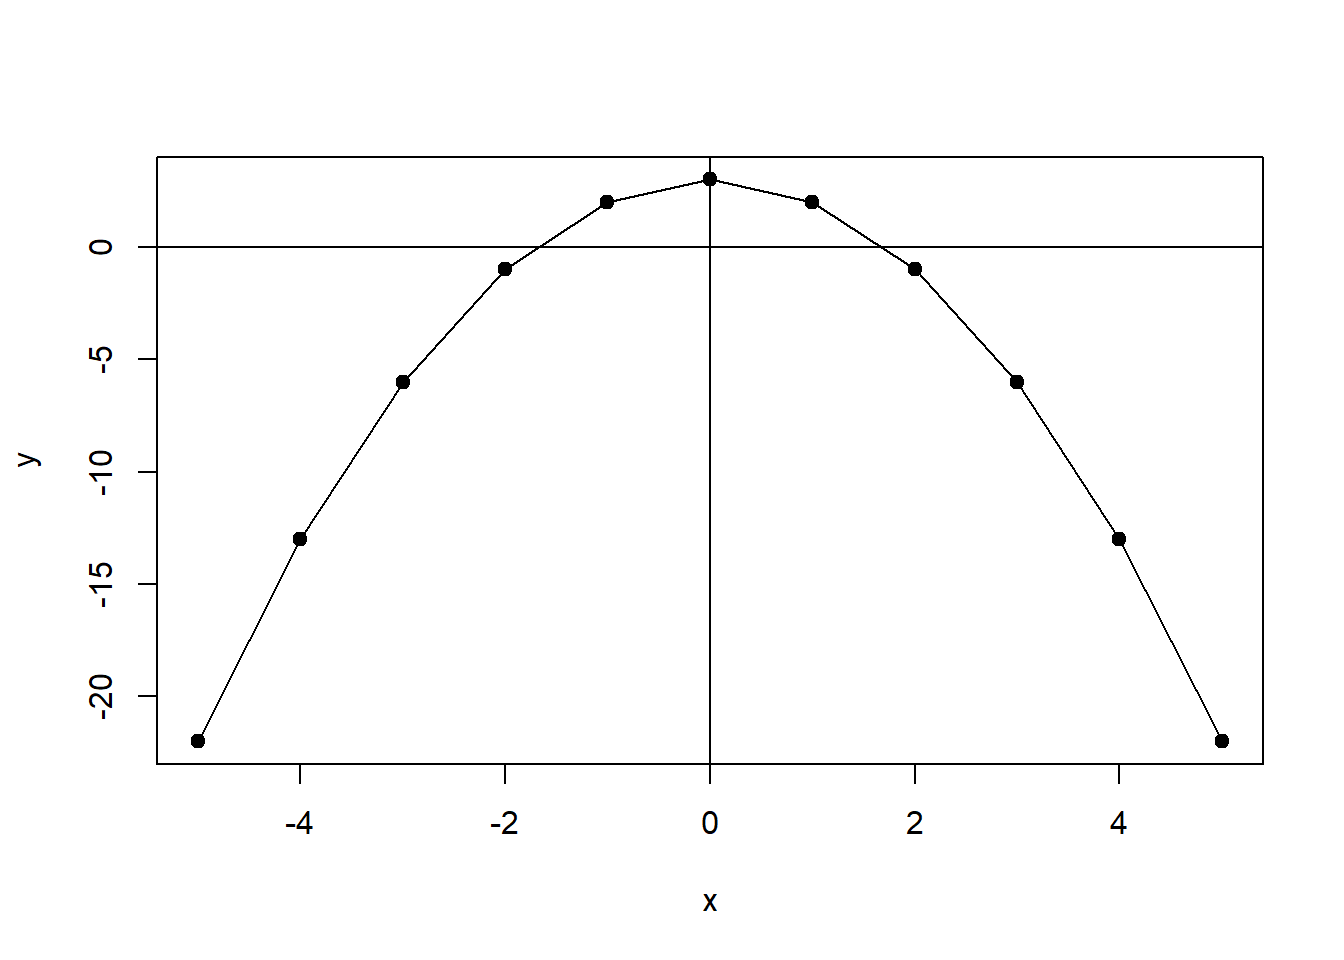
Figure 1.2: Non-Linear Function: One Exponent \(y=f(x)=3-x^2\)
1.5 Outline of the Book
The goal of this text is to develop an understanding of how to build theories by testing hypotheses using empirical data and statistical models. There are three necessary ingredients of strong empirical research. The first is a carefully constructed theory that generates empirically testable hypotheses. Once tested, these hypothesis should have implications for the development of theory. The second ingredient is quality data. The data should be valid, reliable, and relevant. The final ingredient is using the appropriate model design and execution. Specifically, the appropriate statistical models must be used to test the hypotheses. Appropriate models are those that are properly specified, estimated, and use data that conforms to the statistical assumptions. This course focuses on model design and execution.
As noted, this text uses political ideology and views on the environment as a case study to examine theory building in the social sciences.3 The text is organized by the idealized steps of the research process. As a first step, this first chapter discussed theories and hypothesis testing, which should always be (but often are not!) the first consideration. The second chapter focuses on research design and issues of internal and external validity. Chapter 3 examines data and covers specific ways to understand how the variables in the data are distributed. This is vital to know before doing any type of statistical modeling. The fourth chapter is an introduction to probability. The fifth chapter covers inference and how to reach conclusions regarding a population when you are studying a sample. The sixth chapter explores how to understand basic relationships that can hold between two variables including cross tabulations, covariance, correlation, and difference of means tests. These relationships are the foundation of more sophisticated statistical approaches and therefore understanding these relationships is often a precursor to the later steps of statistical analysis. The seventh through tenth chapters focus on bivariate ordinary least squares (OLS) regression, or OLS regression with a dependent variable and one independent variable. This allows us to understand the mechanics of regression before moving on the third section (chapters eleven to fifteen) that cover multiple OLS regression. The final section of the book (chapter sixteen) covers logistic (logit) regression. Logit regression is an example of a class of models called generalized linear models (GLM). GLMs allow for linear analysis to be performed on different types of dependent variables that may not be appropriate for OLS regression.
As a final note, this text makes extensive use of R. The code to reproduce all of the examples is excluded in the text in such a way that it can be easily copied and pasted into your R console. The data used for the examples is available as well. You can find it here.
This matter will be discussed in more detail in the multiple regression section.↩
The more coffee, the greater the productivity – up to a point! Beyond some level of consumption, coffee may induce the jitters and ADD-type behavior, thereby undercutting productivity. Therefore the posited function that links coffee consumption to productivity is non-linear, initially positive but then flat or negative as consumption increases.↩
As you may have already realized, social scientists often take these steps out of order … we may ``back into" an insight, or skip a step and return to it later. There is no reliable cookbook for what we do. Rather, think of the idealized steps of the scientific process as an important heuristic that helps us think through our line of reasoning and analysis – often after the fact – to help us be sure that we learned what we think we learned from our analysis.↩