1 Selecting the Theoretical Model
To explain Austria’s long term growth, we want to find the theoretical growth model that best fits the data. In order to evaluate whether a model fits the data or not we look at the concussions of the model (a.k.a the output growth equation) and see if the stated relationship between variables holds.
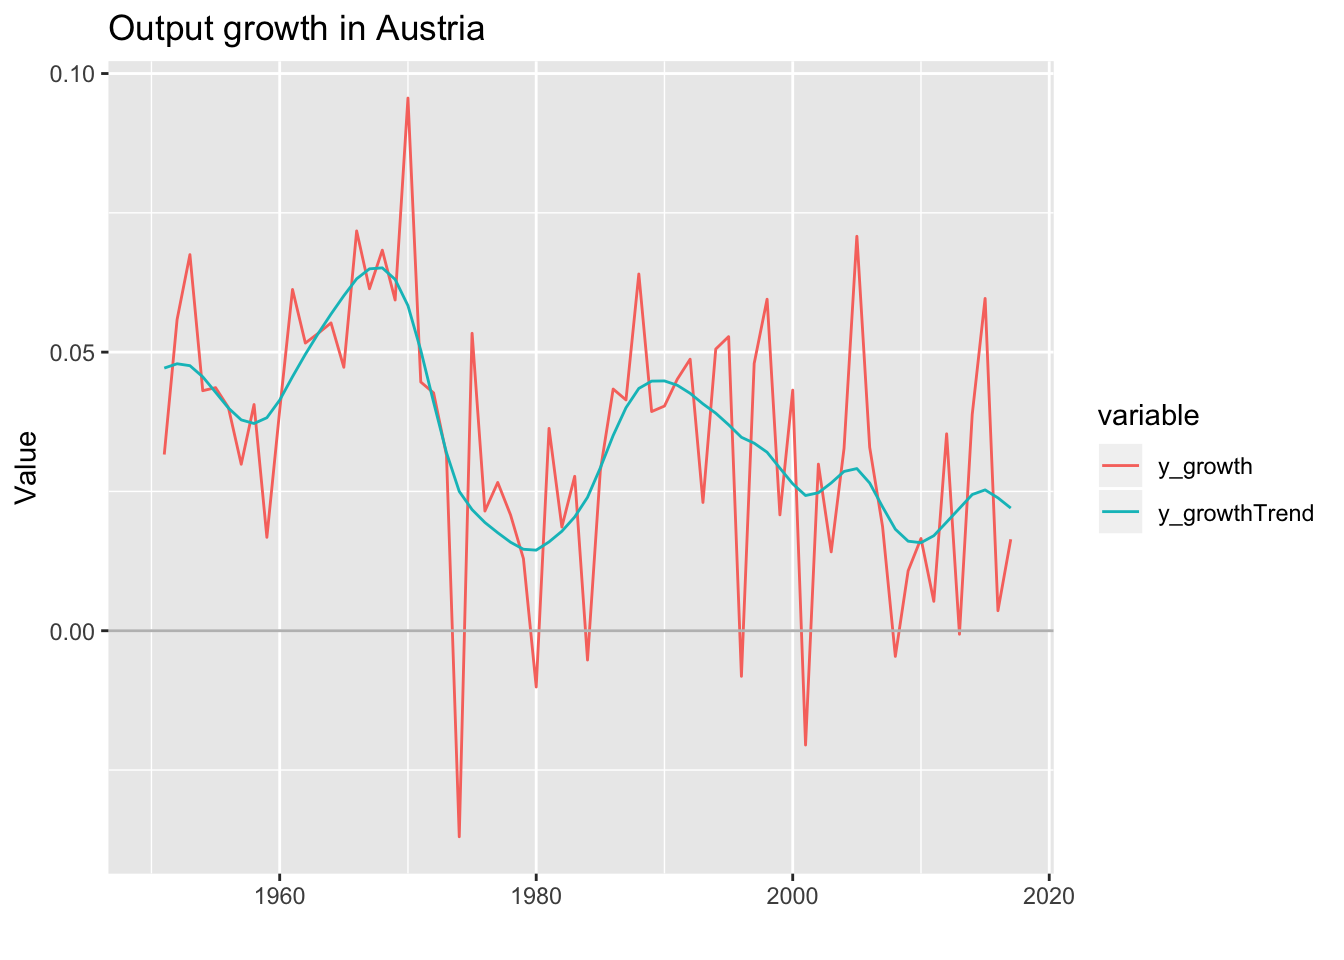
After some testing, we found out that the theory of institutions is the only growth theory that has the ability to explain the evolution of growth in Austria. To arrive to this conclusion we mainly used past literature and a graphical tests that consisted in the decomposition of Austria’s growth to extract the trend and compare it to the models different predictions.
1.1 The Models
1.1.1 Ak Model
The AK model’s mechanism of output growth is given by the following equation
\[\gamma_y=sA-\delta\]
Which means that output growth rates should increase if there is an increase in investment —or savings—. Jones (1995) tested the AK model in Austria and found that even though investment increased a lot after WWII, there was no correspondence in output growth. This led him to reject the AK model as a good explanation of Austria’s long term growth.
1.1.2 Lucas Model
Lucas’ model predicts that output growth is given by \[\gamma_y=1-u\] Where \(1-u\) is the time spend accumulating capital.
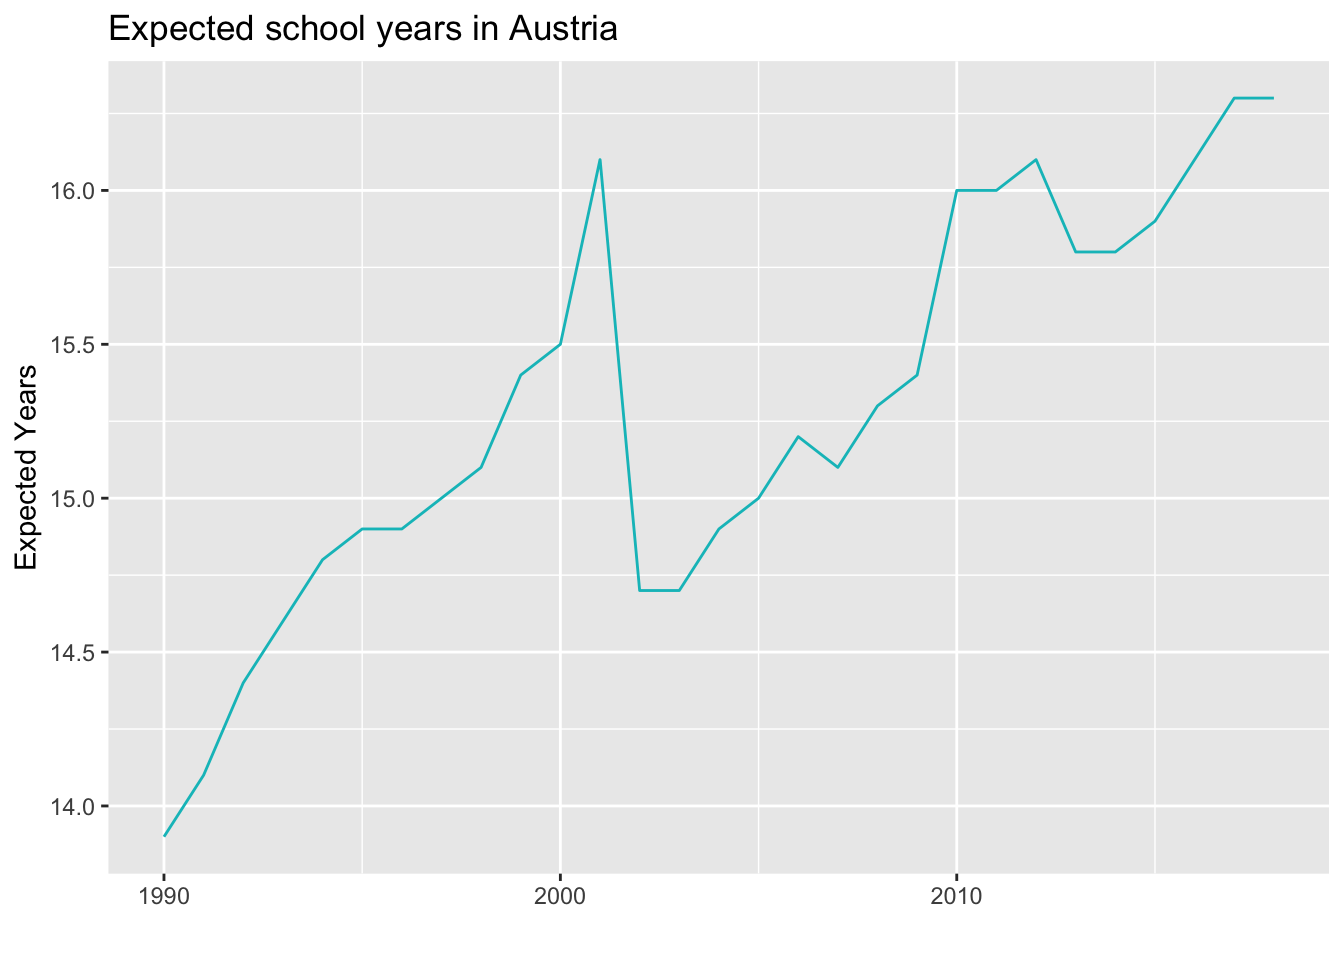
For this reason, we should expect that as people spend more time in school (accumulating human capital) the growth rate should increase. From the next plot, which describes expected years of schooling in Austria, we can see that even as expected years increase (form 1990 on) the output growth rate has decreased.
1.1.3 Romer Model
In the Romer model innovations are the source of continuous growth. In order to test if this hypothesis was correct for Austria’s economic history we used to important technological innovations that were developed in the late XX century and observed what happened with output growth in the country. The innovations we used were
- 1975: First personal computer
- 1990: Creation of the world wide web
We noted that, against all predictions from the Romer Model, output growth actually decreased after both of these innovations.
1.1.4 Institutions
Finally, since no other endogenous growth model was able to explain Austria’s output growth, we tested Institutions as the main explanation for development in Austria. We found results that matched with the actual data and it was for this reason that we chose the Institutions Hypothesis as our framework for the rest of the document.
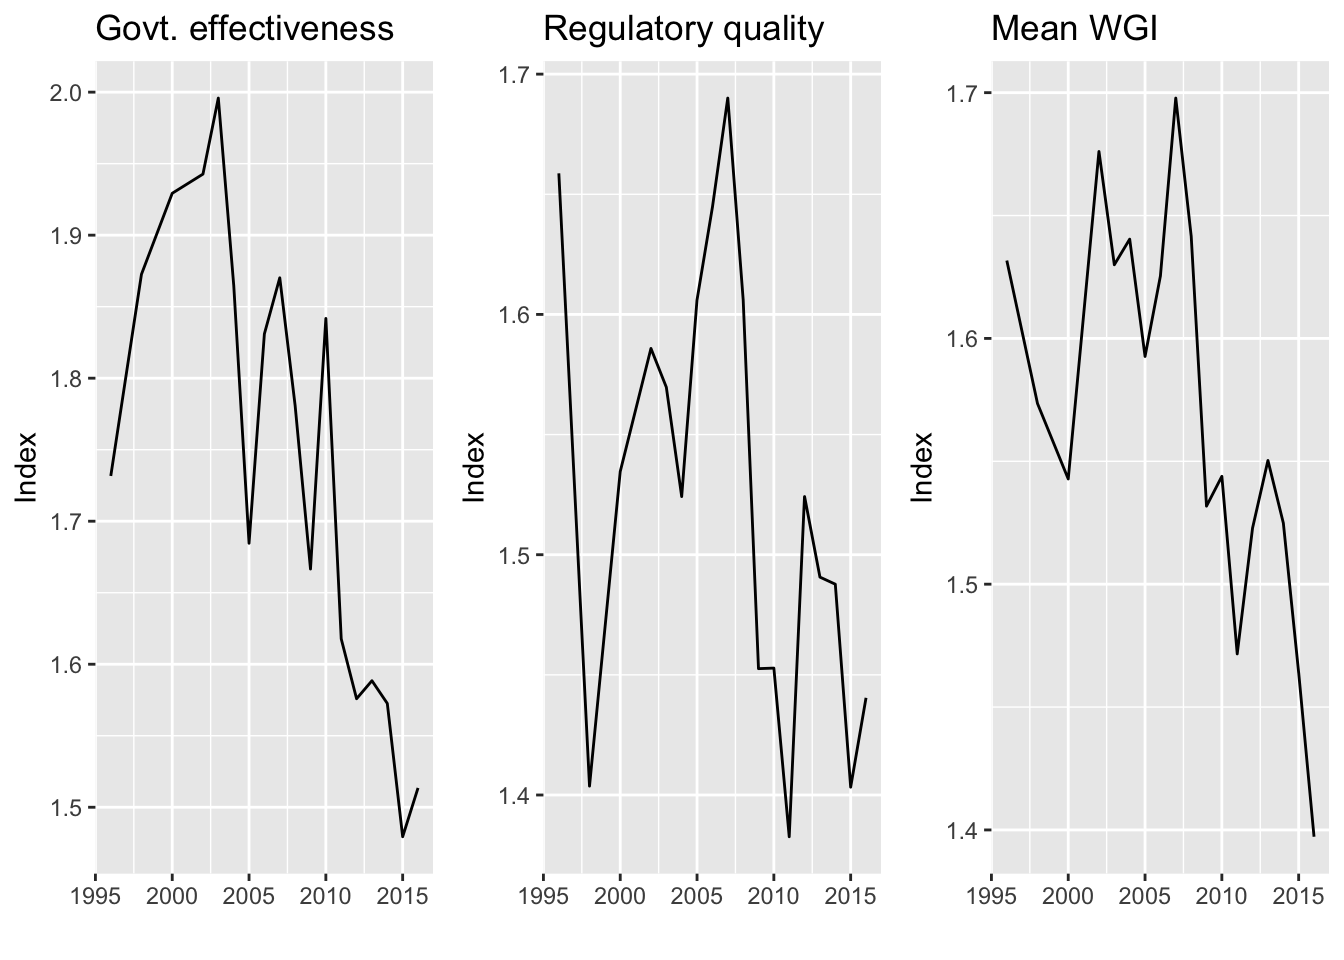
In the 1980s Austria went through a big institutional reform which turned the nation from a more government-heavy country into a free-market economy (Hermann, 2012). We can see that after this huge institutional change Austria’s output growth increased by a lot. To evaluate current-time institutions, we used the methodology presented in (Lehne, 2014) and we found that Austrian institutions have become worse after 2005, and so has it’s output growth.
1.2 The Mechanisms of Growth
We will highlight two of the main mechanisms that make Austria grow and that differentiate it from other countries. This mechanisms, as mentioned before, are fully dependent on the present institutions; we are talking about international trade and easiness to create firms.
1.2.1 International Trade
Since the 1980s reforms, Austria has sought to open it’s barriers and allow for exchanges across frontiers in terms of goods, services, capital and labor. Currently Austria holds the first spot for trade across barriers in the World Bank’s “Doing Business” Survey (World Bank, 2019)
As stated by Austria’s government, their location, which is central to most European countries is key for their growth as the country serves as a meeting point for politics and businessmen. In their own words, “Austria is increasingly becoming an international meeting point, which is illustrated by the large number of summits and conferences held in Austria. At the same time, the country’s relevance as a vital transit country between the economic areas of Europe is increasing, especially for European energy supplies, including petroleum, natural gas, and electricity” (Austria.org, n.d.). 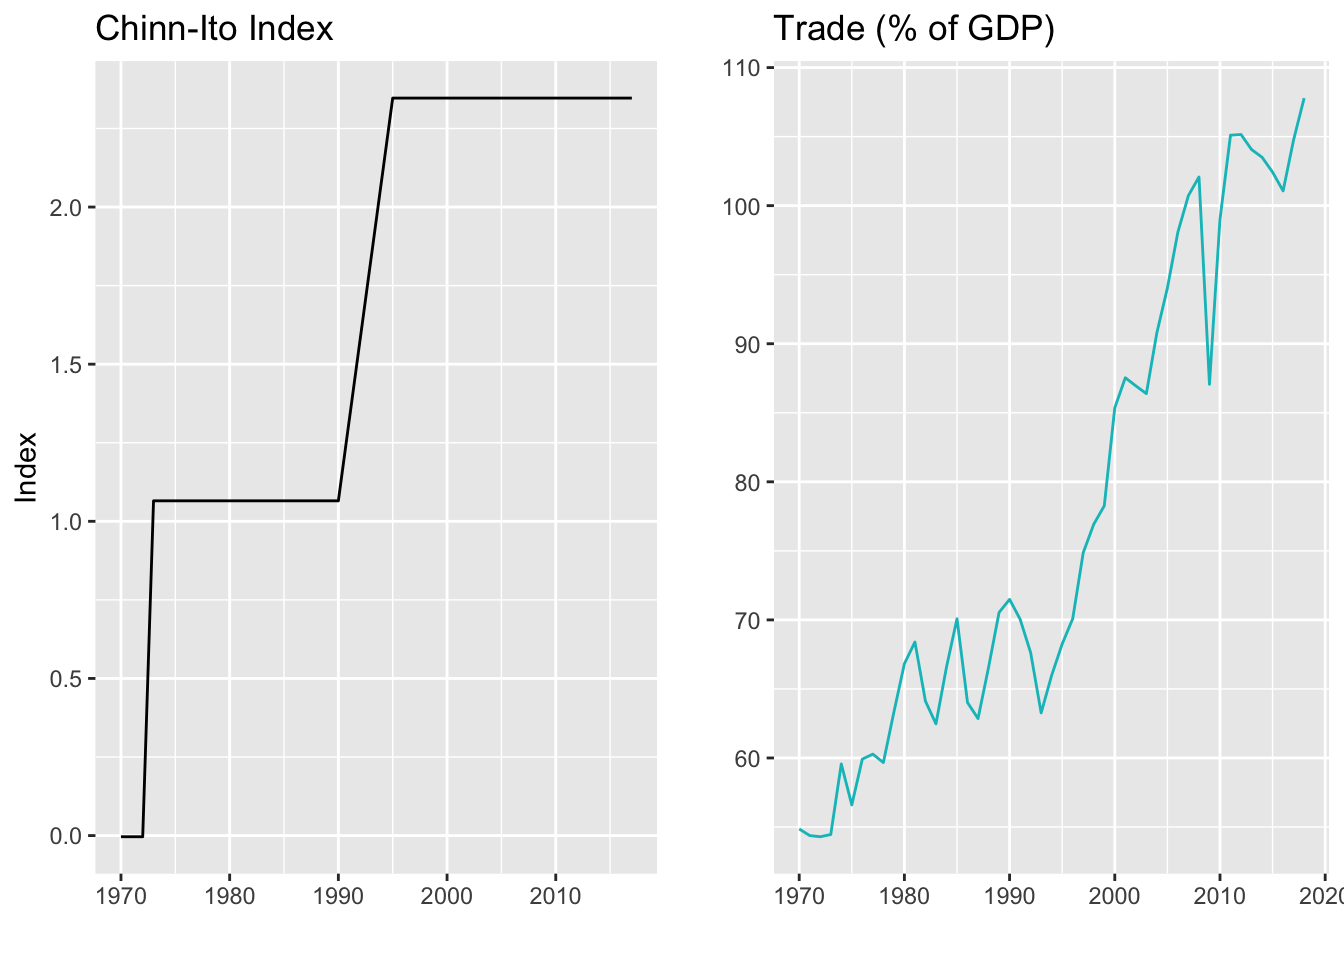
We used the Chinn-Ito index to evaluate capital movement freedom and trade as percentage of GDP to measure trade openness as we can observe, the 1980s reforms which open the country to external trade, led to a large increase in commerce starting in 1990.
1.2.2 Easiness to create firms
The main goal of Austria’s 1980 reforms was to turn the once government-heavy country into a free market and global economy. In this sense, the nation reduced the power held by the government and let the markets work, while promoting the creation of enterprises.
Combining a full-coverage and free education system with incentives to build firms led to the creation of a lot of SMEs with a lot of added value. In current times Austria’s industrial and commercial sectors are characterized by a high proportion of medium-sized companies. SMEs in represent 99.6% of all businesses and they employ 68% of the total working force (Austrian Institute for SME Research, 2019). This composition is very positive in an economical sense as it reduces the possibilities of a firm to have market or political control. Mühlberger & Leoni (2013) supported this idea by stating that “Austria’s accession to the EU and growing internationalization of its economy […] limited the margin for maneuver of interest groups”.
References
- Austrian Institute for SME Research. (2019). SME DATA. Retrieved from https://www.kmuforschung.ac.at/facts-and-figures/kmu-daten/?lang=en. Accessed on 16 April 2020
- Famira-Mühlberger, U., & Leoni, T. (2013). The economic and social situation in Austria’. Vienna: WIFO (Austrian Institute of Economic Research).
- World Bank. (2019). Doing Business. Retrieved 7 April 2020, from https://datacatalog.worldbank.org/dataset/doing-business
- Austria.org. (n.d.). Economy. Austrian Embassy. Retrieved from https://www.austria.org/