2 Interviews
library(tidyverse)
library(dplyr)
library(lubridate)
library(googlesheets4)
library(stringr)
library(ggthemes)
library(plotly)
library(formattable)
library(janitor)
2.1 Data cleaning
interviews <- read_sheet("1cneSuzuzXGHlTa4O2QJyiF0tyfg2oJrxZia0BwB06QU")## Reading from 'Interviews with residents of rental and sold block'## Range "'Interactions in HDB void decks'"## New names:
## Where do you encounter them the most? -> Where do you encounter them the most?..17
## Where do you encounter them the most? -> Where do you encounter them the most?..36# adding _ to blanks in column names
interviews <- interviews %>%
clean_names()
# recoding block
interviews <- interviews %>%
mutate(which_block_are_you_from=recode(which_block_are_you_from,
"485B"="purchased",
"499C"="rental"))
# factor and order how often questions
how_often_levels <- c("Never","Rarely","Sometimes","Always")
interviews <- interviews %>%
mutate(how_often_do_you_encounter_your_neighbours_by_chance_at_the_void_deck=parse_factor(how_often_do_you_encounter_your_neighbours_by_chance_at_the_void_deck,levels=how_often_levels,ordered=T)) %>%
mutate(how_often_do_you_encounter_your_neighbours_by_chance_at_areas_other_than_the_void_deck=parse_factor(how_often_do_you_encounter_your_neighbours_by_chance_at_areas_other_than_the_void_deck,levels=how_often_levels,ordered=T))
# factor and order true false questions
TF_levels <- c("TRUE","FALSE")
interviews <- interviews %>%
mutate(do_you_use_the_precinct_pavilion=parse_factor(do_you_use_the_precinct_pavilion,levels=TF_levels,ordered=T)) %>%
mutate(do_you_interact_with_residents_of=parse_factor(do_you_interact_with_residents_of,levels=TF_levels,ordered=T)) %>%
mutate(do_you_interact_with_your_neighbours_when_you_meet_them=parse_factor(do_you_interact_with_your_neighbours_when_you_meet_them,levels=TF_levels,ordered=T)) %>%
mutate(do_you_use_the_void_deck_at_your_block=parse_factor(do_you_use_the_void_deck_at_your_block,levels=TF_levels,ordered=T)) %>%
mutate(do_you_know_about_the_new_integrated_block=parse_factor(do_you_know_about_the_new_integrated_block,levels=TF_levels,ordered=T))2.2 Do you use your void deck?
interviews %>%
  group_by(which_block_are_you_from) %>%
  mutate(total_block = n()) %>%
  group_by(do_you_use_the_void_deck_at_your_block,which_block_are_you_from) %>%
  mutate(perc_label = paste(round(n()/total_block*100,1),"%")) %>%
  mutate(perc = n()/total_block*100) %>%
  ggplot(aes((do_you_use_the_void_deck_at_your_block), fill=which_block_are_you_from))+
  geom_bar(aes(y = perc),stat="identity",position="dodge")+
  geom_text(aes(y=perc,label=perc_label),position=position_dodge(width=0.9),vjust=-0.5, hjust=0.43,size=3,color="black")+
  theme_fivethirtyeight() +
  labs(title="Do you use the void deck at your block?   [interview]") +
  theme(plot.title = element_text(size=14, hjust=0.5))+
  theme(axis.title = element_text()) + xlab('') + ylab('count') + labs(fill='block')+
  theme(axis.title.y=element_blank(),
        axis.text.y=element_blank(),
        axis.ticks.y=element_blank())+
  scale_x_discrete(breaks=c("TRUE","FALSE"),
        labels=c("Yes","No"))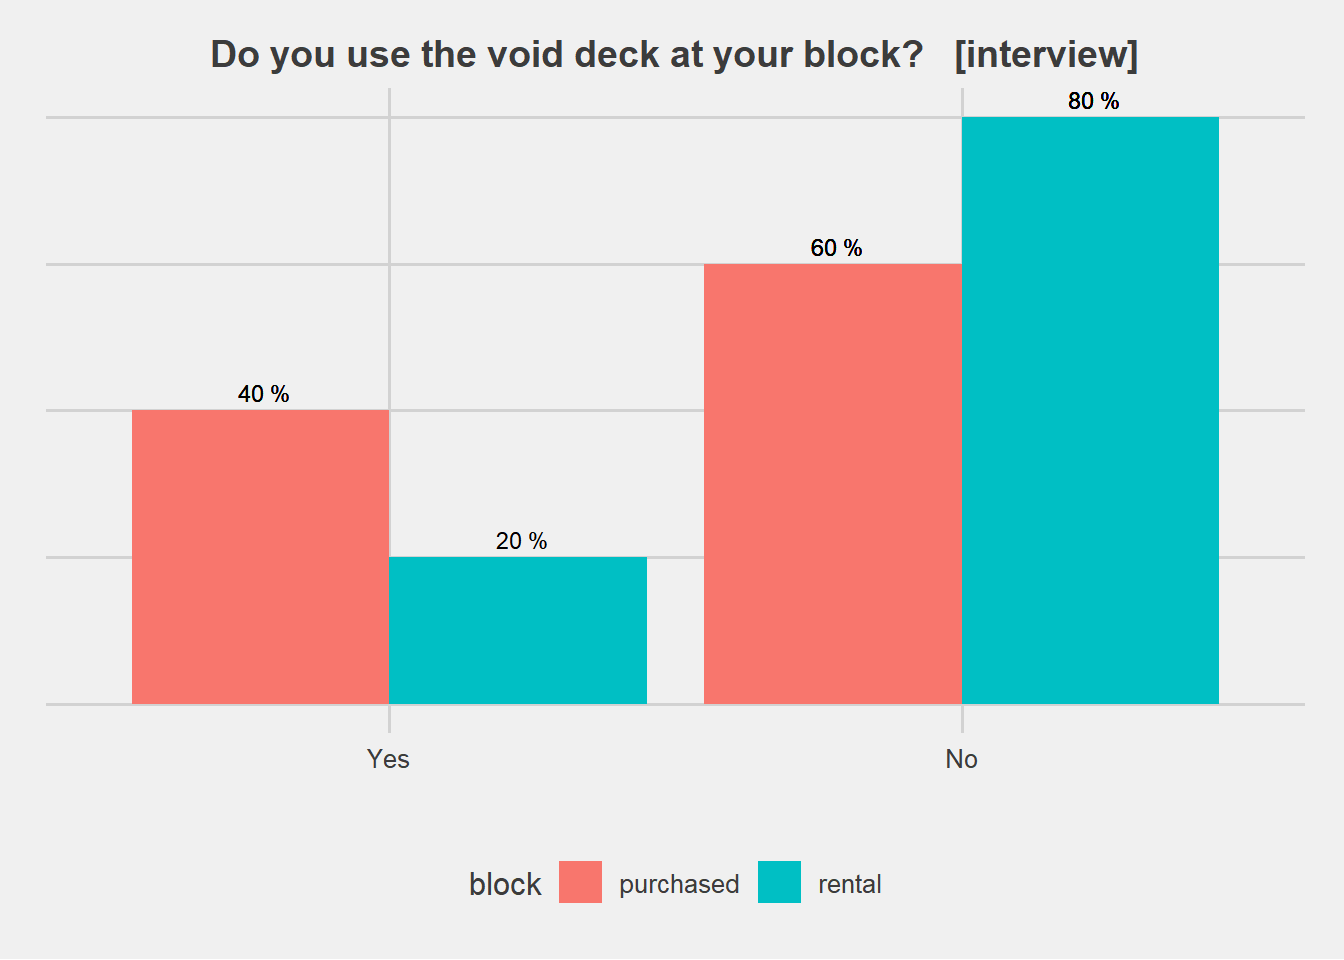
#ggsave("plots/interview/voiddeck_yes_no.png")2.3 How often do you chance upon your neighbours at the void deck?
interviews %>%
  group_by(which_block_are_you_from) %>%
  mutate(total_block = n()) %>%
  group_by(how_often_do_you_encounter_your_neighbours_by_chance_at_the_void_deck,which_block_are_you_from) %>%
  mutate(perc_label = paste(round(n()/total_block*100,1),"%")) %>%
  mutate(perc = n()/total_block*100) %>%
  ggplot(aes((how_often_do_you_encounter_your_neighbours_by_chance_at_the_void_deck), fill=which_block_are_you_from))+
  geom_bar(aes(y = perc),stat="identity",position="dodge")+
  geom_text(aes(y=perc,label=perc_label),position=position_dodge(width=0.9),vjust=-0.5, hjust=-0.2,size=3,color="black")+
  theme_fivethirtyeight() +
  labs(title="How often do you chance upon \n your neighbours at the void deck?   [interview]") +
  theme(plot.title = element_text(size=14, hjust=0.5))+
  theme(axis.title = element_text()) + xlab('') + ylab('') + labs(fill='block') +
  facet_grid(which_block_are_you_from~.)+
  aes(fill = which_block_are_you_from)+
  coord_flip()+
  labs(fill='block')+
  theme(axis.title.x=element_blank(),
        axis.text.x=element_blank(),
        axis.ticks.x=element_blank())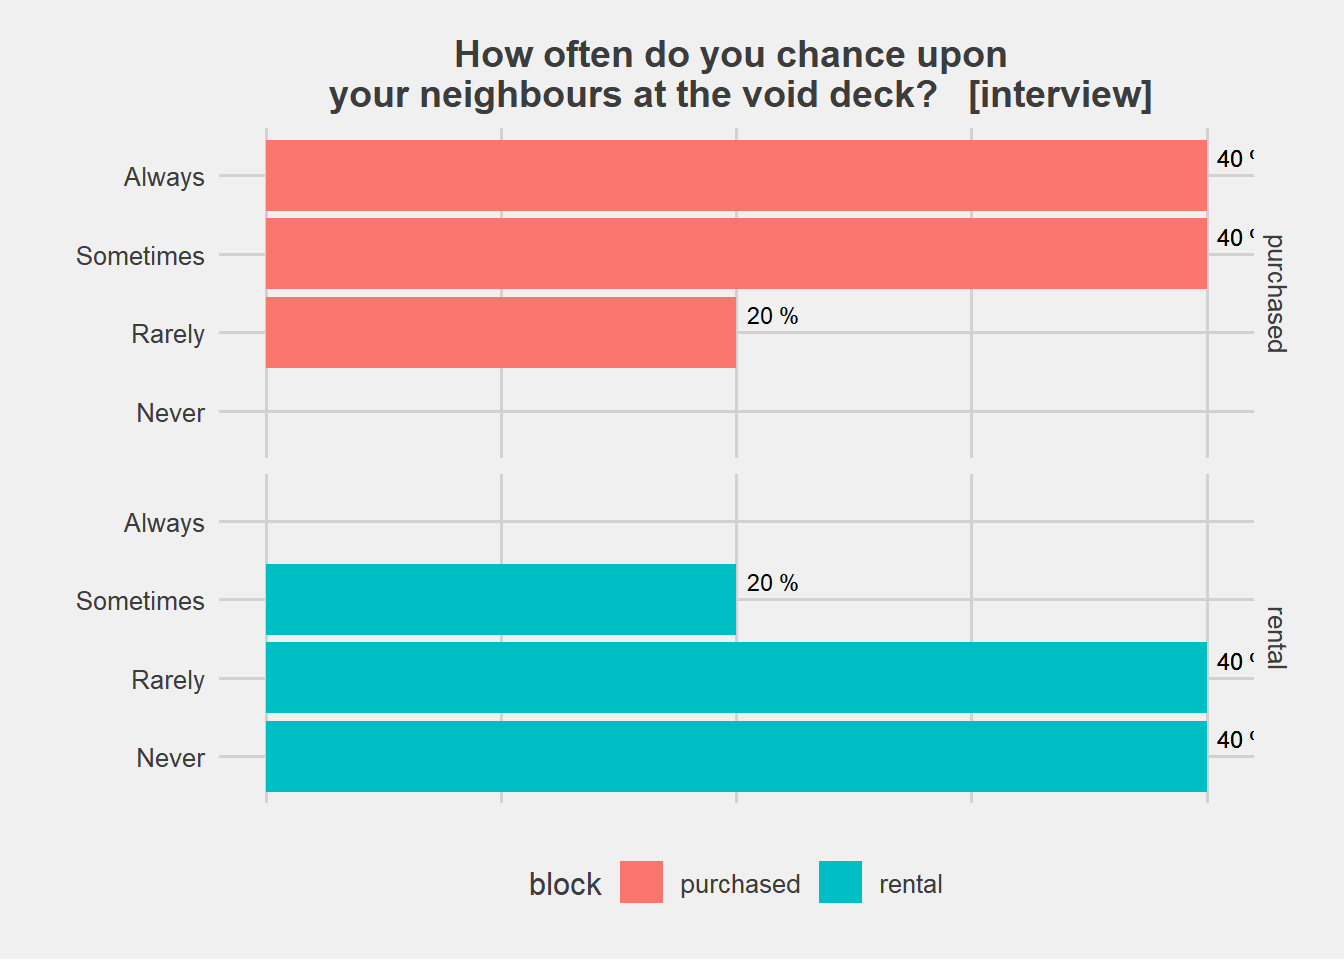
#ggsave("plots/interview/voiddeck_chance_long.png")2.4 How often do you chance upon your neighbours at areas other than the void deck?
interviews %>%
  group_by(which_block_are_you_from) %>%
  mutate(total_block = n()) %>%
  group_by(how_often_do_you_encounter_your_neighbours_by_chance_at_areas_other_than_the_void_deck,which_block_are_you_from) %>%
  mutate(perc_label = paste(round(n()/total_block*100,1),"%")) %>%
  mutate(perc = n()/total_block*100) %>%
  ggplot(aes((how_often_do_you_encounter_your_neighbours_by_chance_at_areas_other_than_the_void_deck), fill=which_block_are_you_from))+
  geom_bar(aes(y = perc),stat="identity",position="dodge")+
  geom_text(aes(y=perc,label=perc_label),position=position_dodge(width=0.9),vjust=-0.5, hjust=-0.2,size=3,color="black")+
  theme_fivethirtyeight() +
  labs(title="How often do you chance upon your neighbours at areas other than the void deck?   [interview]") +
  theme(plot.title = element_text(size=14, hjust=0.5))+
  theme(axis.title = element_text()) + xlab('') + ylab('') + labs(fill='block') +
  facet_wrap(which_block_are_you_from~.)+
  aes(fill = which_block_are_you_from)+
  coord_flip()+
  labs(fill='block')+
  theme(axis.title.x=element_blank(),
        axis.text.x=element_blank(),
        axis.ticks.x=element_blank())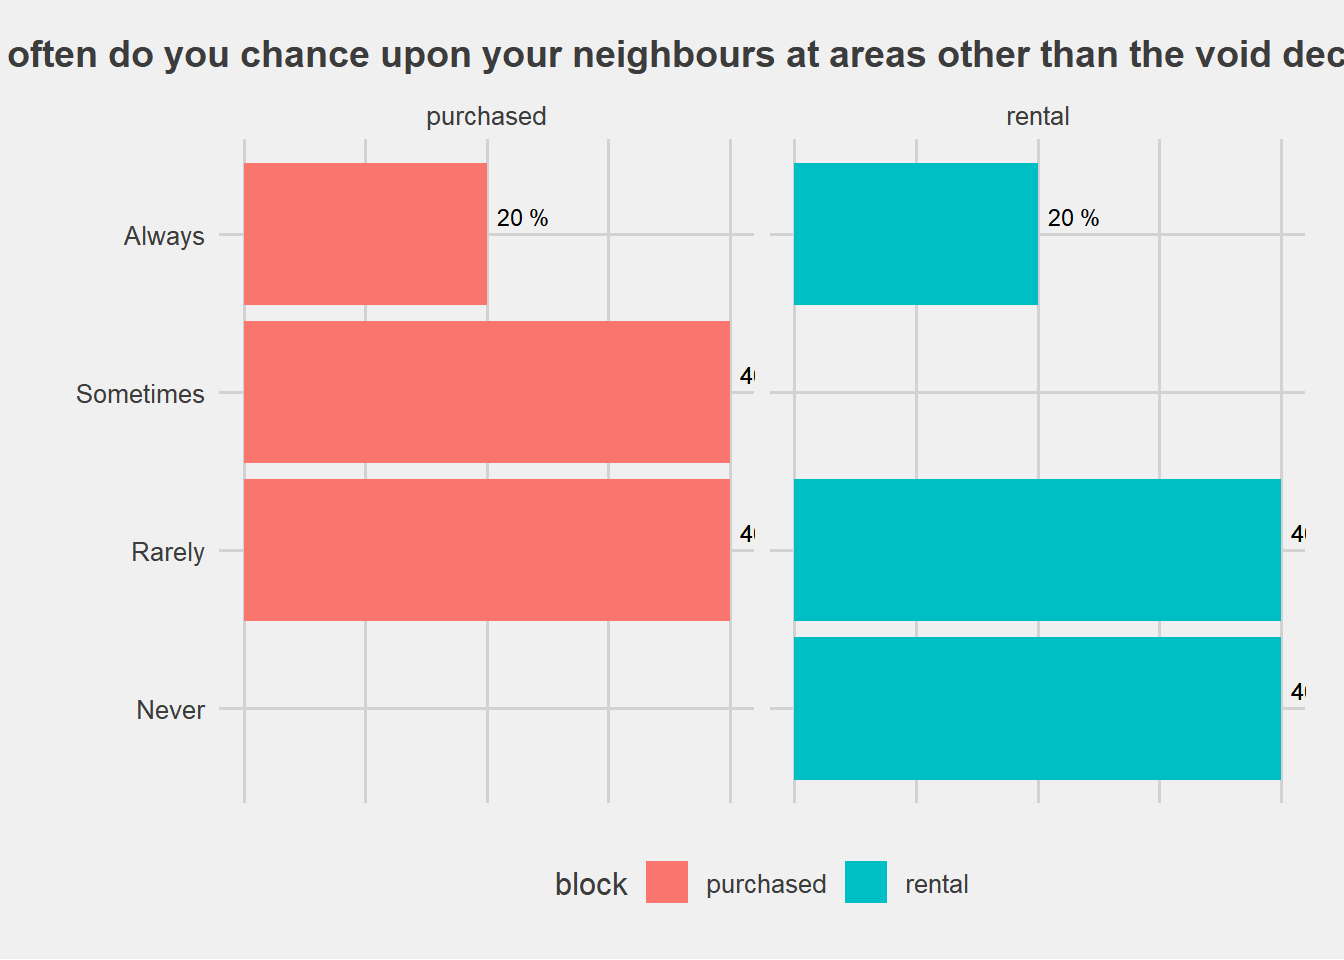
#ggsave("plots/interview/other_than_voiddeck_chance.png")2.5 Do you interact with your neighbours when you meet them?
interviews %>%
  group_by(which_block_are_you_from) %>%
  mutate(total_block = n()) %>%
  group_by(do_you_interact_with_your_neighbours_when_you_meet_them,which_block_are_you_from) %>%
  mutate(perc_label = paste(round(n()/total_block*100,1),"%")) %>%
  mutate(perc = n()/total_block*100) %>%
  ggplot(aes((do_you_interact_with_your_neighbours_when_you_meet_them), fill=which_block_are_you_from))+
  geom_bar(aes(y = perc),stat="identity",position="dodge")+
  geom_text(aes(y=perc,label=perc_label),position=position_dodge(width=0.9),vjust=-0.5, hjust=-0.2,size=3,color="black")+
  theme_fivethirtyeight() +
  labs(title="Do you interact with your neighbours \n when you meet them?   [interview]") +
  theme(plot.title = element_text(size=14, hjust=0.5))+
  theme(axis.title = element_text()) + xlab('') + ylab('count') + labs(fill='block')+
  theme(axis.title.y=element_blank(),
        axis.text.y=element_blank(),
        axis.ticks.y=element_blank())+
  scale_x_discrete(breaks=c("TRUE","FALSE"),
        labels=c("Yes","No"))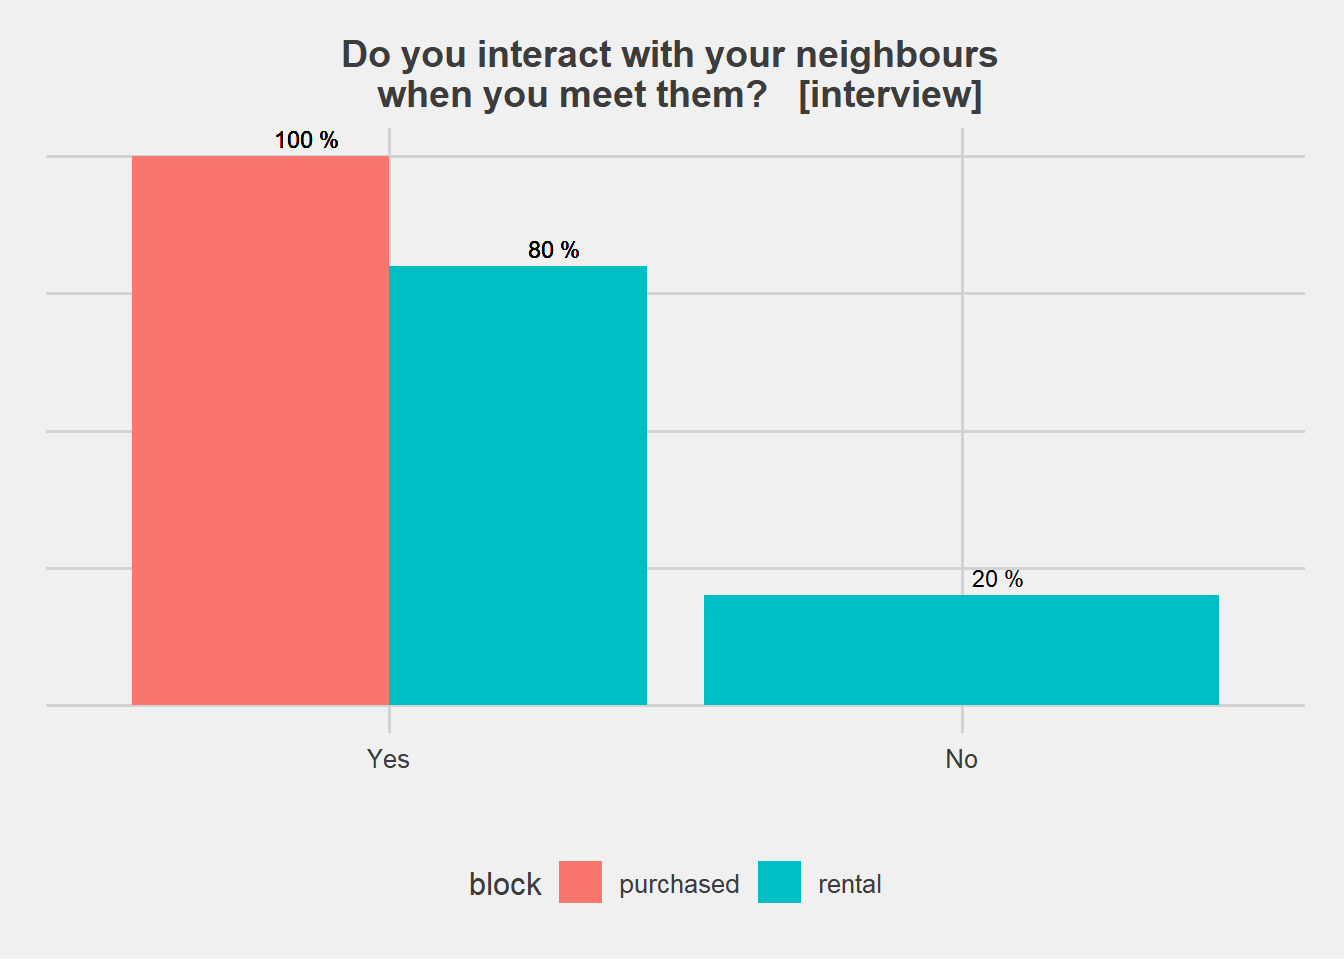
#ggsave("plots/interview/interact_yes_no.png")2.6 Do you interact with residents of the other block?
interviews %>%
  group_by(which_block_are_you_from) %>%
  mutate(total_block = n()) %>%
  group_by(do_you_interact_with_residents_of,which_block_are_you_from) %>%
  mutate(perc_label = paste(round(n()/total_block*100,1),"%")) %>%
  mutate(perc = n()/total_block*100) %>%
  ggplot(aes((do_you_interact_with_residents_of), fill=which_block_are_you_from))+
  geom_bar(aes(y = perc),stat="identity",position="dodge")+
  geom_text(aes(y=perc,label=perc_label),position=position_dodge(width=0.9),vjust=-0.5, hjust=-0.2,size=3,color="black")+
  theme_fivethirtyeight() +
  labs(title="Do you interact with residents of the other block?   [interview]") +
  theme(plot.title = element_text(size=14, hjust=0.5))+
  theme(axis.title = element_text()) + xlab('') + ylab('count') + labs(fill='block')+
  theme(axis.title.y=element_blank(),
        axis.text.y=element_blank(),
        axis.ticks.y=element_blank())+
  scale_x_discrete(breaks=c("TRUE","FALSE"),
        labels=c("Yes","No"))
#ggsave("plots/interview/interact_other_block_yes_no.png")2.7 Do you know of the integrated block model?
interviews %>%
  group_by(which_block_are_you_from) %>%
  mutate(total_block = n()) %>%
  group_by(do_you_know_about_the_new_integrated_block,which_block_are_you_from) %>%
  mutate(perc_label = paste(round(n()/total_block*100,1),"%")) %>%
  mutate(perc = n()/total_block*100) %>%
  ggplot(aes((as.factor(do_you_know_about_the_new_integrated_block)), fill=which_block_are_you_from))+
  geom_bar(aes(y = perc),stat="identity",position="dodge")+
  geom_text(aes(y=perc,label=perc_label),position=position_dodge(width=0.9),vjust=-0.5, hjust=-0.2,size=3,color="black")+
  theme_fivethirtyeight() +
  labs(title="Do you know of the integrated block model?   [interview]") +
  theme(plot.title = element_text(size=14, hjust=0.5))+
  theme(axis.title = element_text()) + xlab('') + ylab('count') + labs(fill='block')+
  theme(axis.title.y=element_blank(),
        axis.text.y=element_blank(),
        axis.ticks.y=element_blank())+
  scale_x_discrete(breaks=c("TRUE","FALSE"),
        labels=c("Yes","No"))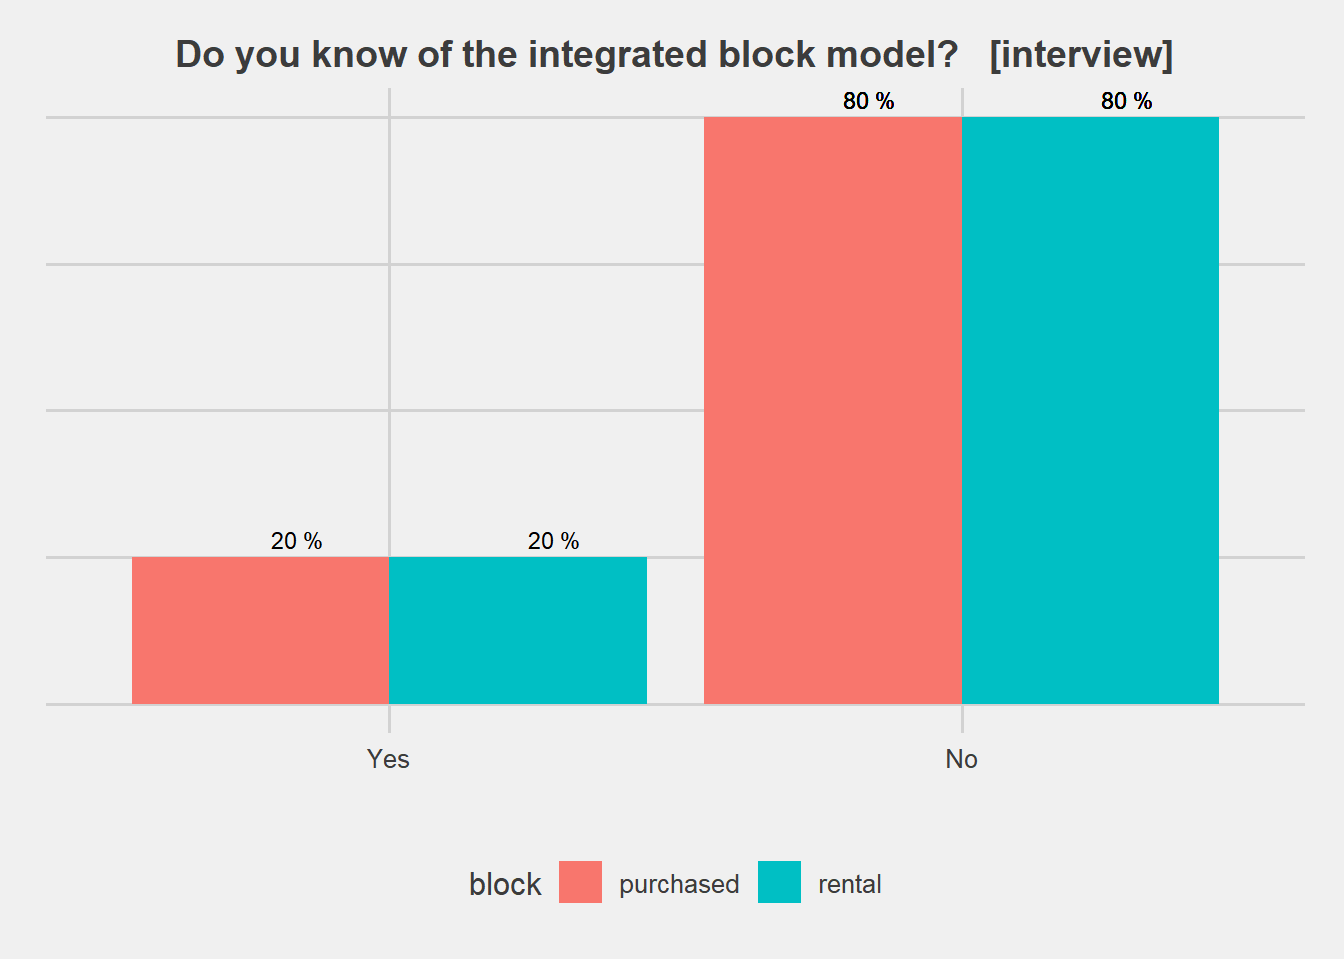
#ggsave("plots/interview/integrated_block_yes_no.png")2.8 Do you use the precinct pavilion?
interviews %>%
  group_by(which_block_are_you_from) %>%
  mutate(total_block = n()) %>%
  group_by(do_you_use_the_precinct_pavilion,which_block_are_you_from) %>%
  mutate(perc_label = paste(round(n()/total_block*100,1),"%")) %>%
  mutate(perc = n()/total_block*100) %>%
  ggplot(aes((do_you_use_the_precinct_pavilion), fill=which_block_are_you_from))+
  geom_bar(aes(y = perc),stat="identity",position="dodge")+
  geom_text(aes(y=perc,label=perc_label),position=position_dodge(width=0.9),vjust=-0.5, hjust=0.43,size=3,color="black")+
  theme_fivethirtyeight() +
  labs(title="Do you use the precinct pavilion?   [interview]") +
  theme(plot.title = element_text(size=14, hjust=0.5))+
  theme(axis.title = element_text()) + xlab('') + ylab('count') + labs(fill='block')+
  theme(axis.title.y=element_blank(),
        axis.text.y=element_blank(),
        axis.ticks.y=element_blank()) +
  scale_x_discrete(breaks=c("TRUE","FALSE"),
        labels=c("Yes","No"))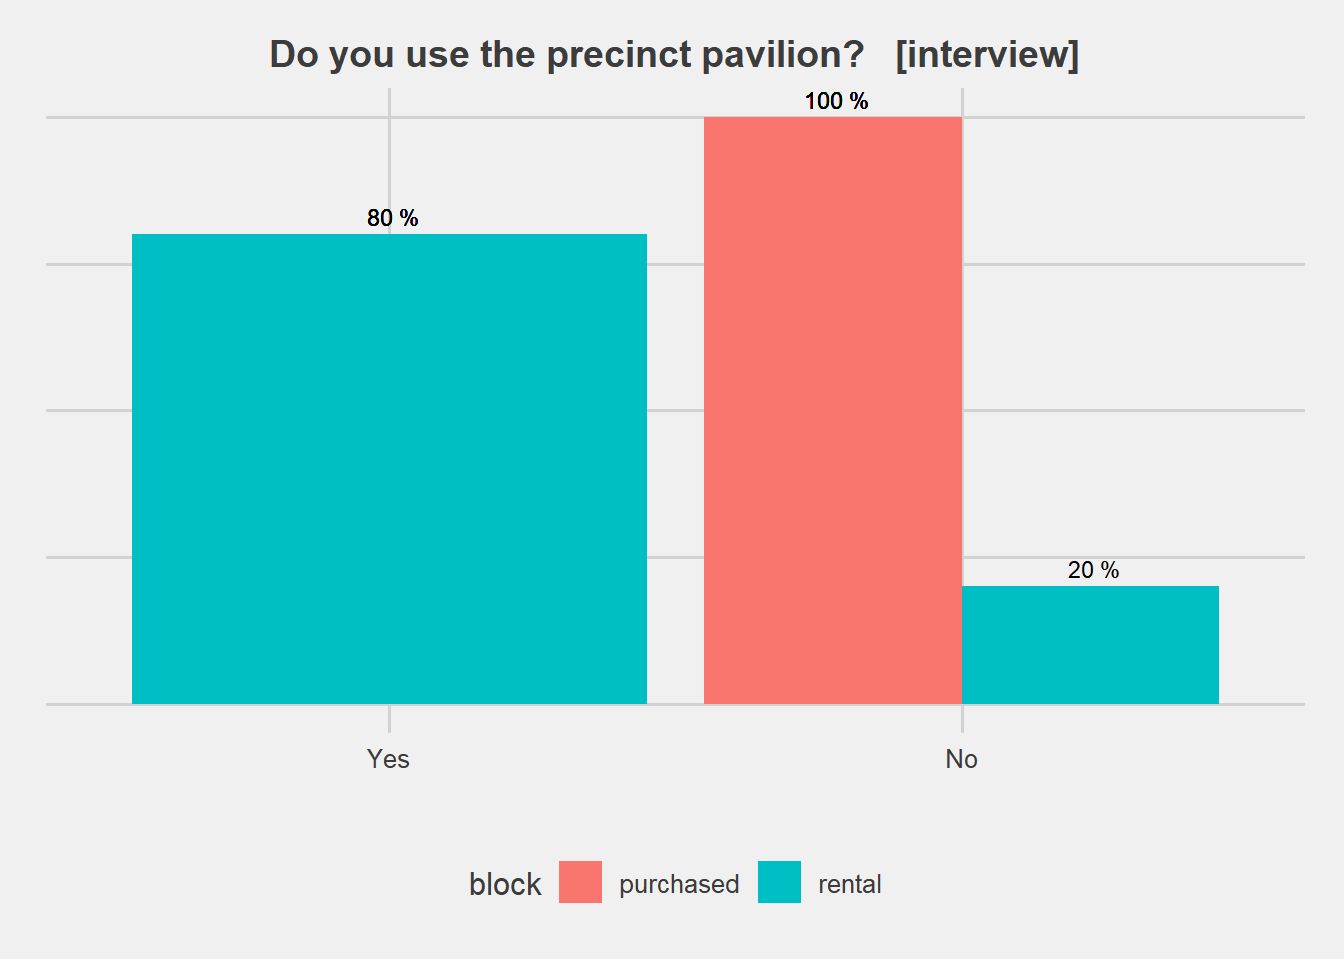
#ggsave("plots/interview/PP_yes_no.png")2.9 Perception of void deck
2.9.1 Perception of void deck (rental block)
library(reshape2)
library(RColorBrewer)
library(data.table)
library(RColorBrewer)
library(psych)

# rename likert columns
interviews <- interviews %>%
  rename(comfortable = it_is_comfortable_to_stay_at_the_void_deck_for_long_periods_of_time,
         seating = there_are_enough_seating_areas_at_the_void_deck,
         `chance encounters`= the_void_deck_facilitates_chance_encounters,
         `group activities` = the_void_deck_is_a_conducive_space_for_group_activities,
         `willingness to live in integrated block` = would_you_want_to_live_in_an_integrated_block,
         `willingness to interact in integrated block`= are_you_willing_to_interact_with_the_residents_in_the_integrated_block)

rental_interviews <- interviews %>%
  filter(which_block_are_you_from=="rental")
likert_data <- as.data.frame(rental_interviews[,9:12])
likert_data_proportions <- as.data.frame(response.frequencies(likert_data, uniqueitems = 1:5))
likert_data_proportions <- likert_data_proportions %>%
  mutate(Question=c("Comfortable","Availability of seating areas","Facilitates chance encounters","Facilitates group activities"))
likert_data_proportions <- likert_data_proportions[c("Question","1","2","3","4","5","miss")]
colnames(likert_data_proportions)<-c("Question","Strongly Disagree","Disagree","Neutral","Agree","Strongly Agree","Unanswered")


# Append missing levels
likert_data_proportions %>% group_by(Question) %>% mutate(value = value / sum(value)) %>%
  ggplot(aes(x = Question, y = ifelse(ind %in% 1:2, -value, value), fill = ind)) +
  geom_col() +
  coord_flip()

mytitle<-"Perception of void deck (rental block)"
mylevels<-c("Strongly Disagree","Disagree","Neutral","Agree","Strongly Agree")
tab <- likert_data_proportions[-7]
numlevels<-length(tab[1,])-1
numcenter<-ceiling(numlevels/2)+1
tab$midvalues<-tab[,numcenter]/2
tab2<-cbind(tab[,1],tab[,2:ceiling(numlevels/2)],
            tab$midvalues,tab$midvalues,tab[,numcenter:numlevels+1])
colnames(tab2)<-c("Aspect",mylevels[1:floor(numlevels/2)],"midlow",
                  "midhigh",mylevels[numcenter:numlevels])

numlevels<-length(mylevels)+1
point1<-2
point2<-((numlevels)/2)+1
point3<-point2+1
point4<-numlevels+1
mymin<-(ceiling(max(rowSums(tab2[,point1:point2]))*4)/4)*-100
mymax<-(ceiling(max(rowSums(tab2[,point3:point4]))*4)/4)*100

numlevels<-length(tab[1,])-1
temp.rows<-length(tab2[,1])
pal<-brewer.pal((numlevels-1),"RdBu")
pal[ceiling(numlevels/2)]<-"#DFDFDF"
legend.pal<-pal
pal<-c(pal[1:(ceiling(numlevels/2)-1)], pal[ceiling(numlevels/2)],
       pal[ceiling(numlevels/2)], pal[(ceiling(numlevels/2)+1):(numlevels-1)])

tab3<-reshape2::melt(tab2,id="Aspect")
tab3$col<-rep(pal,each=temp.rows)
tab3$value<-tab3$value*100
tab3$Aspect<-str_wrap(tab3$Aspect, width = 40)
tab3$Aspect<-factor(tab3$Aspect, levels = tab2$Aspect[order(-(tab2[,5]+tab2[,6]+tab2[,7]))])
highs<-na.omit(tab3[(length(tab3[,1])/2)+1:length(tab3[,1]),])
lows<-na.omit(tab3[1:(length(tab3[,1])/2),])
lows <- lows[rev(rownames(lows)),]
lows$col <- factor(lows$col, levels = c("#CA0020","#F4A582", "#DFDFDF"))
ggplot() + geom_bar(data=highs, aes(x = Aspect, y=value, fill=col), position="stack", stat="identity") +
  geom_bar(data=lows, aes(x = Aspect, y=-value, fill=col), position="stack", stat="identity") +
  geom_hline(yintercept = 0, color =c("white")) +
  scale_fill_identity("Percent", labels = mylevels, breaks=legend.pal, guide="legend") +
  theme_fivethirtyeight() +
  coord_flip() +
  labs(title=mytitle, y="",x="") +
  theme(plot.title = element_text(size=14, hjust=0.5)) +
  theme(axis.text.y = element_text(hjust=0)) +
  theme(legend.position = "bottom") +
  scale_y_continuous(breaks=seq(mymin,mymax,25), limits=c(mymin,mymax))

#ggsave("plots/interview/likert_void_deck_rental.png")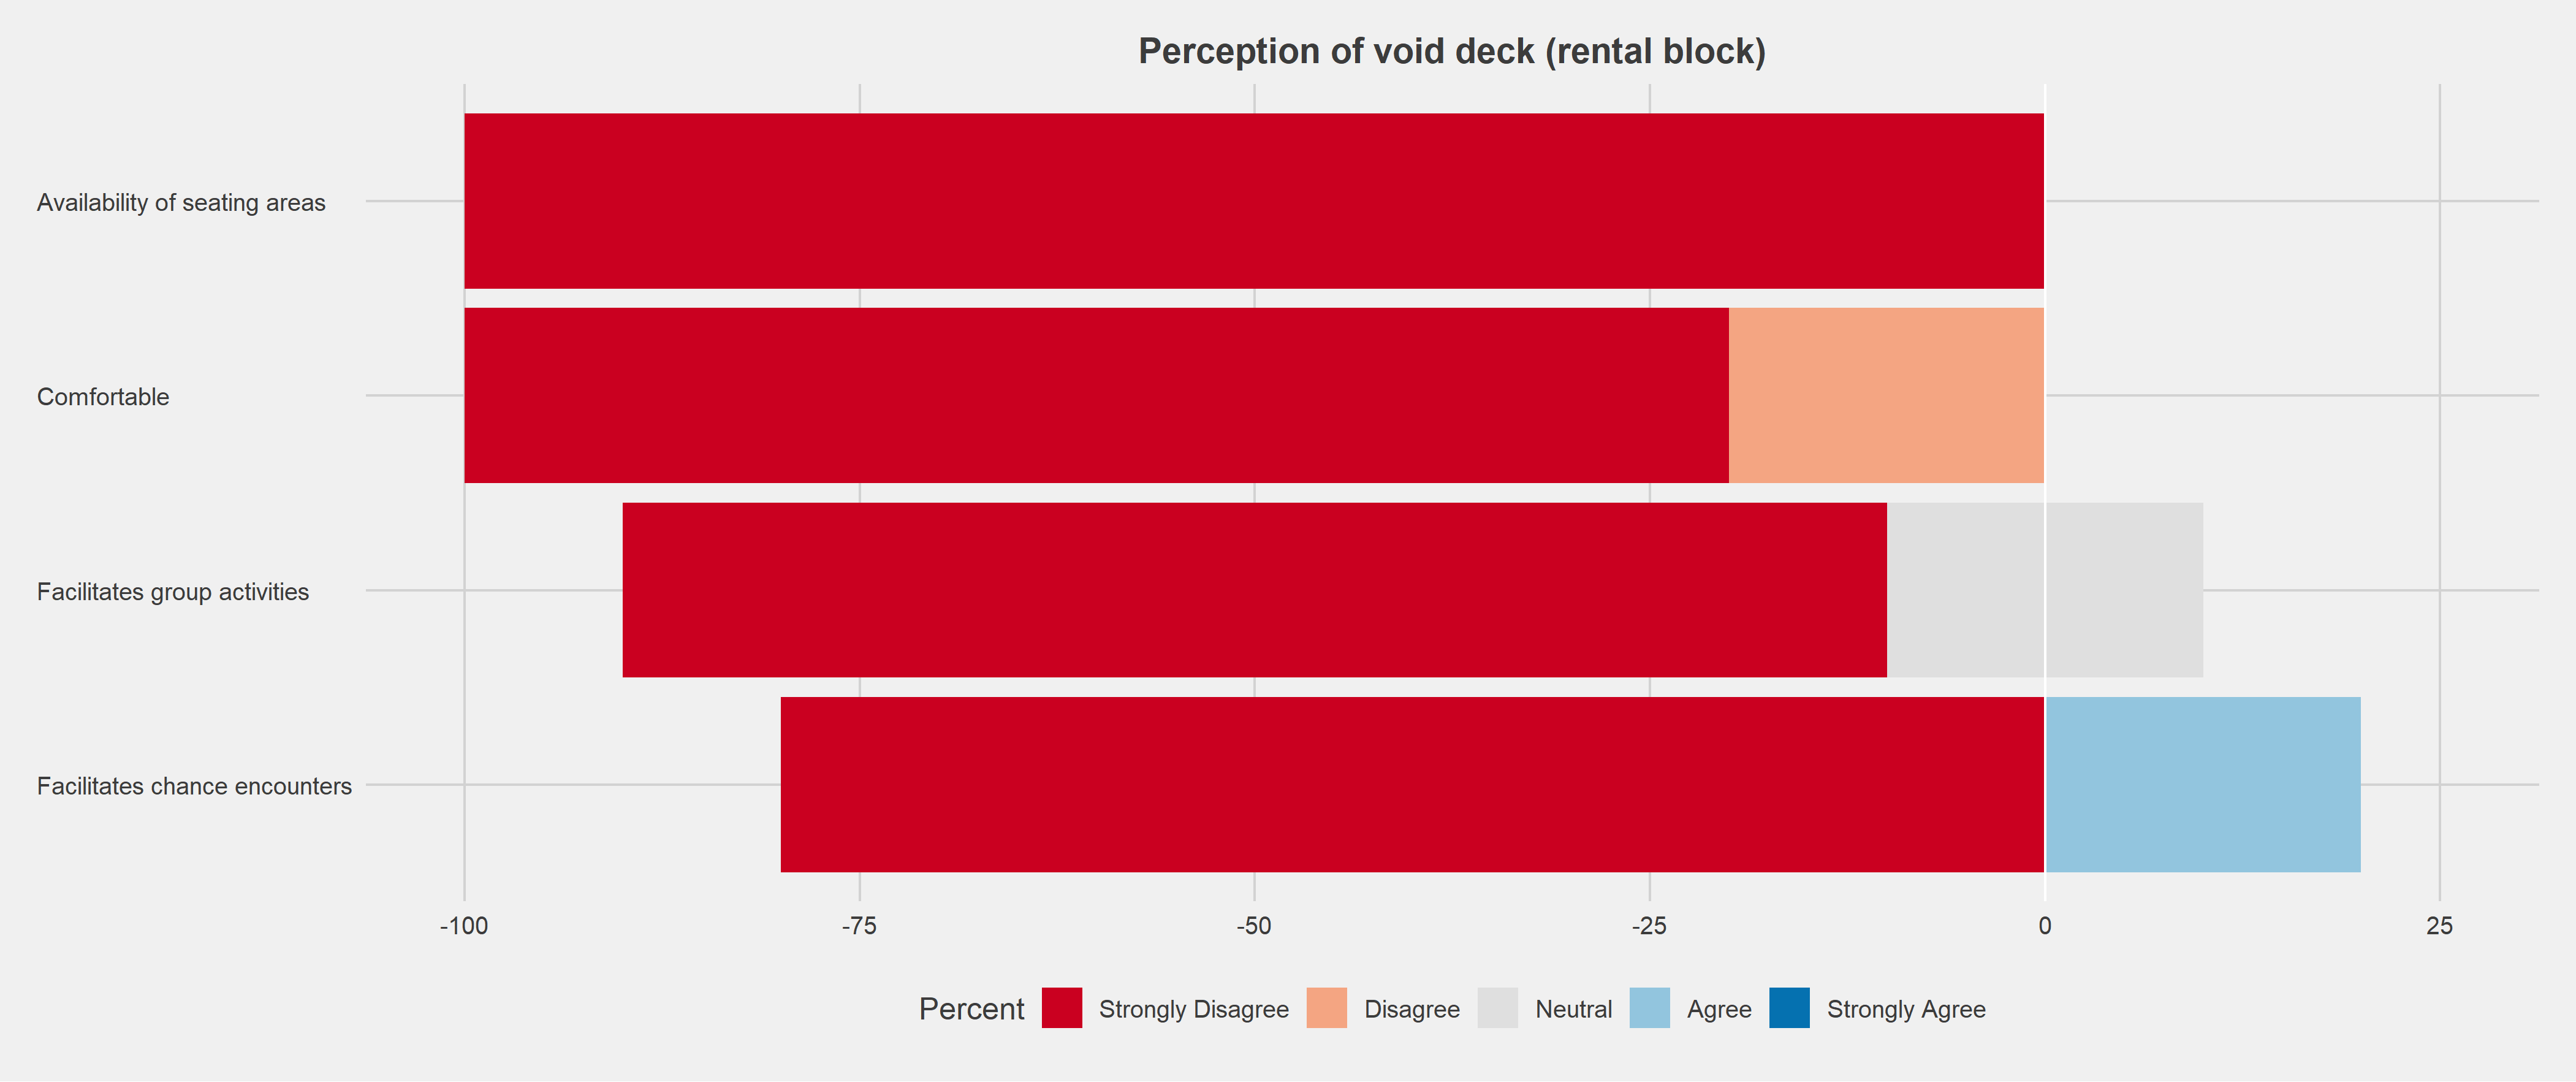
2.9.2 Perception of void deck (purchased block)
purchased_interviews <- interviews %>%
  filter(which_block_are_you_from=="purchased")
likert_data <- as.data.frame(purchased_interviews[,9:12])
likert_data_proportions <- as.data.frame(response.frequencies(likert_data, uniqueitems = 1:5))
likert_data_proportions <- likert_data_proportions %>%
  mutate(Question=c("Comfortable","Availability of seating areas","Facilitates chance encounters","Facilitates group activities"))
likert_data_proportions <- likert_data_proportions[c("Question","1","2","3","4","5","miss")]
colnames(likert_data_proportions)<-c("Question","Strongly Disagree","Disagree","Neutral","Agree","Strongly Agree","Unanswered")


# Append missing levels
likert_data_proportions %>% group_by(Question) %>% mutate(value = value / sum(value)) %>%
  ggplot(aes(x = Question, y = ifelse(ind %in% 1:2, -value, value), fill = ind)) +
  geom_col() +
  coord_flip()

mytitle<-"Perception of void deck (purchased block)"
mylevels<-c("Strongly Disagree","Disagree","Neutral","Agree","Strongly Agree")
tab <- likert_data_proportions[-7]
numlevels<-length(tab[1,])-1
numcenter<-ceiling(numlevels/2)+1
tab$midvalues<-tab[,numcenter]/2
tab2<-cbind(tab[,1],tab[,2:ceiling(numlevels/2)],
            tab$midvalues,tab$midvalues,tab[,numcenter:numlevels+1])
colnames(tab2)<-c("Aspect",mylevels[1:floor(numlevels/2)],"midlow",
                  "midhigh",mylevels[numcenter:numlevels])

numlevels<-length(mylevels)+1
point1<-2
point2<-((numlevels)/2)+1
point3<-point2+1
point4<-numlevels+1
mymin<-(ceiling(max(rowSums(tab2[,point1:point2]))*4)/4)*-100
mymax<-(ceiling(max(rowSums(tab2[,point3:point4]))*4)/4)*100

numlevels<-length(tab[1,])-1
temp.rows<-length(tab2[,1])
pal<-brewer.pal((numlevels-1),"RdBu")
pal[ceiling(numlevels/2)]<-"#DFDFDF"
legend.pal<-pal
pal<-c(pal[1:(ceiling(numlevels/2)-1)], pal[ceiling(numlevels/2)],
       pal[ceiling(numlevels/2)], pal[(ceiling(numlevels/2)+1):(numlevels-1)])

tab3<-reshape2::melt(tab2,id="Aspect")
tab3$col<-rep(pal,each=temp.rows)
tab3$value<-tab3$value*100
tab3$Aspect<-str_wrap(tab3$Aspect, width = 40)
tab3$Aspect<-factor(tab3$Aspect, levels = tab2$Aspect[order(-(tab2[,5]+tab2[,6]+tab2[,7]))])
highs<-na.omit(tab3[(length(tab3[,1])/2)+1:length(tab3[,1]),])
lows<-na.omit(tab3[1:(length(tab3[,1])/2),])
lows <- lows[rev(rownames(lows)),]
lows$col <- factor(lows$col, levels = c("#CA0020","#F4A582", "#DFDFDF"))
ggplot() + geom_bar(data=highs, aes(x = Aspect, y=value, fill=col), position="stack", stat="identity") +
  geom_bar(data=lows, aes(x = Aspect, y=-value, fill=col), position="stack", stat="identity") +
  geom_hline(yintercept = 0, color =c("white")) +
  scale_fill_identity("Percent", labels = mylevels, breaks=legend.pal, guide="legend") +
  theme_fivethirtyeight() +
  coord_flip() +
  labs(title=mytitle, y="",x="") +
  theme(plot.title = element_text(size=14, hjust=0.5)) +
  theme(axis.text.y = element_text(hjust=0)) +
  theme(legend.position = "bottom") +
  scale_y_continuous(breaks=seq(mymin,mymax,25), limits=c(mymin,mymax))

#ggsave("plots/interview/likert_void_deck_purchased.png")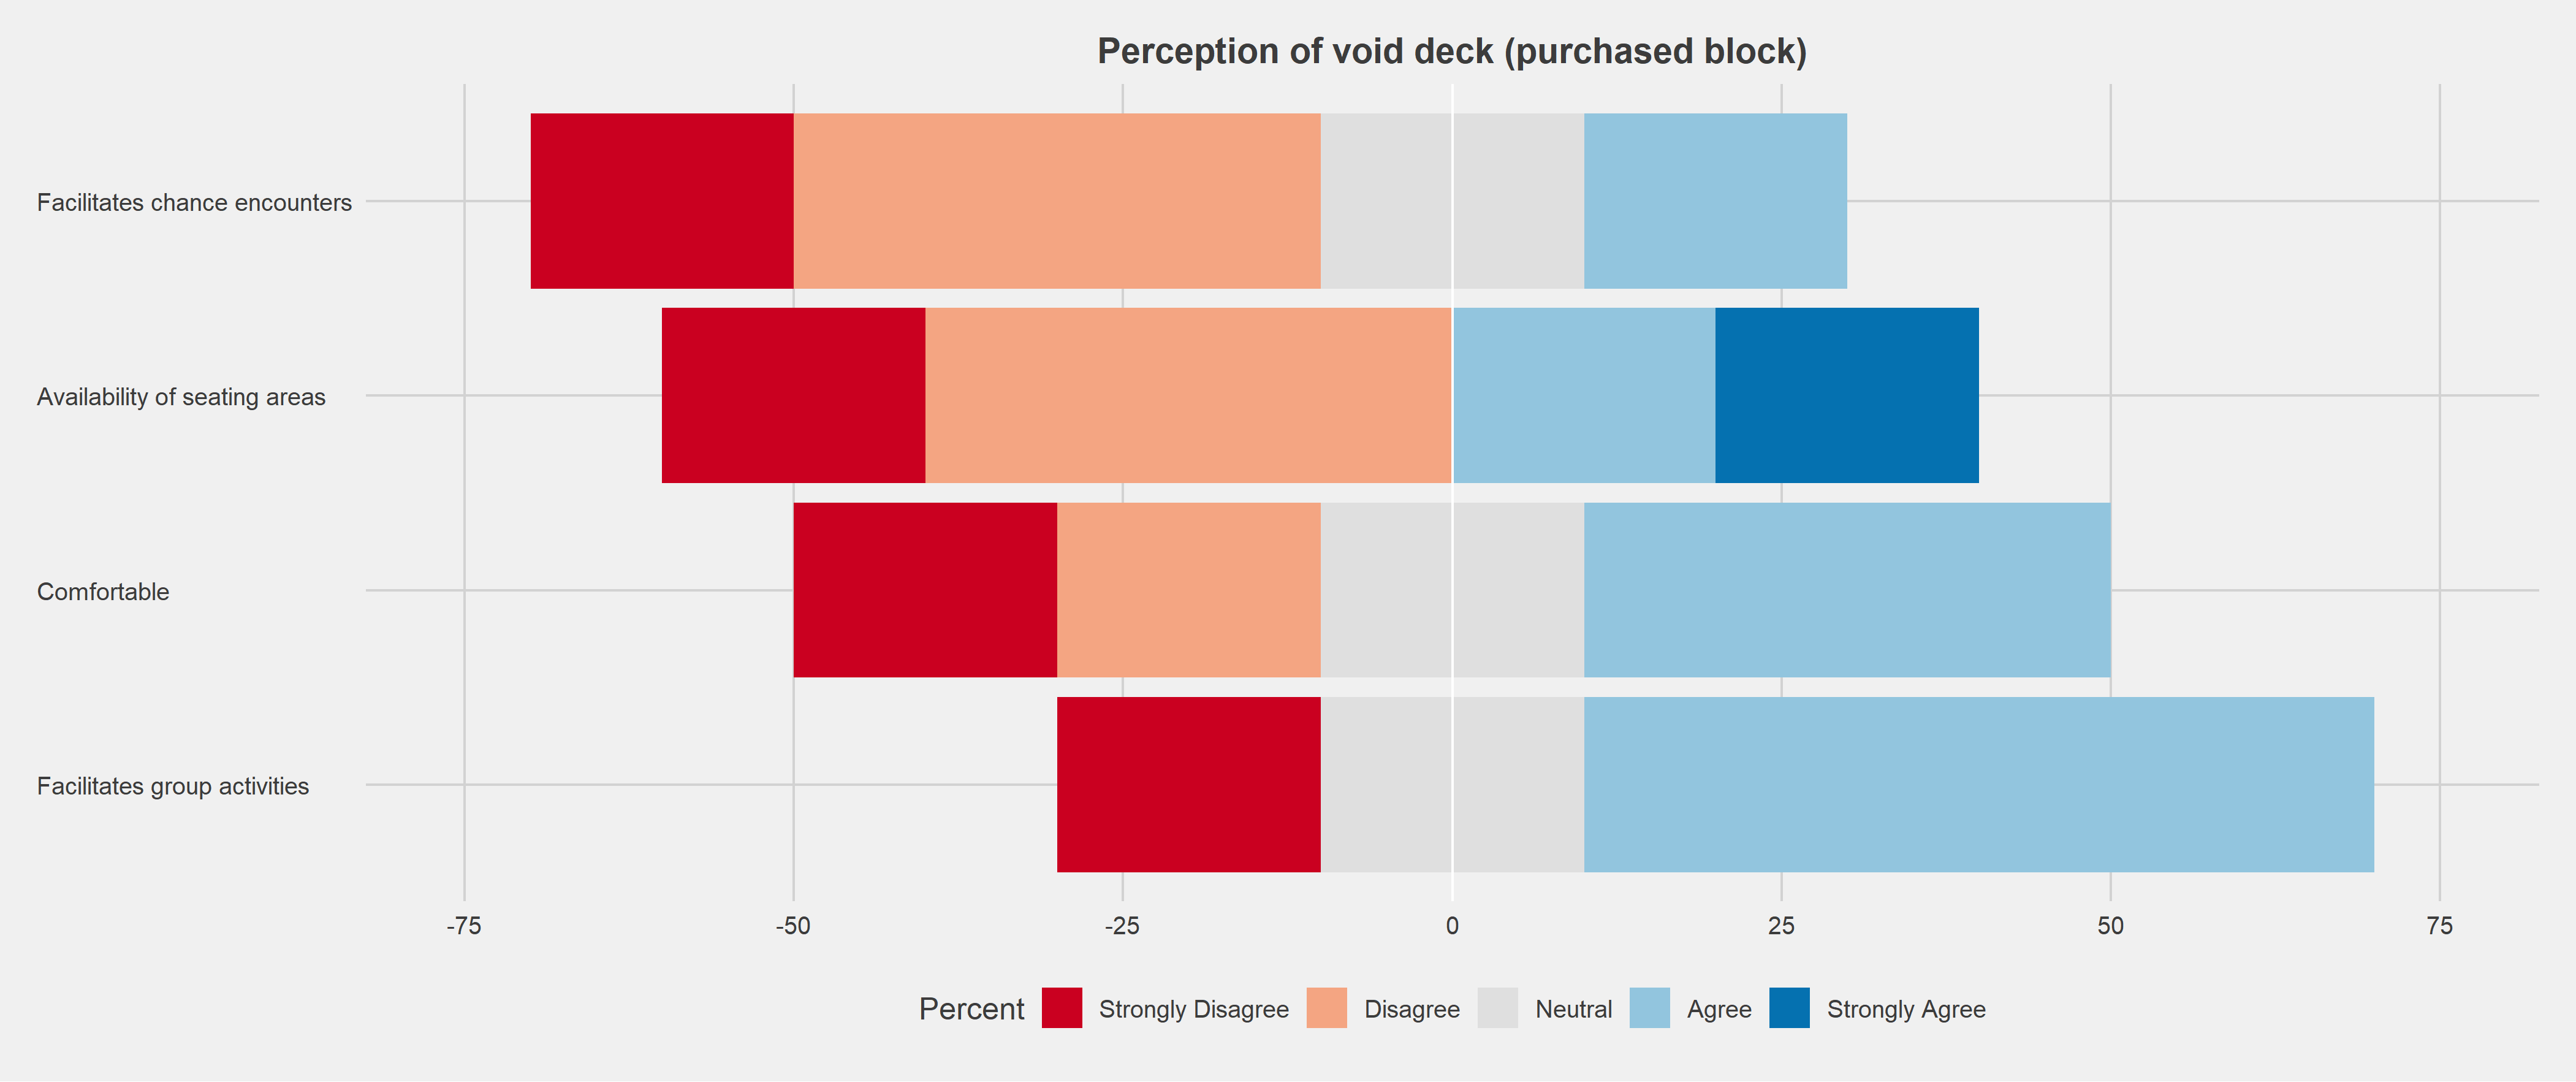
2.10 Perception of integrated block
2.10.1 Perception of integrated block (rental block)
rental_interviews <- interviews %>%
  filter(which_block_are_you_from=="rental")
likert_data <- as.data.frame(rental_interviews[,24:25])
likert_data_proportions <- as.data.frame(response.frequencies(likert_data, uniqueitems = 1:5))
likert_data_proportions <- likert_data_proportions %>%
  mutate(Question=c("Willingness to live in integrated block","Willingness to interact in integrated block"))
likert_data_proportions <- likert_data_proportions[c("Question","1","2","3","4","5","miss")]
colnames(likert_data_proportions)<-c("Question","Strongly Disagree","Disagree","Neutral","Agree","Strongly Agree","Unanswered")


mytitle<-"Perception of integrated block (rental block)"
mylevels<-c("Strongly Disagree","Disagree","Neutral","Agree","Strongly Agree")
tab <- likert_data_proportions[-7]
numlevels<-length(tab[1,])-1
numcenter<-ceiling(numlevels/2)+1
tab$midvalues<-tab[,numcenter]/2
tab2<-cbind(tab[,1],tab[,2:ceiling(numlevels/2)],
            tab$midvalues,tab$midvalues,tab[,numcenter:numlevels+1])
colnames(tab2)<-c("Aspect",mylevels[1:floor(numlevels/2)],"midlow",
                  "midhigh",mylevels[numcenter:numlevels])

numlevels<-length(mylevels)+1
point1<-2
point2<-((numlevels)/2)+1
point3<-point2+1
point4<-numlevels+1
mymin<-(ceiling(max(rowSums(tab2[,point1:point2]))*4)/4)*-100
mymax<-(ceiling(max(rowSums(tab2[,point3:point4]))*4)/4)*100

numlevels<-length(tab[1,])-1
temp.rows<-length(tab2[,1])
pal<-brewer.pal((numlevels-1),"RdBu")
pal[ceiling(numlevels/2)]<-"#DFDFDF"
legend.pal<-pal
pal<-c(pal[1:(ceiling(numlevels/2)-1)], pal[ceiling(numlevels/2)],
       pal[ceiling(numlevels/2)], pal[(ceiling(numlevels/2)+1):(numlevels-1)])

tab3<-reshape2::melt(tab2,id="Aspect")
tab3$col<-rep(pal,each=temp.rows)
tab3$value<-tab3$value*100
tab3$Aspect<-factor(tab3$Aspect, levels = tab2$Aspect[order(-(tab2[,5]+tab2[,6]+tab2[,7]))])
highs<-na.omit(tab3[(length(tab3[,1])/2)+1:length(tab3[,1]),])
lows<-na.omit(tab3[1:(length(tab3[,1])/2),])
lows <- lows[rev(rownames(lows)),]
lows$col <- factor(lows$col, levels = c("#CA0020","#F4A582", "#DFDFDF"))
ggplot() + geom_bar(data=highs, aes(x = Aspect, y=value, fill=col), position="stack", stat="identity") +
  geom_bar(data=lows, aes(x = Aspect, y=-value, fill=col), position="stack", stat="identity") +
  geom_hline(yintercept = 0, color =c("white")) +
  scale_fill_identity("Percent", labels = mylevels, breaks=legend.pal, guide="legend") +
  theme_fivethirtyeight() +
  coord_flip() +
  labs(title=mytitle, y="",x="") +
  theme(plot.title = element_text(size=14, hjust=0.5)) +
  theme(axis.text.y = element_text(hjust=0)) +
  theme(legend.position = "bottom") +
  scale_y_continuous(breaks=seq(mymin,mymax,25), limits=c(mymin,mymax))

#ggsave("plots/interview/likert_integrated_rental.png")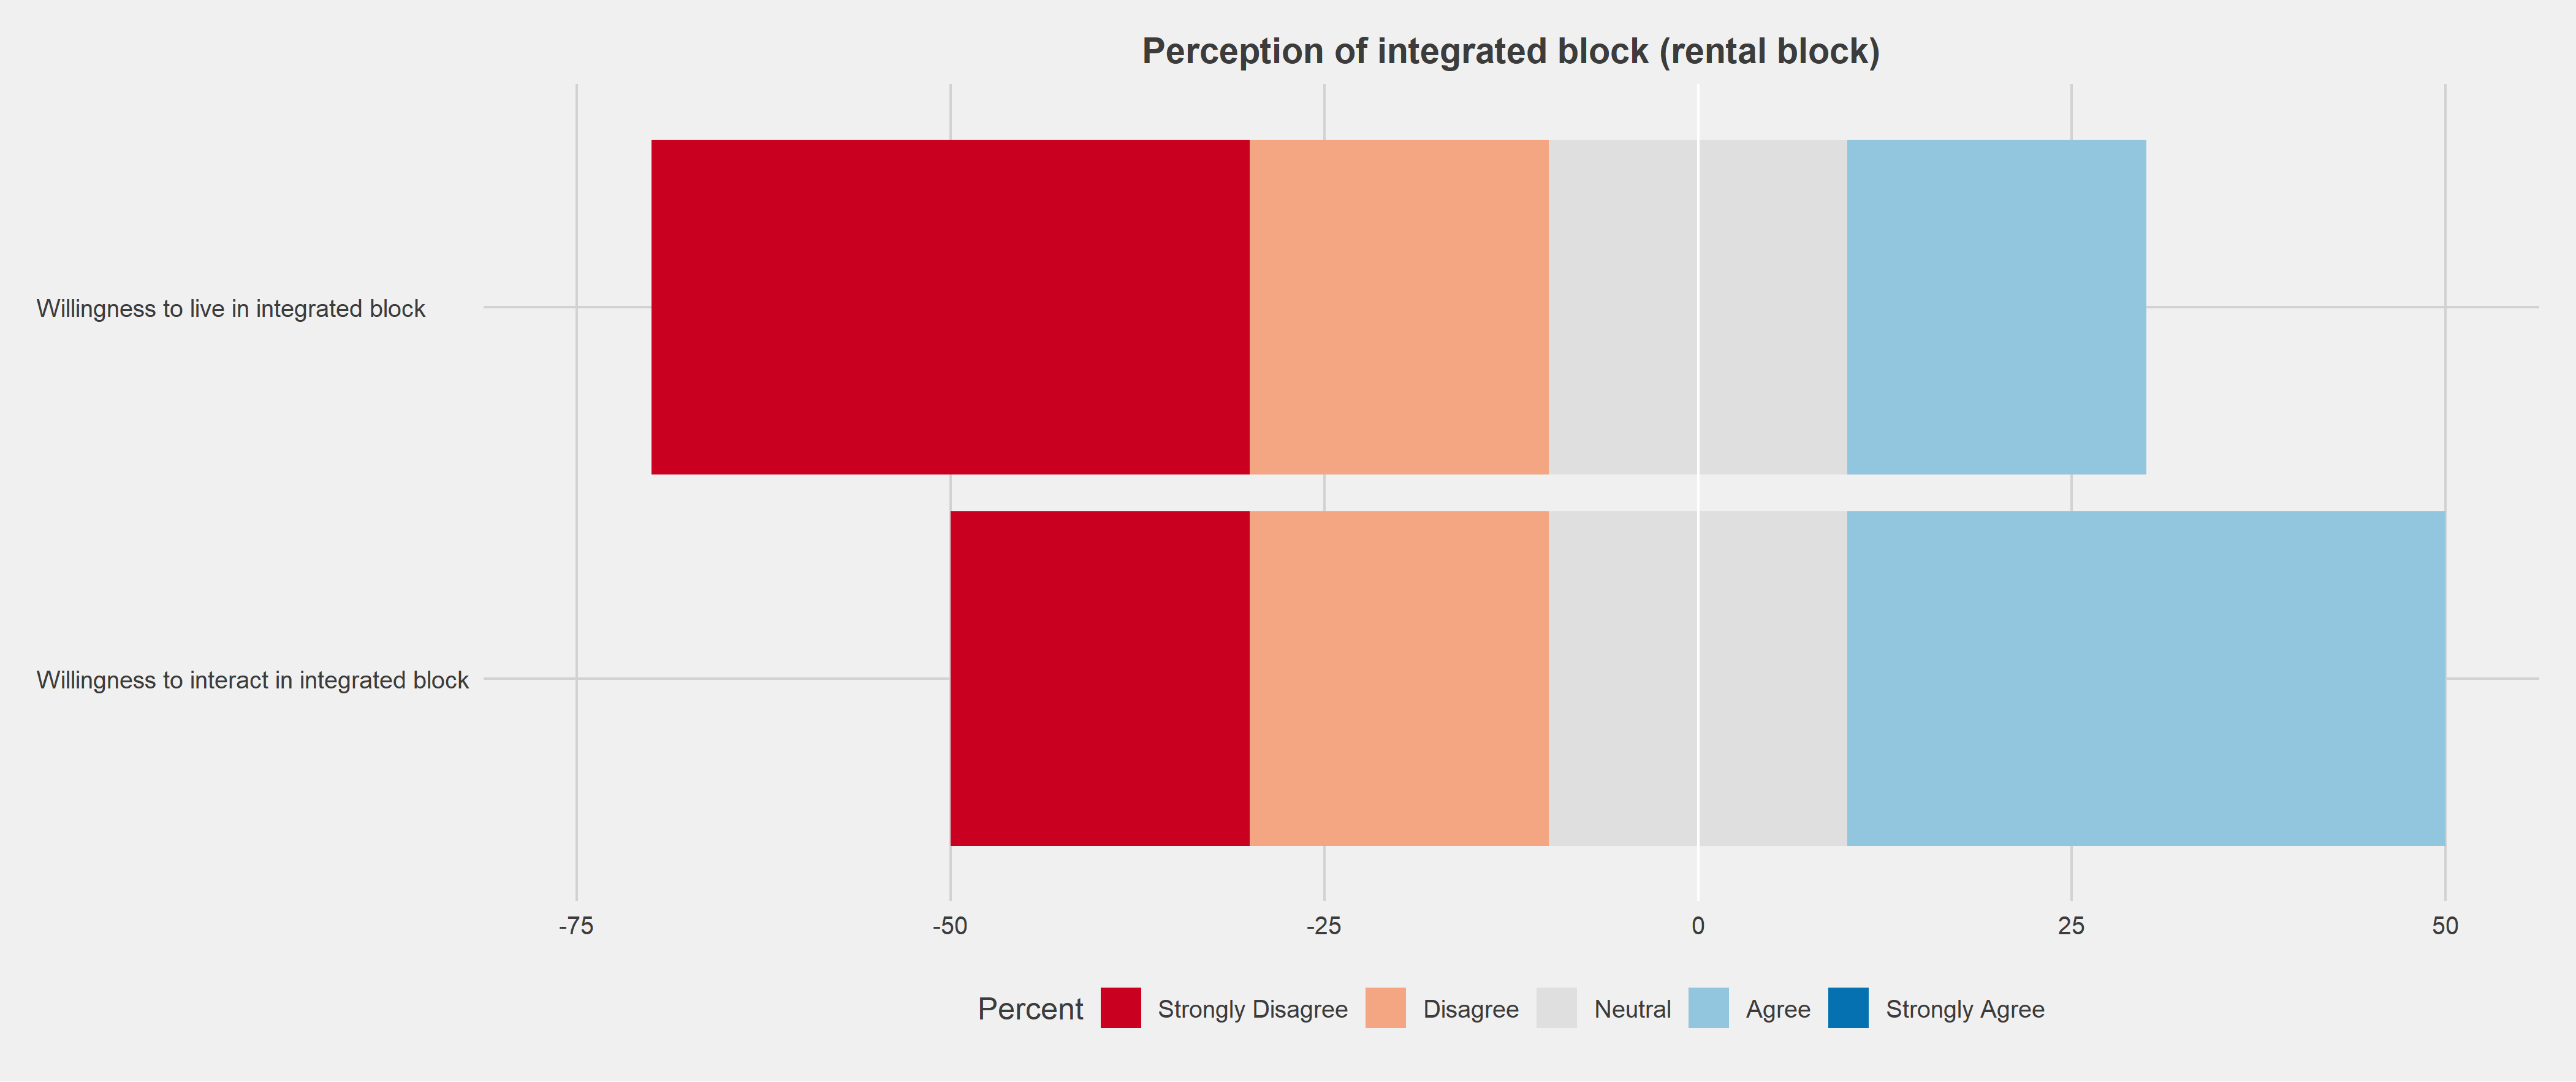
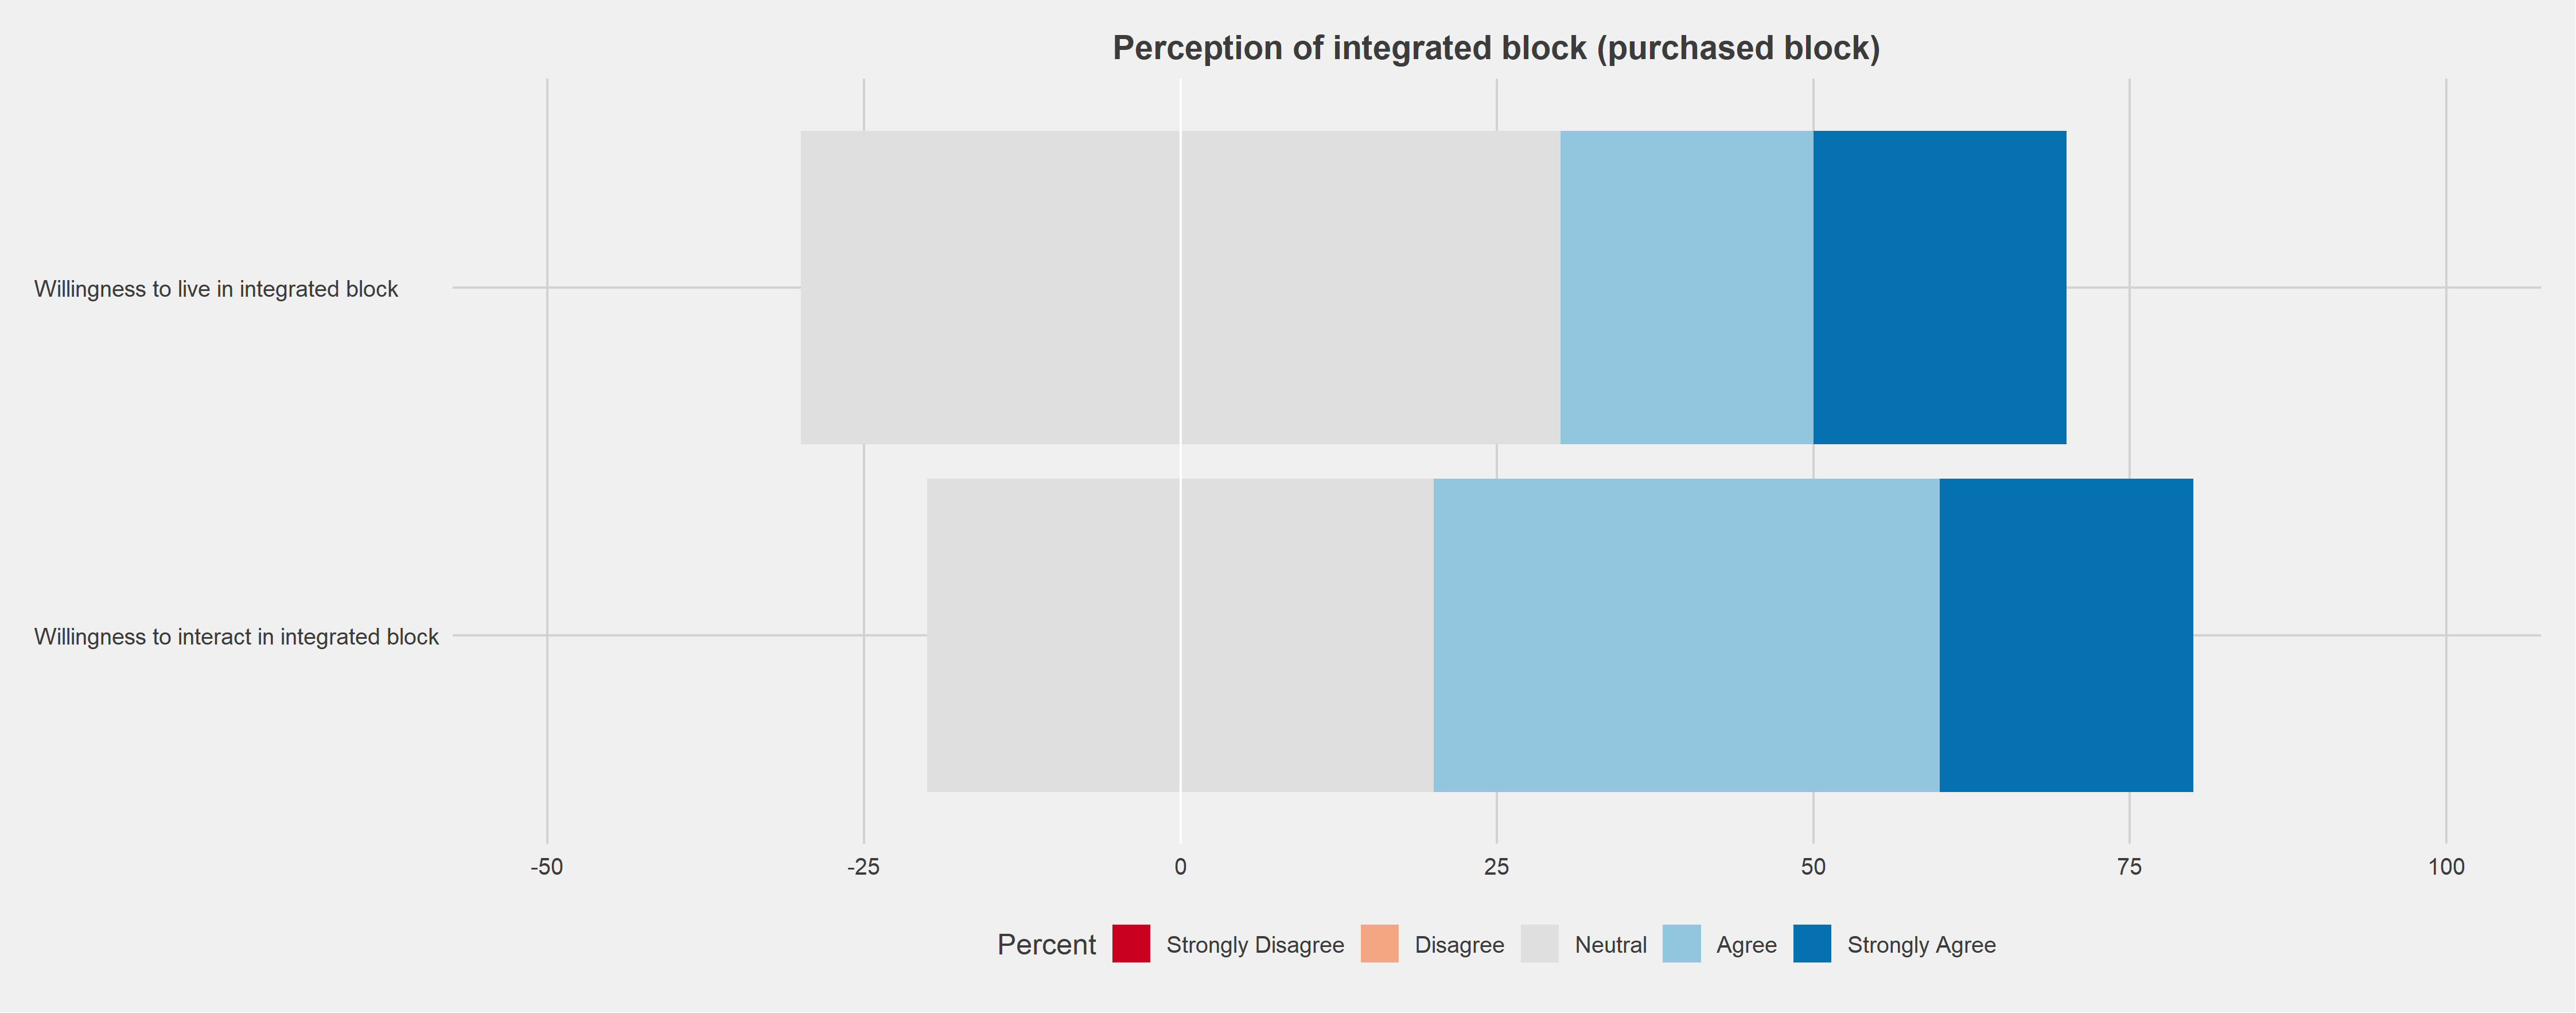
2.11 Perception of integrated block (purchased block)
likert_data <- as.data.frame(purchased_interviews[,24:25])
likert_data_proportions <- as.data.frame(response.frequencies(likert_data, uniqueitems = 1:5))
likert_data_proportions <- likert_data_proportions %>%
  mutate(Question=c("Willingness to live in integrated block","Willingness to interact in integrated block"))
likert_data_proportions <- likert_data_proportions[c("Question","1","2","3","4","5","miss")]
colnames(likert_data_proportions)<-c("Question","Strongly Disagree","Disagree","Neutral","Agree","Strongly Agree","Unanswered")


mytitle<-"Perception of integrated block (purchased block)"
mylevels<-c("Strongly Disagree","Disagree","Neutral","Agree","Strongly Agree")
tab <- likert_data_proportions[-7]
numlevels<-length(tab[1,])-1
numcenter<-ceiling(numlevels/2)+1
tab$midvalues<-tab[,numcenter]/2
tab2<-cbind(tab[,1],tab[,2:ceiling(numlevels/2)],
            tab$midvalues,tab$midvalues,tab[,numcenter:numlevels+1])
colnames(tab2)<-c("Aspect",mylevels[1:floor(numlevels/2)],"midlow",
                  "midhigh",mylevels[numcenter:numlevels])

numlevels<-length(mylevels)+1
point1<-2
point2<-((numlevels)/2)+1
point3<-point2+1
point4<-numlevels+1
mymin<-(ceiling(max(rowSums(tab2[,point1:point2]))*4)/4)*-100
mymax<-(ceiling(max(rowSums(tab2[,point3:point4]))*4)/4)*100

numlevels<-length(tab[1,])-1
temp.rows<-length(tab2[,1])
pal<-brewer.pal((numlevels-1),"RdBu")
pal[ceiling(numlevels/2)]<-"#DFDFDF"
legend.pal<-pal
pal<-c(pal[1:(ceiling(numlevels/2)-1)], pal[ceiling(numlevels/2)],
       pal[ceiling(numlevels/2)], pal[(ceiling(numlevels/2)+1):(numlevels-1)])

tab3<-reshape2::melt(tab2,id="Aspect")
tab3$col<-rep(pal,each=temp.rows)
tab3$value<-tab3$value*100
tab3$Aspect<-factor(tab3$Aspect, levels = tab2$Aspect[order(-(tab2[,5]+tab2[,6]+tab2[,7]))])
highs<-na.omit(tab3[(length(tab3[,1])/2)+1:length(tab3[,1]),])
lows<-na.omit(tab3[1:(length(tab3[,1])/2),])
lows <- lows[rev(rownames(lows)),]
lows$col <- factor(lows$col, levels = c("#CA0020","#F4A582", "#DFDFDF"))
ggplot() + geom_bar(data=highs, aes(x = Aspect, y=value, fill=col), position="stack", stat="identity") +
  geom_bar(data=lows, aes(x = Aspect, y=-value, fill=col), position="stack", stat="identity") +
  geom_hline(yintercept = 0, color =c("white")) +
  scale_fill_identity("Percent", labels = mylevels, breaks=legend.pal, guide="legend") +
  theme_fivethirtyeight() +
  coord_flip() +
  labs(title=mytitle, y="",x="") +
  theme(plot.title = element_text(size=14, hjust=0.5)) +
  theme(axis.text.y = element_text(hjust=0)) +
  theme(legend.position = "bottom") +
  scale_y_continuous(breaks=seq(mymin,mymax,25), limits=c(mymin,mymax))

#ggsave("plots/interview/likert_integrated_purchased.png")