Step 7 Compare the sensitivity of these two methods
Sensitivity is defined as the number of detected nearby SNPs in the top k SNPs divided by the total number of nearby SNPs.
# How many SNPs are categorized are physically nearby the causal SNPs on two chromosomes respectively?
count_near_chra = sum((df%>%filter(chromosome==1))$nearby_status)
count_near_chrb = sum((df%>%filter(chromosome==2))$nearby_status)
# How many SNPs are categorized are physically nearby the causal SNPs in total?
count_near = sum(df$nearby_status)7.1 Get the sensitivity of PLIS procedure
sensitivity_lis = c()
for (i in 1:10){
  LIS_rank = all.Rlts[order(all.Rlts[,"LIS"])[1:(i*100)],]
  sensitivity_lis = c(sensitivity_lis, sum(LIS_rank$nearby_status)/count_near)
}
sensitivity_lis
## [1] 0.1308017 0.2194093 0.3122363 0.3924051 0.4303797 0.5063291
## [7] 0.5738397 0.6371308 0.6751055 0.68354437.1.1 Get the sensitivity of PLIS method on chromosome a
sensitivity_lis_a = c()
for (i in 1:10){
  LIS_rank = all.Rlts[order(all.Rlts[,"LIS"])[1:(i*100)],]
  sensitivity_lis_a = c(sensitivity_lis_a, sum((LIS_rank%>%filter(chromosome==1))$nearby_status)/count_near_chra)
}
sensitivity_lis_a
## [1] 0 0 0 0 0 0 0 0 0 07.1.2 Get the sensitivity of PLIS method on chromosome b
sensitivity_lis_b = c()
for (i in 1:10){
  LIS_rank = all.Rlts[order(all.Rlts[,"LIS"])[1:(i*100)],]
  sensitivity_lis_b = c(sensitivity_lis_b, sum((LIS_rank%>%filter(chromosome==2))$nearby_status)/count_near_chrb)
}
sensitivity_lis_b
## [1] 0.1623037 0.2722513 0.3874346 0.4869110 0.5340314 0.6282723
## [7] 0.7120419 0.7905759 0.8376963 0.84816757.2 Get the sensitivity of conventional p-value method
sensitivity_p = c()
for (i in 1:10){
  p_rank = all.Rlts[order(all.Rlts[,"pvalue"])[1:(i*100)],]
  sensitivity_p = c(sensitivity_p, sum(p_rank$nearby_status)/count_near)
}
sensitivity_p
## [1] 0.1434599 0.2151899 0.2827004 0.3291139 0.3502110 0.4177215
## [7] 0.4430380 0.4725738 0.4978903 0.53164567.2.1 Get the sensitivity of conventional p-value method on chromosome a
sensitivity_p_a = c()
for (i in 1:10){
  p_rank = all.Rlts[order(all.Rlts[,"pvalue"])[1:(i*100)],]
  sensitivity_p_a = c(sensitivity_p_a, sum((p_rank%>%filter(chromosome==1))$nearby_status)/count_near_chra)
}
sensitivity_p_a
## [1] 0.2173913 0.2826087 0.3260870 0.3260870 0.3260870 0.3260870
## [7] 0.3260870 0.3260870 0.3260870 0.32608707.2.2 Get the sensitivity of conventional p-value method on chromosome b
sensitivity_p_b = c()
for (i in 1:10){
  p_rank = all.Rlts[order(all.Rlts[,"pvalue"])[1:(i*100)],]
  sensitivity_p_b = c(sensitivity_p_b, sum((p_rank%>%filter(chromosome==2))$nearby_status)/count_near_chrb)
}
sensitivity_p_b
## [1] 0.1256545 0.1989529 0.2722513 0.3298429 0.3560209 0.4397906
## [7] 0.4712042 0.5078534 0.5392670 0.58115187.3 Plot the sensitivity trends of PLIS and p-value methods
The two causal SNPs in Chr 1 are close to each other, while the two in Chr 2 are far away from each other. The 100000 SNPs on each side of a causal SNP are defined as true positives. We calculate the percentages of true positives (sensitivity) selected by the top K SNPs, ranked by PLIS and P-value, respectively.
k = seq(100, 1000, 100)
lis_df = data.frame(top_k = k, value = as.vector(sensitivity_lis), type = 'PLIS Method')
pval_df = data.frame(top_k = k, value = as.vector(sensitivity_p), type = 'p-value Method')
lis_p_comparison = rbind(lis_df, pval_df)
7.3.1 Stationary
# Plot it using ggplot
ggplot(aes(x = top_k, y = value, color = type), data=lis_p_comparison) +
  geom_point(aes(group = seq_along(top_k)), size = 2) +
  geom_line() +
  scale_x_continuous(breaks = lis_p_comparison$top_k) +
  labs(x = 'SNP Ranking (Top K)', y = 'Value', color = 'Method Type') +
  theme_classic()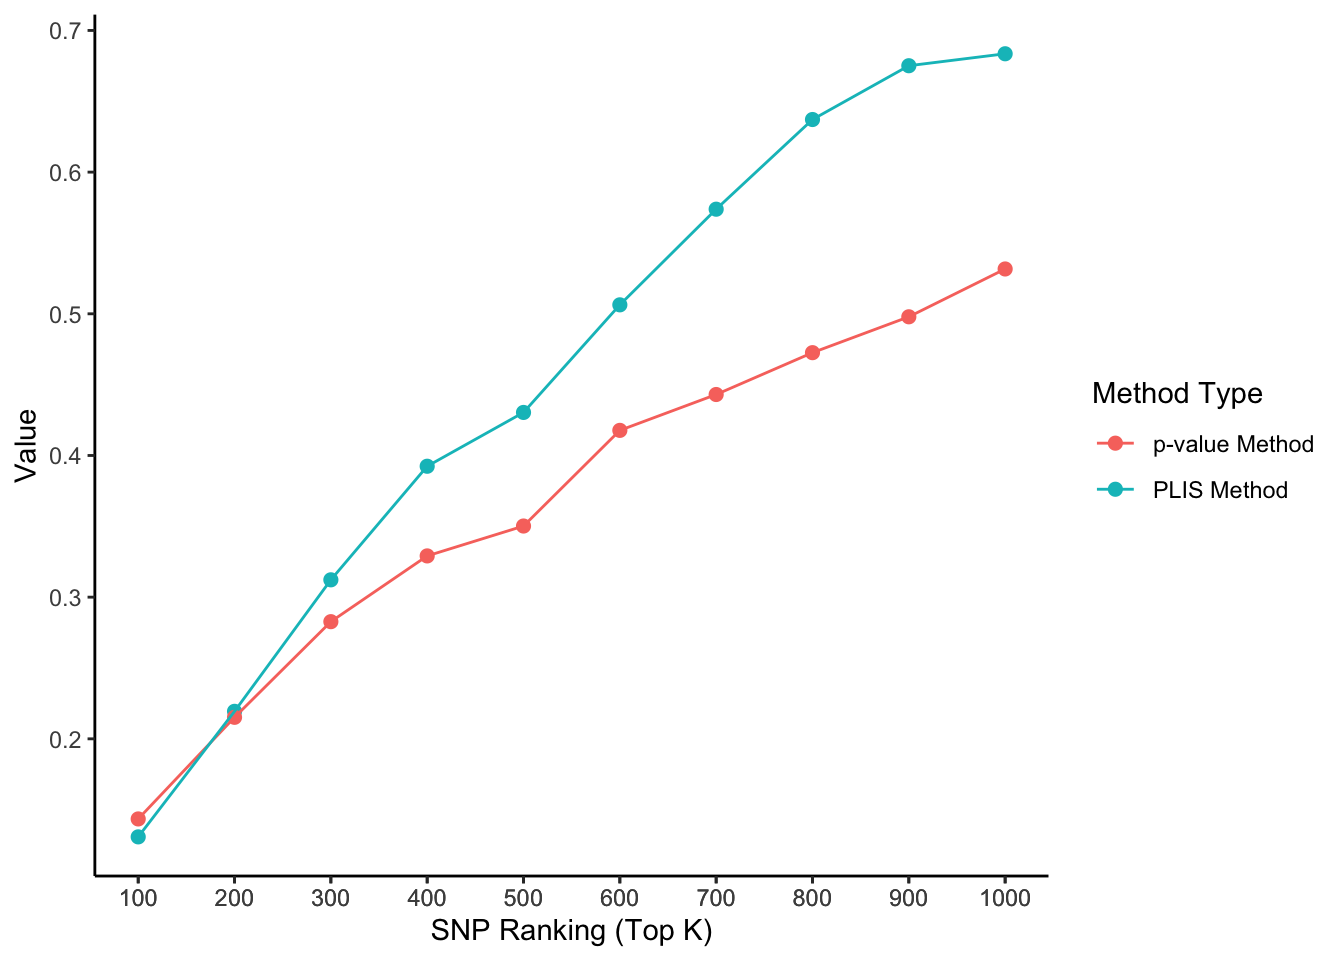
7.3.2 Animation
# Uncomment the following lines if you haven't installed the packages yet
# install.packages('gganimate')
# install.packages('transformr')
library(gganimate)
library(transformr)

lisp <- ggplot(aes(x = top_k, y = value, color = type), data=lis_p_comparison) +
  geom_point(aes(group = seq_along(top_k)), size = 2) +
  geom_line() +
  scale_x_continuous(breaks = lis_p_comparison$top_k) +
  transition_reveal(top_k) +
  ease_aes("linear") +
  labs(x = 'SNP Ranking (Top K)', y = 'Sensitivity', color = 'Method Type') +
  theme_classic()

animate(lisp, fps = 3, duration = 5)
anim_save("lisp.gif")7.4 Plot the sensitivity trend of PLIS and p-value methods – grouped by chromosome
The two causal SNPs in Chr 1 are close to each other, while the two in Chr 2 are far away from each other. The 100000 SNPs on each side of a causal SNP are defined as true positives. We calculate the percentages of true positives (sensitivity) on each chromosome selected by the top K SNPs, ranked by PLIS and P-value, respectively.
k = seq(100, 1000, 100)
lis_df = data.frame(top_k = k, value = as.vector(sensitivity_lis), type = 'PLIS Method', causal = 'both')
lis_a_df = data.frame(top_k = k, value = as.vector(sensitivity_lis_a), type = 'PLIS Method', causal = 'nearby causal')
lis_b_df = data.frame(top_k = k, value = as.vector(sensitivity_lis_b), type = 'PLIS Method', causal = 'far-away causal')
pval_df = data.frame(top_k = k, value = as.vector(sensitivity_p), type = 'p-value Method', causal = 'both')
pval_a_df = data.frame(top_k = k, value = as.vector(sensitivity_p_a), type = 'p-value Method', causal = 'nearby causal')
pval_b_df = data.frame(top_k = k, value = as.vector(sensitivity_p_b), type = 'p-value Method', causal = 'far-away causal')
lis_p_comparison = rbind(lis_df,lis_a_df,lis_b_df, pval_df,pval_a_df,pval_b_df)
lis_p_comparison
## top_k value type causal
## 1 100 0.1308017 PLIS Method both
## 2 200 0.2194093 PLIS Method both
## 3 300 0.3122363 PLIS Method both
## 4 400 0.3924051 PLIS Method both
## 5 500 0.4303797 PLIS Method both
## 6 600 0.5063291 PLIS Method both
## 7 700 0.5738397 PLIS Method both
## 8 800 0.6371308 PLIS Method both
## 9 900 0.6751055 PLIS Method both
## 10 1000 0.6835443 PLIS Method both
## 11 100 0.0000000 PLIS Method nearby causal
## 12 200 0.0000000 PLIS Method nearby causal
## 13 300 0.0000000 PLIS Method nearby causal
## 14 400 0.0000000 PLIS Method nearby causal
## 15 500 0.0000000 PLIS Method nearby causal
## 16 600 0.0000000 PLIS Method nearby causal
## 17 700 0.0000000 PLIS Method nearby causal
## 18 800 0.0000000 PLIS Method nearby causal
## 19 900 0.0000000 PLIS Method nearby causal
## 20 1000 0.0000000 PLIS Method nearby causal
## 21 100 0.1623037 PLIS Method far-away causal
## 22 200 0.2722513 PLIS Method far-away causal
## 23 300 0.3874346 PLIS Method far-away causal
## 24 400 0.4869110 PLIS Method far-away causal
## 25 500 0.5340314 PLIS Method far-away causal
## 26 600 0.6282723 PLIS Method far-away causal
## 27 700 0.7120419 PLIS Method far-away causal
## 28 800 0.7905759 PLIS Method far-away causal
## 29 900 0.8376963 PLIS Method far-away causal
## 30 1000 0.8481675 PLIS Method far-away causal
## 31 100 0.1434599 p-value Method both
## 32 200 0.2151899 p-value Method both
## 33 300 0.2827004 p-value Method both
## 34 400 0.3291139 p-value Method both
## 35 500 0.3502110 p-value Method both
## 36 600 0.4177215 p-value Method both
## 37 700 0.4430380 p-value Method both
## 38 800 0.4725738 p-value Method both
## 39 900 0.4978903 p-value Method both
## 40 1000 0.5316456 p-value Method both
## 41 100 0.2173913 p-value Method nearby causal
## 42 200 0.2826087 p-value Method nearby causal
## 43 300 0.3260870 p-value Method nearby causal
## 44 400 0.3260870 p-value Method nearby causal
## 45 500 0.3260870 p-value Method nearby causal
## 46 600 0.3260870 p-value Method nearby causal
## 47 700 0.3260870 p-value Method nearby causal
## 48 800 0.3260870 p-value Method nearby causal
## 49 900 0.3260870 p-value Method nearby causal
## 50 1000 0.3260870 p-value Method nearby causal
## 51 100 0.1256545 p-value Method far-away causal
## 52 200 0.1989529 p-value Method far-away causal
## 53 300 0.2722513 p-value Method far-away causal
## 54 400 0.3298429 p-value Method far-away causal
## 55 500 0.3560209 p-value Method far-away causal
## 56 600 0.4397906 p-value Method far-away causal
## 57 700 0.4712042 p-value Method far-away causal
## 58 800 0.5078534 p-value Method far-away causal
## 59 900 0.5392670 p-value Method far-away causal
## 60 1000 0.5811518 p-value Method far-away causal7.4.1 Stationary
# Plot it using ggplot
lisp_nfd = ggplot(aes(x = top_k, y = value, col = type, lty = causal), data=lis_p_comparison) +
  geom_point(aes(group = seq_along(top_k)), size = 2) +
  geom_line() +
  scale_x_continuous(breaks = lis_p_comparison$top_k) +
  labs(x = 'SNP Ranking (Top K)', y = 'Value', color = 'Method Type', lty = "chromosome") +
  theme_classic()

lisp_nfd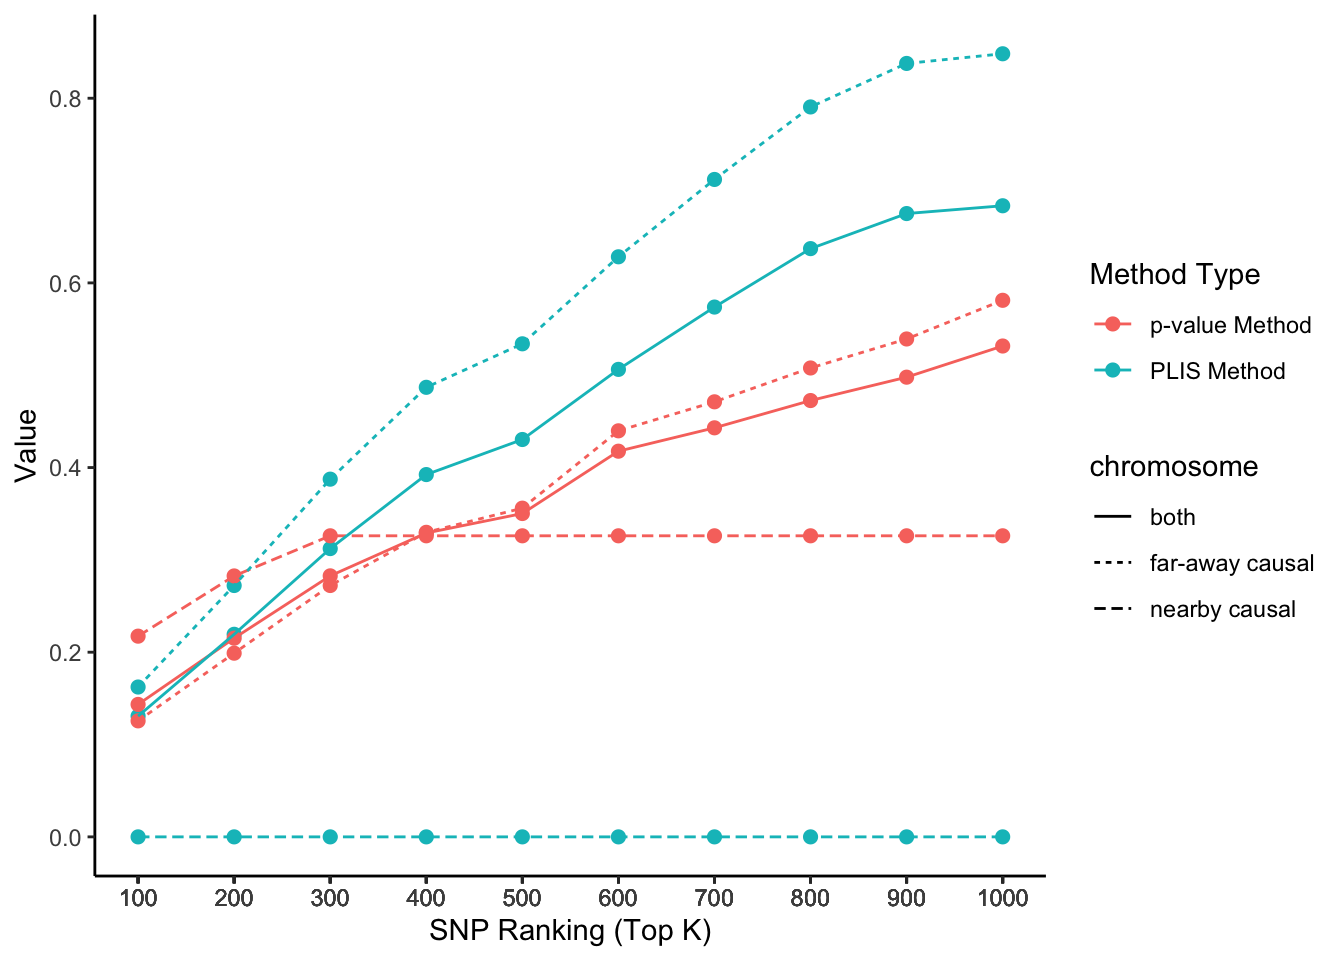
7.4.2 Animation
# Uncomment the following lines if you haven't installed the packages yet
# install.packages('gganimate')
# install.packages('transformr')
library(gganimate)
library(transformr)
lisp_nfd = ggplot(aes(x = top_k, y = value, col = type, lty = causal), data=lis_p_comparison) +
geom_point(aes(group = seq_along(top_k)), size = 2) +
geom_line() +
scale_x_continuous(breaks = lis_p_comparison$top_k) +
transition_reveal(top_k) +
ease_aes("linear") +
labs(x = 'SNP Ranking (Top K)', y = 'Value', color = 'Method Type') +
theme_classic()
animate(lisp_nfd, fps = 3, duration = 5)
anim_save("lisp_nfd.gif")