Chapter 2 Time Series
Reference : Statistical Inference via Data Science.
2.1 Needed Package
I recommend you to install tidyverse, a collection of packages for data science. To install and load the packages, type
2.2 For Loop
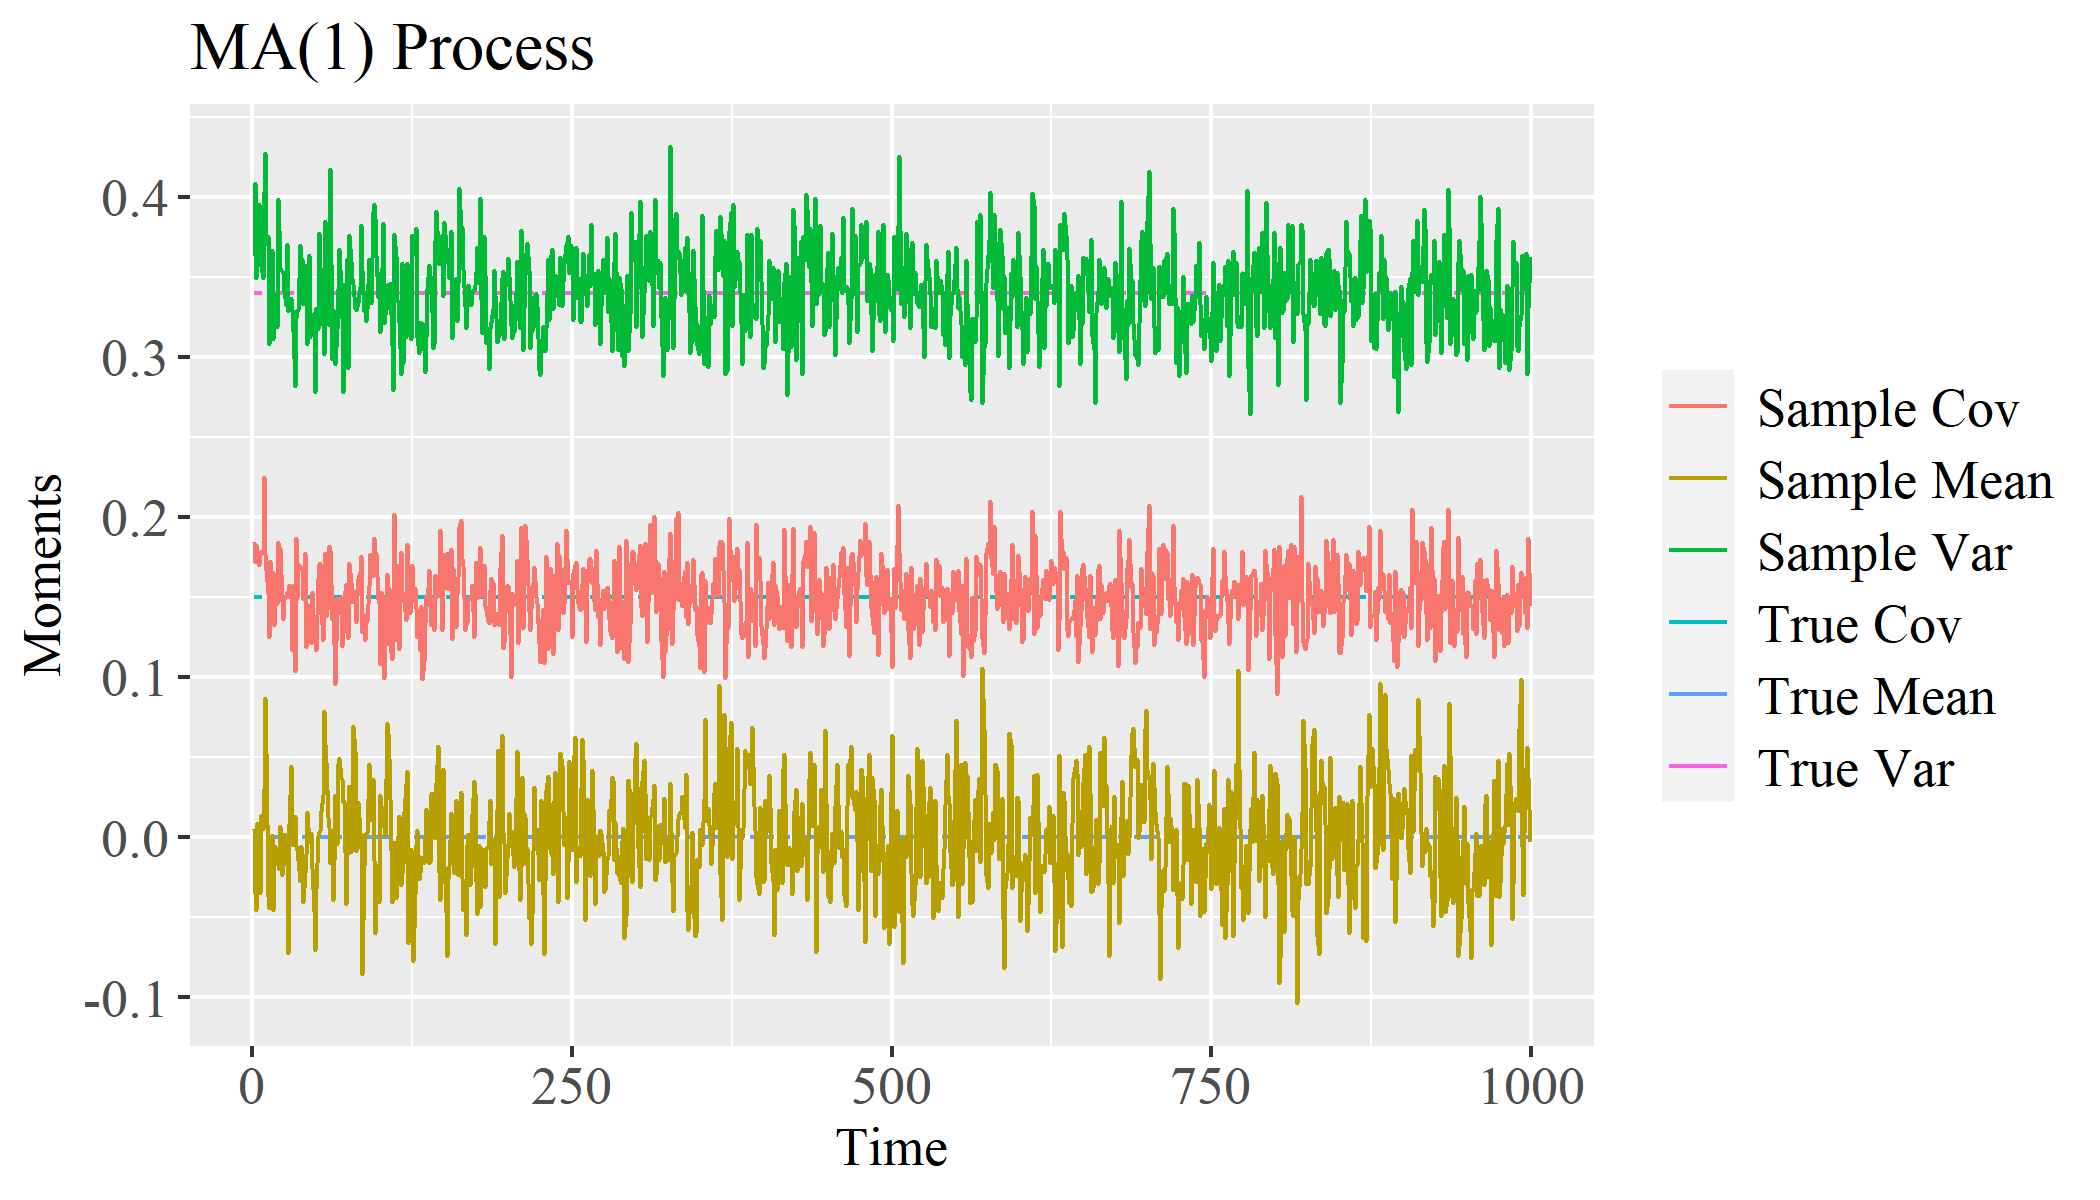
In this section, we generate a stochastic process following \(X_t = (1 + \theta L)\varepsilon_t\) where \(\varepsilon_t\)’s are i.i.d. normally distributed with standard deviation \(\sigma = 0.5\). And we set \(\theta = 0.6\).
#===============================
# Sample code for MA(1) process
#===============================

rm(list = ls(all = TRUE))
set.seed(1)

# Initialize
theta <- .6
sigma <- .5

T <- 1000         # length of stochastic process
x <- numeric(T)  # memory allocation
eps_old <- rnorm(1, mean = 0, sd = sigma)

# Generate Data
for (t in 1 : T){
  eps_new <- rnorm(1, mean = 0, sd = sigma)
  x[t] <- eps_new + theta * eps_old
  eps_old <- eps_new
}


# or more simply,
# set.seed(1)
# eps <- rnorm(T + 1, mean = 0, sd = sigma)
# x <- eps[-1] + theta * eps[-length(eps)]
2.3 Sample Moments
Note that \(E(X_t) = 0\), \(\gamma(0) = Var(X_t) = (1 + \theta^2)\sigma^2\) and \(\gamma(1) = Cov(X_t, X_{t-1}) = \theta \sigma^2\). We compute sample moments and compare them with theoretical moments.
#=================================
# Sample code for MA(1) processes
#=================================

rm(list = ls(all = TRUE))
set.seed(1)

# Initialize
theta <- .6
sigma <- .5
N <- 300                        # number of stochastic processes
T <- 1000                        # length of a stochastic process
X <- matrix(nrow = N, ncol = T) # memory allocation

eps_old <- rnorm(N, mean = 0, sd = sigma)

# Generate Data
for (t in 1 : T){
  eps_new <- rnorm(N, mean = 0, sd = sigma)
  X[, t] <- eps_new + theta * eps_old
  eps_old <- eps_new
}

# Sample Moments
mean_est <- colMeans(X)
gamma0_est <- apply(X, MARGIN = 2, FUN = var)
gamma1_est <- sapply(seq(T-1), FUN = function(i) cov(X[,i], X[,i+1]))

# True Moments
mean_true <- 0
gamma0_true <- (1 + theta ^ 2) * sigma ^ 2
gamma1_true <- theta * sigma ^ 2

# Results
abs(c(mean(mean_est - mean_true),
      mean(gamma0_est - gamma0_true),
      mean(gamma1_est - gamma1_true)))
## [1] 0.0002941528 0.0006930542 0.00071074802.3.1 Note on apply function
We may compute gamma0_est via for loop as follows,
# Compute gamma0 via for loop
start_for <- Sys.time()
gamma0_est_for <- numeric(T)

for (t in seq(T)){
  gamma0_est_for[t] <- var(X[,t])
}
end_for <- Sys.time()
time_for <- end_for - start_for

# Compute gamma0 via apply function
start_apply <- Sys.time()
gamma0_est <- apply(X, MARGIN = 2, FUN = var)
end_apply <- Sys.time()
time_apply <- end_apply - start_apply

# time difference
time_for - time_apply
## Time difference of 0.01096916 secsWe can see that the code with apply function is faster than for loop and more readable.
2.4 ggplot2
ggplot2 is one the most widely used packages for data visualization. We already loaded this package by running library(tidyverse). In fact, we loaded all the following packages at once,
ggplot2,dplyr,tidyr,readr,purrr,tibble,strignr, andforcatspackages.
If you don’t need other packages, type library(ggplot2).
2.4.1 The Grammar of Graphics
The gg in ggplot2 is an abbreviation for the grammar of graphics. According to Wickham (2016), the grammar tells us that a statistical graphic is a mapping from data to aesthetic attributes (colour, shape, size) of geometric objects (points, lines, bars). The plot may also contain statistical transformations of the data and is drawn on a specific coordinate system.
# generate data.frame
MA <- data.frame("x" = seq(T - 1),
                 "mean_est" = mean_est[-T],
                 "mean_true" = rep(mean_true, T - 1),
                 "gamma0_est" = gamma0_est[-T],
                 "gamma0_true" = rep(gamma0_true, T - 1),
                 "gamma1_est" = gamma1_est[-T],
                 "gamma1_true" = rep(gamma1_true, T - 1)
                 )
# View(fig_MA)

# x coordinate
fig <- ggplot(data = MA, mapping = aes(x = x))

# multiple lines
fig <- fig + geom_line(aes(y = mean_true, color = "True Mean"),
                       linetype = "twodash")
fig <- fig + geom_line(aes(y = mean_est, color = "Sample Mean"),
                       linetype = "solid")
fig <- fig + geom_line(aes(y = gamma0_true, color = "True Var"),
                       linetype = "twodash")
fig <- fig + geom_line(aes(y =gamma0_est, color = "Sample Var"),
                       linetype = "solid")
fig <- fig + geom_line(aes(y = gamma1_true, color = "True Cov"),
                       linetype = "twodash")
fig <- fig + geom_line(aes(y = gamma1_est, color = "Sample Cov"),                           linetype = "solid")

# text
fig <- fig + labs(x = "Time", y = "Moments", title = "MA(1) Process")
fig <- fig +
       theme(plot.title=element_text(size=16, family="serif"),
             axis.title.x=element_text(size=13, family="serif"),
             axis.text.x=element_text(size=13, family="serif"),
             axis.title.y=element_text(size=13, family="serif"),
             axis.text.y=element_text(size=13, family="serif"),
             legend.text=element_text(size=13, family="serif"),
             legend.title=element_blank()
             )
show(fig)
ggsave("MA2.png", plot = fig, width = 7, height = 4)