Ggplot2
Reproducible Psychological Research with R: Homework Portfolio
by Shannon Joyce
This is a compilation of all homework assignments that I have completed for my graduate class on Reproducible Psychological Research. In these assignments, I have successfully written and executed R scripts for data analysis, cleaned and wrangled datasets using reproducible workflows, created publication-quality figures using ggplot2, conducted and interpreted common statistical tests, communicated results through reproducible R Markdown documents, and applied open science … Read more →
现代统计图形(第二版)
by 黄湘云
黄湘云 《现代统计图形》(赵鹏, 谢益辉, 和 黄湘云 2021) 因销量不错,出版社编辑对我们发出邀稿,本书是我独自对第二版的尝试。 书中的代码字体采用美观的 Source Code Pro 字体, 为方便跨操作系统编译书籍电子版,正文的中文字体采用开源的 fandol 字体。 而本书图形中使用的 Noto 系列中英文字体来自 Google Fonts 字体库,分别是 Noto Sans 无衬线英文字体和 Noto Serif SC 宋体中文字体。 图 1 中的左、右子图分别展示 Base R 和 ggplot2 (Wickham 2016) 图形中中英文字体的效果。在图形中调用中文字体分两步走,先使用 sysfonts 包获取并注册 Noto 相关字体,然后在绘图的时候指定字体,并在代码块选项中启用 fig.showtext = … Read more →
R 語言資料分析:交通運輸
by Chia-Jung (Robert) Yeh 葉家榮 PhD: Insitute of Transport and Logistics Studies, USYD M.S.: Department of Transportation and Logistics Management, NYCU
本書介紹R語言資料分析的基礎及其在交通運輸的應用,透過資料分析和資料視覺化呈現,瞭解數據資料的整理。在大數據的時代,交通運輸的資料分析尤為重要,本書透過R軟體讓讀者更瞭解資料分析的策略。本書第一章介紹R語言基礎語法,瞭解R的資料架構,並介紹文字處理的技巧。第二章介紹R語言常用的資料分析套件,其中包括dplyr、data.table、tidyr等套件。第三章介紹視覺化的方法,瞭解ggplot2套件及其周邊套件的應用方式。第四章著重於交通運輸資料的彙整與分析。 […] 本書簡介運輸資料分析之方法,並透過實務應用瞭解運輸資料的特性、分析原理,以及 R 語言各套件與函式的功能。共分為六大章節。前三章節為 R … Read more →
数据科学中的 R 语言
by 王敏杰
This book is an overview of how practitioners can acquire, wrangle, visualize, and model data with the R and Stan. […] 你好,这里是四川师范大学研究生公选课《数据科学中的R语言》的课程内容。R语言是统计编程的第一语言,近几年Tidyverse的推出大大降低了R语言的学习难度。Tidyverse是一系列R包的集合,包含了dplyr、ggplot2、tidyr、stringr等,从数据导入预处理,再到高级转化、可视化、建模和展示。因为其代码清晰可读的编程风格,得到越来越多人的喜爱。考虑到大家来自不同的学院,有着不同的学科背景,因此讲授的内容不会太深奥(要有信心 … Read more →
r4ds-ggplot2
by ggiaever
r4ds-ggplot2 […] This website us the ggplot visulization sections of Hadley Wickham’s book 2nd edition of “R for Data Science”. … Read more →
R Outout Gallery
by Hao Sun
This is a minimal example of using the bookdown package to write a book. The HTML output format for this example is bookdown::gitbook, set in the _output.yml file. [...] This bookdown includes some interesting table and figure examples. It can be used as a manual of ggplot2, DT, ... Read more →
Statistical rethinking with brms, ggplot2, and the tidyverse: Second edition
by A Solomon Kurz
This book is an attempt to re-express the code in the second edition of McElreath’s textbook, ‘Statistical rethinking.’ His models are re-fit in brms, plots are redone with ggplot2, and the general data wrangling code predominantly follows the tidyverse style. […] This ebook is based on the second edition of Richard McElreath’s (2020a) text, Statistical rethinking: A Bayesian course with examples in R and Stan. My contributions show how to fit the models he covered with Paul Bürkner’s brms package (Bürkner, 2017, 2018, 2022j), which makes it easy to fit Bayesian regression models in R (R … Read more →
Statistical rethinking with brms, ggplot2, and the tidyverse
by A Solomon Kurz
This project is an attempt to re-express the code in McElreath’s textbook. His models are re-fit in brms, plots are redone with ggplot2, and the general data wrangling code predominantly follows the tidyverse style. […] I love McElreath’s (2015) Statistical rethinking text. It’s the entry-level textbook for applied researchers I spent years looking for. McElreath’s freely-available lectures on the book are really great, too. However, I prefer using Bürkner’s brms package (Bürkner, 2017, 2018, 2022i) when doing Bayesian regression in R. It’s just spectacular. I also prefer plotting with … Read more →
Programming and Applied Data Visualization with R
by Dr. Paul C. Bauer (University of Mannheim)
Q: What is your experience with looking at data analysis code you have written 2 years earlier? Comment your code Use meaningful names! A “new” package dplyr written by Hadley Wickham/Romain Francois replaces many old functions for data management Functions in dplyr are highly performant (big data!) and consistent See this page for an excellent overview and the Data Wrangling Cheat Sheet What could the following functions be used for? Hadley Wickhams ggplot2 Package developed into a powerful alternative to the default plot() function. Its goal is to simplify complex plots (e.g. take care of … Read more →
An Introduction to ggplot2
by Ozancan Ozdemir
A ggplot2 Tutorial […] Hi! Data Visualization is one of the important steps of the data analysis process. It is actually not only part of the data analysis, but also can be considered as an art. R Programming language provides a powerful visualization package to us, ggplot2. This book aims to show how you can make a well-known statistical plots by using ggplot2, and also how you can improve or customize them. The book is created by the lab notes of statistical computing (STAT 291-STAT 292) of Ozancan Ozdemir. For your opinions and suggestions, please send me an e-mail to … Read more →
Data Integration, Manipulation and Visualization of Phylogenetic Trees
by Guangchuang Yu
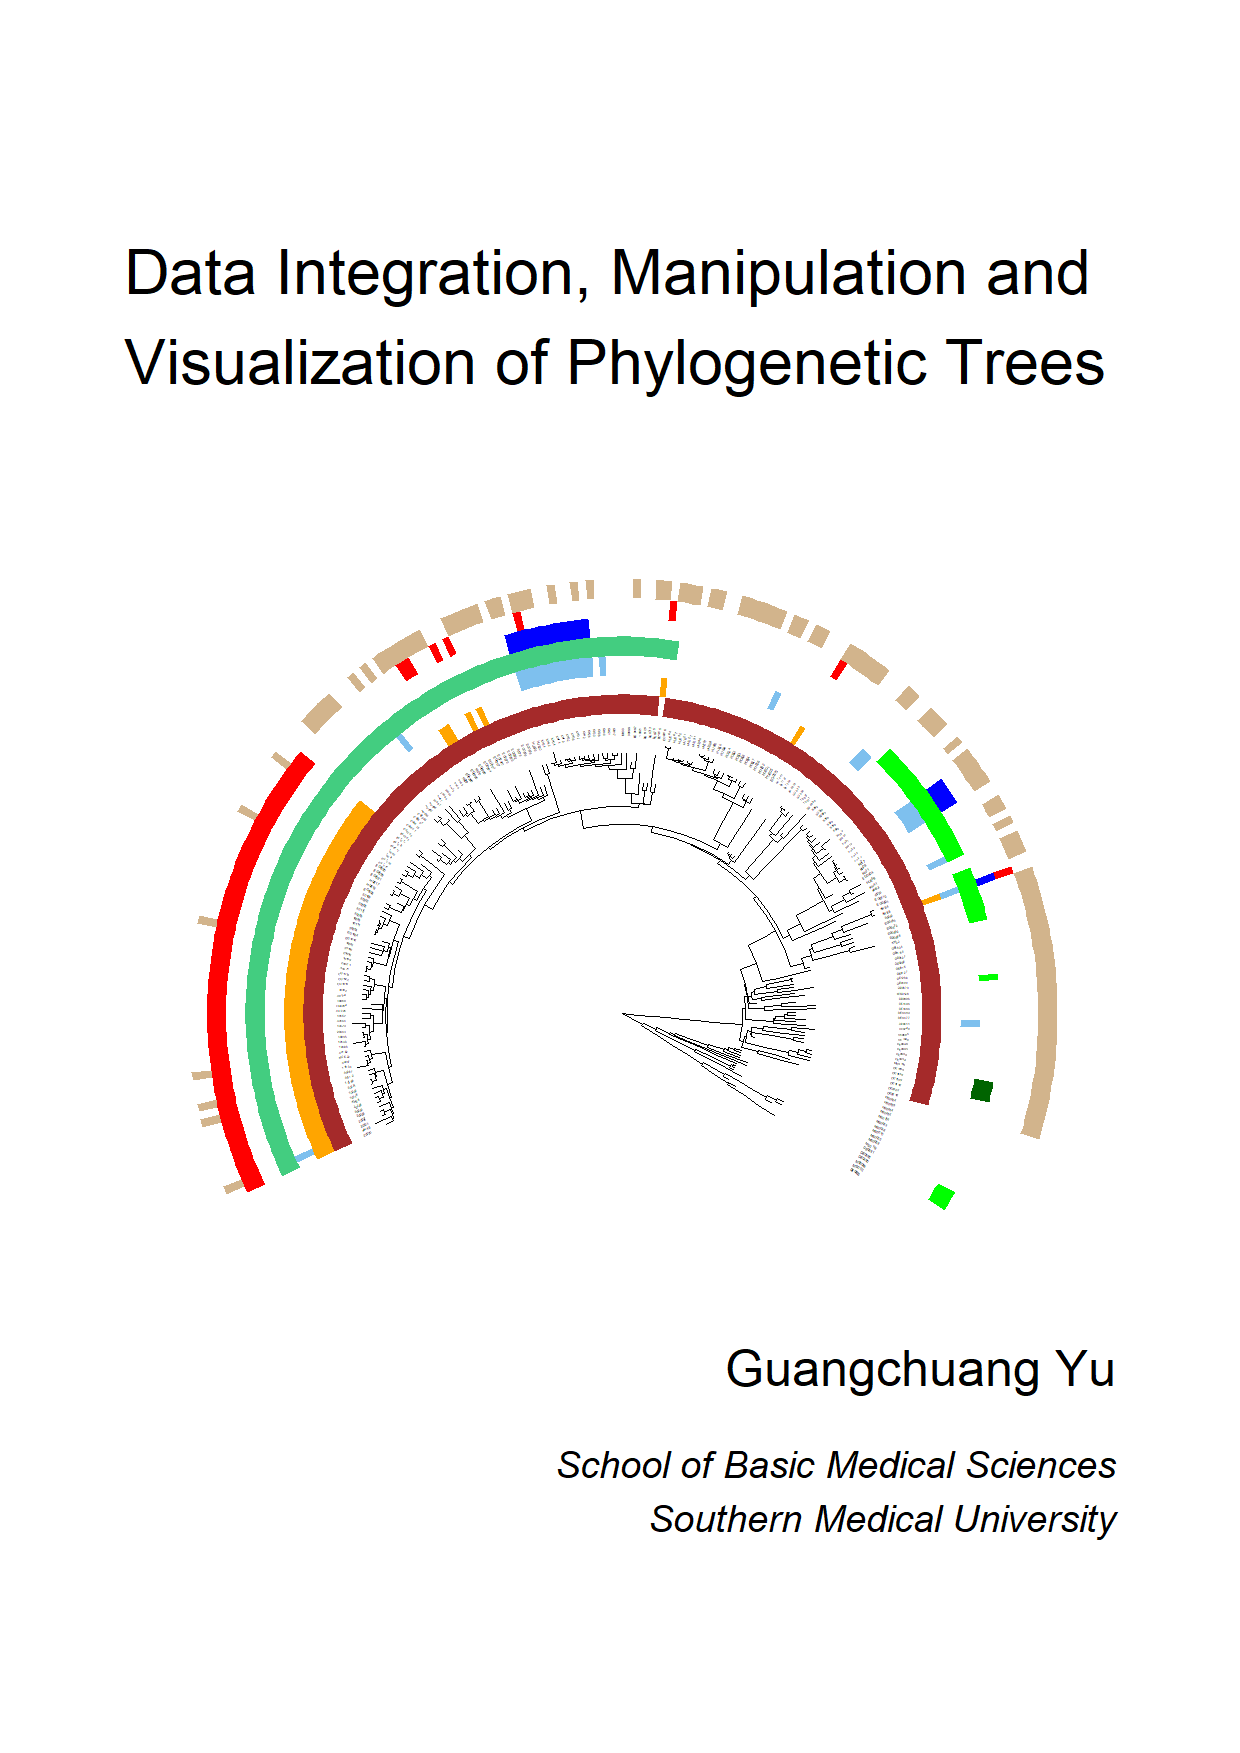
Master ggtree package suite to handle tree with data. […] I am so excited to have this book published. The book is meant as a guide for data integration, manipulation and visualization of phylogenetic trees using a suite of R packages, tidytree, treeio, ggtree and ggtreeExtra. Hence, if you are starting to read this book, we assume you have a working knowledge of how to use R and ggplot2. The development of the ggtree package started during my PhD study at the University of Hong Kong. I joined the State Key Laboratory of Emerging Infectious Diseases (SKLEID) under the supervision of Yi Guan … Read more →
Úvod do analýzy údajov pomocou R
by Tomáš Bacigál
Základy jazyka R a úvod do Data Science: prieskumná analýza, transformácia údajov (dplyr), vizualizácia (ggplot2), čistenie údajov (tidyr), interaktívne grafy (htmlwidgets, shiny, …), komunikácia (RMarkdown), efektívne programovanie (parallel, RCpp, RSQLite). […] I don’t think anyone actually believes that R is designed to make everyone happy. For me, R does about 99% of the things I need to do, but sadly, when I need to order a pizza, I still have to pick up the telephone. (Roger D. Peng, r. 2004) Tento citát vystihuje univerzálnosť softvérového nástroja R1. Tak ako u viacerých „open … Read more →
An(other) introduction to R
by Felix Lennert
This is a gentle introduction to R and the basic usage of some tidyverse packages (dplyr, tidyr, ggplot2, forcats, stringr) for data manipulation and visualization. […] Dear student, in the following, you will receive a gentle introduction to R and how you can use it to work with data. This tutorial was heavily inspired by Richard Cotton’s “Learning R” (Cotton 2013) and Hadley Wickham’s and Garrett Grolemund’s “R for Data Science” (abbreviated with R4DS). The latter can be found online (Wickham and Grolemund 2016). We will not immediately start out with the packages from the tidyverse … Read more →
Data Visualization for Conservation
by Gavin Masterson
This book contains all the content for, and information relevant to, the Data Visualization for Conservation course (7 July - 20 July 2021). […] Welcome to the Data Visualization for Conservation course! In this course we are going to be talking about data visualisation or ‘dataviz.’ We will spend time talking about the importance of data visualisation, learning how to produce custom visualisations using the ggplot2 package, as well as an important theory of data management and storage. The path of learning is never-ending, and we do not want you to imagine that this course can teach you … Read more →
Introduction to R (Part 2)
by Nana Kim
A document for Intro to R workshop (part 2) video […] In the next two chapters, we will learn how to manipulate and visualize data. We will use tidyverse packages (mainly dplyr, ggplot2, and tidyr) for easier and faster data manipulation/visualization. First, install and load the tidyverse by running: * Visit https://www.tidyverse.org/ to learn more about the … Read more →
三國志で学ぶデータ分析 (Japan.R 2019)
by ill-identified
“三国志を題材にしたRを使ったデータ分析のチュートリアル” […] この記事は 2019/12/7 に開催された Japan.R の発表原稿をもとに作成した資料である. この記事の目的は2つ. ここでいう「データ分析」とは, なるべく複雑高度なテクニックを乱用せず必要最小限の方法で何かを言おうというものである. 今回の「データ分析」はスクレイピングによるデータ取得, データの加工整形, 要約統計量の計算, グラフによる視覚化, というよくあるデータ分析のアプローチであり, 使っているパッケージもrvest(スクレイピング), tidyrと dplyr(データの加工整形),ggplot2(グラフ作成)など様々な場面で使われるRの代表的なパッケージばかりで, … Read more →
R 資料科學與統計
by 林建甫 Jeff Lin
R 資料科學與統計 […] R 可視為統計數學軟體, 也是一種程式語言, 而近年來的發展, R 更成為資料科學的熱門的工具之一. R 是一個免費的統計分析軟體 (open-source, GNU General Public License), R 由一群跨國際的志工人員組成的 {R} 核心發展組織 (R core-development team) 所維持, 運作與持續更新發展. 目前對初學者的 R 入門學習有二大主要論點, 一為學習使用 R Base 原始語言與原始套件, 二為直接學習外部套件, 如 ggplot2, tidyverse 系統. 無論哪一種方式各有其優缺點. 個人認為對未來必須經常性使用 R 進行資料分析工作的初學者, 則建議先學習使用 R Base 原始語言. 對於未來僅在少數時間必須使用 R 進行資料分析工作, 或是僅在統計學上課使用, 則建議學習 … Read more →
Basic R Guide for NSC Statistics
by Deanna Li
This is an R guide for statistics course at NSC. […] This guide’s primary focus is on Basic R. When graphics are involved, command functions in both Basic R and a package called ggplot2 will be shown. Graph enhancements will be kept to a minimum. Although there are R packages that may do the same or better job than Basic R, this tutorial will not delve into those packages. Exploring other packages will be left for the student to look into, if the student so wishes. Datasets will be taken mostly from those built into R. Since this is mainly a tutorial on the R commands necessary to do … Read more →
교육용 프로그래밍 Home Work 1
by 소프트웨어교육전공 192SEE01 김미경
This is a minimal example of using the bookdown package to write a book. The output format for this example is bookdown::gitbook. […] Using the mpg dataset in the ggplot2 package, replicate the plot below using the following settings: Answer … Read more →
교육용 프로그래밍의 이해
by Boyoung Kim(202AIE06)
This is first homework for knowledge of programming for education. The output format for this document is bookdown::gitbook. […] Using the mpg dataset in the ggplot2 packages. replicate the plot below using the following settings … Read more →
Doing Bayesian Data Analysis in brms and the tidyverse
by A Solomon Kurz
This project is an attempt to re-express the code in Kruschke’s (2014) textbook. His models are re-fit in brms, plots are redone with ggplot2, and the general data wrangling code predominantly follows the tidyverse style. […] Kruschke began his text with “This book explains how to actually do Bayesian data analysis, by real people (like you), for realistic data (like yours).” In the same way, this project is designed to help those real people do Bayesian data analysis. My contribution is converting Kruschke’s JAGS code for use in Bürkner’s brms package, which makes it easier to fit Bayesian … Read more →
Statistical Rethinking with brms, ggplot2, and the tidyverse
by A Solomon Kurz
This project is an attempt to re-express the code in McElreath’s textbook. His models are re-fit in brms, plots are redone with ggplot2, and the general data wrangling code predominantly follows the tidyverse style. […] I love McElreath’s Statistical Rethinking text. It’s the entry-level textbook for applied researchers I spent years looking for. McElreath’s freely-available lectures on the book are really great, too. However, I prefer using Bürkner’s brms package when doing Bayeian regression in R. It’s just spectacular. I also prefer plotting with Wickham’s ggplot2, and coding with … Read more →
An Incomplete Solutions Guide to the NIST/SEMATECH e-Handbook of Statistical Methods
by Ray Hoobler
Analysis of case studies and exercies with a focus on using the tidyverse and ggplot2. This handbook was created using the bookdown package in RStudio. The output format for this example is bookdown::gitbook. […] Exploratory Data Analysis (EDA) is a philosophy on how to work with data, and for many applications, the workflow is better suited for scientist and engineers. As a scientist, we are trained to formulate a hypothesis and design a series of experiments that allow us to test the hypothesis effectively. Most data, however, doesn’t come from carefully controlled trials, but from … Read more →
Visualization
by Stanford Data Lab
This is a book on data visualization using ggplot2 created for the Stanford Data Challenge Lab. […] This is a … Read more →
Meu log de leitura de R for Data Science
by Marcos V. C. Vital - LEQ-UFAL
Meu log de leitura de R for Data Science […] Se tem alguma pessoa que pode ser considerada um “pop star” do R, seria o Hadley Wickham: o cara é responsável pelo ggplot2 e pelo dplyr, que são alguns dos pacotes mais populares do R! Mas são justamente pacotes que eu quase não uso… :( Deixe eu explicar melhor. Eu sou usuário do R há muitos anos (fiz as contas de cabeça enquanto eu escrevo, e se não me enganei, agora em 2018 seriam uns 13 ou 14 anos!), então já tem um bocado de tempo que aprendi a como resolver (e ensinar) algumas coisas. Até aí tudo bem. Acontece que o Hadley trouxe uma … Read more →
ggplot2 介紹
by 林茂廷老師
ggplot2 介紹 […] hypothes.is: https://hypothes.is/groups/eBBqEGde/minicourse-ggplot2 要在hypothes.is貼上程式碼時,請依下例張貼: ggplot2 cheatsheet Computing for the Social Sciences, U.Chicago. ggplot2part of the … Read more →
ggplot2逆引き集
by @kazutan
これはggplot2逆引き集です。 […] これはQiitaで公開されているggplot2逆引きの記事を集めたものです。今のところ,@kazutanが作成した12本をまとめています。 なにかありましたら,以下のGithubリポジトリのissueもしくはTwitterの@kazutanまでおねがいします。 … Read more →
Introduction to Data Science
by Rafael A. Irizarry

This book introduces concepts and skills that can help you tackle real-world data analysis challenges. It covers concepts from probability, statistical inference, linear regression and machine learning and helps you develop skills such as R programming, data wrangling with dplyr, data visualization with ggplot2, file organization with UNIX/Linux shell, version control with GitHub, and reproducible document preparation with R markdown. Read more →
Modern Data Visualization with R
by Robert Kabacoff
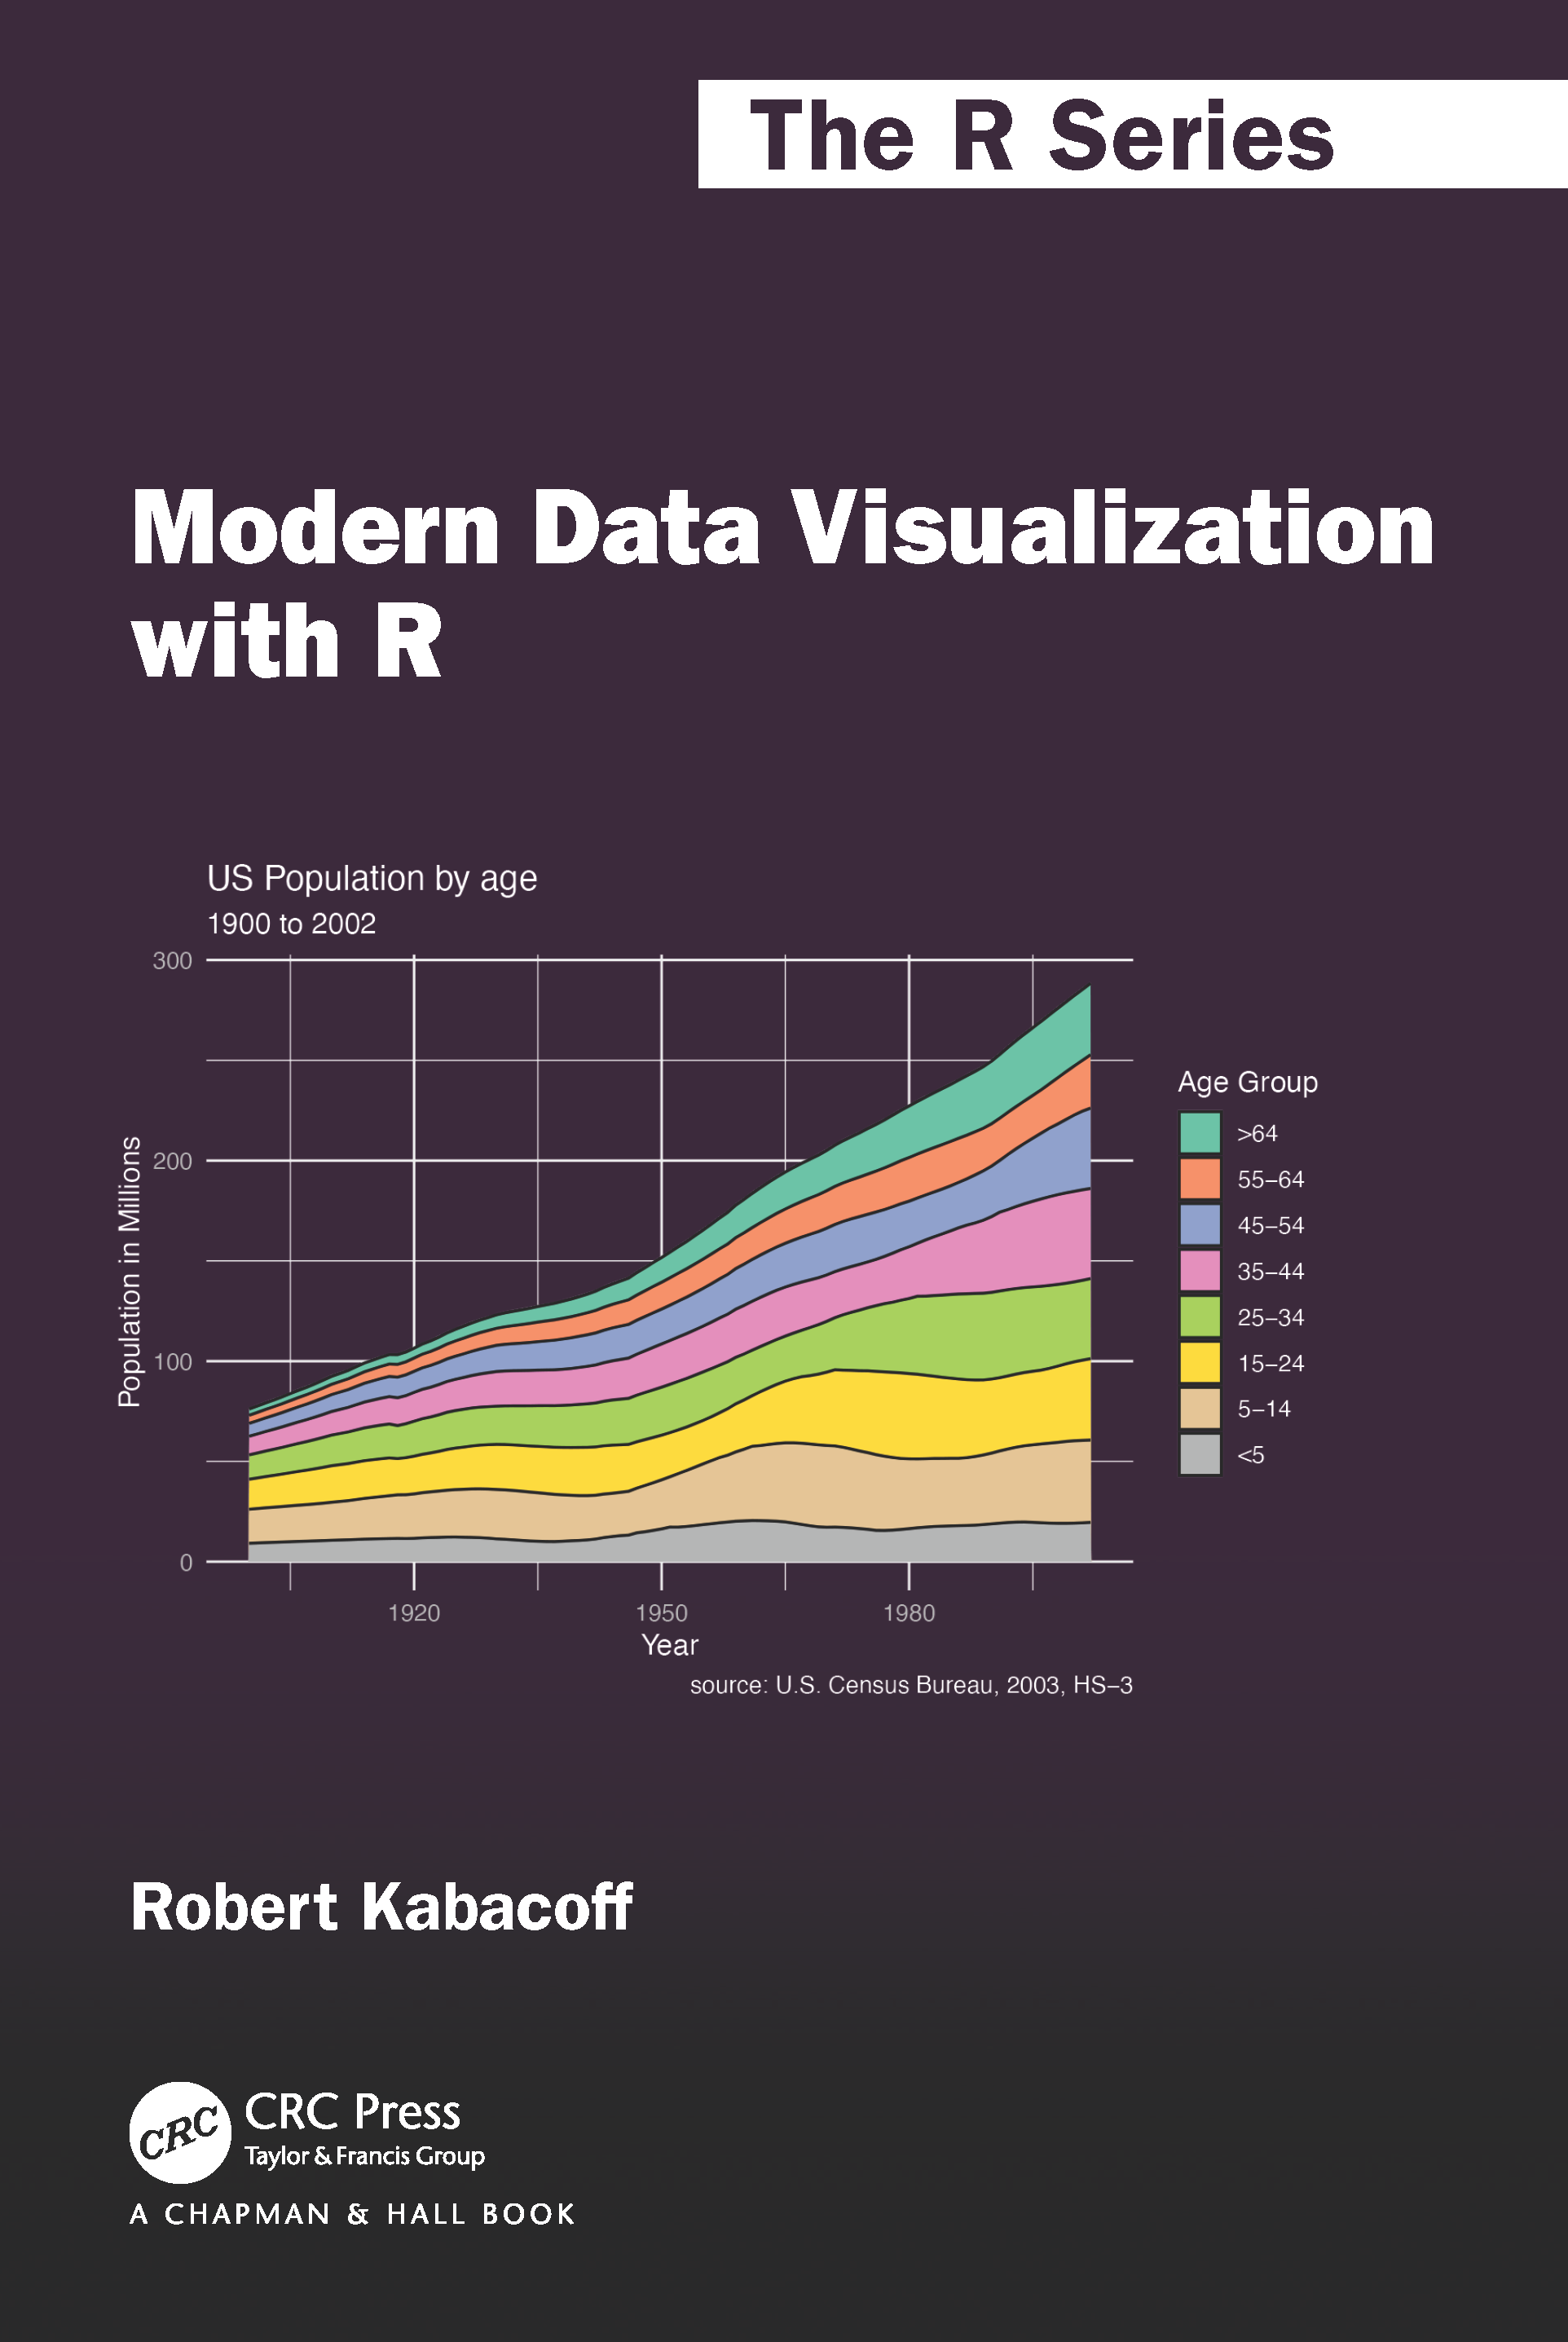
This is an illustrated guide for creating data visualizations in R. […] This is the online version of “Modern Data Visualization with R”, published by CRC Press. A print version is also available from Amazon. R is an amazing platform for data analysis, capable of creating almost any type of graph. This book helps you create the most popular visualizations - from quick and dirty plots to publication-ready graphs. The text relies heavily on the ggplot2 package for graphics, but other approaches are covered as well. My goal is make this book as helpful and user-friendly as possible. Any … Read more →