Chapter 2 Syntax
2.1 Basic
You can make text italic by surrounding it with underscores or asterisks, e.g., text or text. For bold text, use two underscores (text) or asterisks (text). Text surrounded by ~ will be converted to a subscript (e.g., H2SO4 renders H2SO4), and similarly, two carets (^) produce a superscript (e.g., Fe2+ renders Fe2+). To mark text as inline code, use a pair of backticks, e.g., code.3 Small caps can be produced by the HTML tag span, e.g., Small Caps renders Small Caps. Links are created using text, e.g., RStudio. Footnotes are put inside the square brackets after a caret 1, e.g., 2.
Blockquotes are possible
“Rishi likes blockquotes a lot. If anyone thinks blockquotes are useless, they are incorrect and should rethink their priorities and go do something else
— “Rishi Goutam”
This is a code block with no language
specified at all
This is also a code block2.3 Math
\[e^{\pi i} + 1 = 0\] \[X = \begin{bmatrix}1 & x_{1}\\ 1 & x_{2}\\ 1 & x_{3} \end{bmatrix}\]
\[\begin{vmatrix}a & b\\ c & d \end{vmatrix}=ad-bc\]
We can number an equation \[\begin{equation} e^{\pi i} + 1 = 0 \tag{2.1} \end{equation}\]
and refer to it (2.1)
2.4 Special custom blocks
Bookdown provides some special handling for custom blocks, such as theorem and example. See here for the full list
Theorem 2.1 (Pythagorean theorem) For a right triangle, if \(c\) denotes the length of the hypotenuse and \(a\) and \(b\) denote the lengths of the other two sides, we have \[a^2 + b^2 = c^2\]
We can refer to a named theorem. Remember trig theorem 2.1
2.5 Tables
We can have tables
| mpg | cyl | disp | hp | drat | wt | qsec | vs | |
|---|---|---|---|---|---|---|---|---|
| Mazda RX4 | 21.0 | 6 | 160.0 | 110 | 3.90 | 2.620 | 16.46 | 0 |
| Mazda RX4 Wag | 21.0 | 6 | 160.0 | 110 | 3.90 | 2.875 | 17.02 | 0 |
| Datsun 710 | 22.8 | 4 | 108.0 | 93 | 3.85 | 2.320 | 18.61 | 1 |
| Hornet 4 Drive | 21.4 | 6 | 258.0 | 110 | 3.08 | 3.215 | 19.44 | 1 |
| Hornet Sportabout | 18.7 | 8 | 360.0 | 175 | 3.15 | 3.440 | 17.02 | 0 |
| Valiant | 18.1 | 6 | 225.0 | 105 | 2.76 | 3.460 | 20.22 | 1 |
| Duster 360 | 14.3 | 8 | 360.0 | 245 | 3.21 | 3.570 | 15.84 | 0 |
| Merc 240D | 24.4 | 4 | 146.7 | 62 | 3.69 | 3.190 | 20.00 | 1 |
| Merc 230 | 22.8 | 4 | 140.8 | 95 | 3.92 | 3.150 | 22.90 | 1 |
| Merc 280 | 19.2 | 6 | 167.6 | 123 | 3.92 | 3.440 | 18.30 | 1 |
|
|
2.6 Figures
par(mar = c(4, 4, .1, .1))
plot(cars, pch = 19)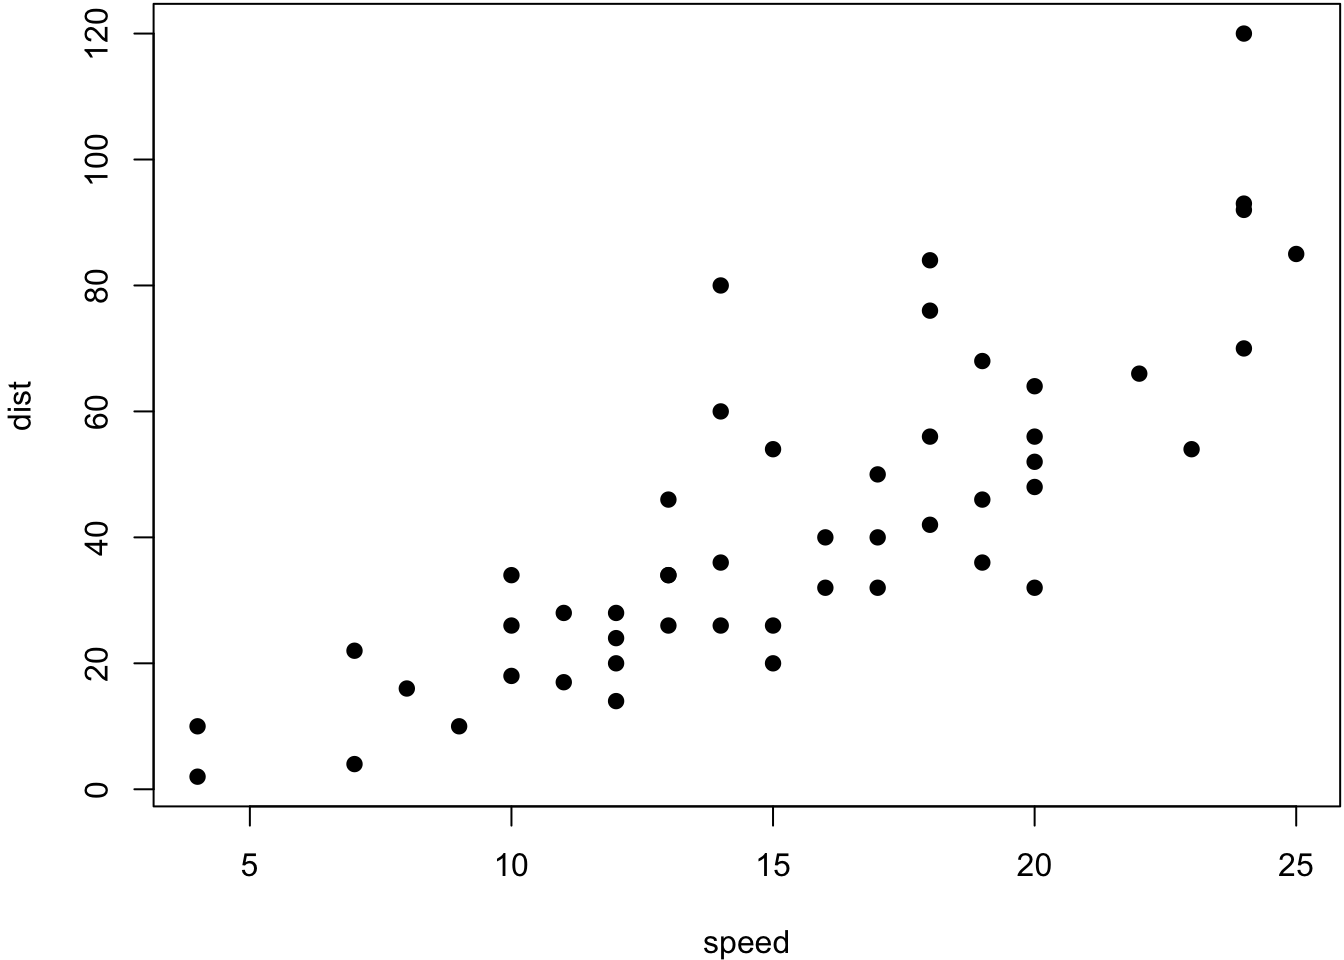
Figure 2.1: A figure example with a relative width 70%.
knitr::include_graphics(rep('memoji.png'))
Figure 2.2: Memoji of Rishi Goutam
2.7 HTML Widgets
See htmlwidgets
We can also use JavaScript libraries for rich data visualizations. Install the below for outputting to non-HTML files.
install.packages("webshot")
webshot::install_phantomjs()
We use the DT package to show the iris dataset:
DT::datatable(iris)Figure 2.3: A table widget rendered via the DT package.
This is a footnote.↩︎