intro-to-R
2023-10-07
Welcome to Omic-sciences!

The bookdown version of these pages is published on my page at intro-to-R and here, RNAseq_analysis.
What we will cover:
This course will cover several of the statistical concepts and data analytic skills needed to succeed in data-driven life science research as it relates to genomics and the omic sciences. For the bulk of the course we cover topics related to genomics and high-dimensional data. Specifically, we describe multiple testing, error rate controlling procedures, exploratory data analysis for high-throughput data, p-value corrections and the false discovery rate. Here we will cover experimental techniques used in genomics including RNA-seq and variant analysis.
We start with an introduction to R, including data structures, data wrangling and plotting methods. We will then we walk you through an end-to-end gene-level RNA-seq differential expression workflow using various R packages. We will start with the count matrix, perform exploratory data analysis for quality assessment and to explore the relationship between samples, perform differential expression analysis, and visually explore the results prior to performing downstream functional analysis.
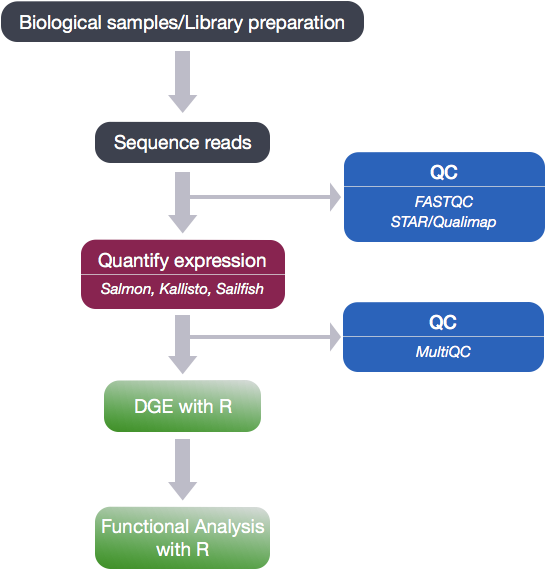
To determine the expression levels of genes, the full RNA-seq workflow follows the steps detailed in the image below. All steps were performed on the command line (Linux/Unix) through the generation of the read counts per gene. The differential expression analysis and downstream functional analysis are generally performed in R using R packages specifically designed for the complex statistical analyses required to determine whether genes are differentially expressed.
We will next cover variant analysis from FASTQ files to mapping genome sequencing data to a reference and produce high-quality variant calls that can be used in downstream analyses. We will use a pipeline employing the Genome Analysis Toolkit (GATK) to perform variant calling that is based on the best practices for variant discovery analysis outlined by the Broad Institute. The result will be the identification of genomic variants, such as single nucleotide polymorphisms (SNPs) and DNA insertions and deletions (indels).
We will cover the concepts of distance and dimension reduction. We will introduce Principal Component Analysis for dimension reduction. Principal Component Analysis (PCA) is a technique used to emphasize variation and bring out strong patterns in a dataset. Once we learn this, we will be ready to cover hierarchical clustering and other methods of visualization.
Finally, we cover functional analysis of high-throughput data. The output of RNA-seq differential expression analysis is a list of significant differentially expressed genes (DEGs). To gain greater biological insight on the differentially expressed genes there are various analyses that can be done:
- determine whether there is enrichment of known biological functions, interactions, or pathways
- identify genes' involvement in novel pathways or networks by grouping genes together based on similar trends
- use global changes in gene expression by visualizing all genes being significantly up- or down-regulated in the context of external interaction data
How is this course different?
While statistics textbooks focus on mathematics, this book focuses on using a computer to perform data analysis by stating a practical data-related challenge. This book also includes the computer code that provides a solution to the problem and helps illustrate the concepts behind the solution. By running the code yourself, and seeing data generation and analysis happen live, you will get a better intuition for the concepts, the mathematics, and the theory.
Throughout the course we show the R code that performs genomic analysis. All sections of this book are reproducible as they were made using R markdown documents that include R code used to produce the figures, tables and results.
The first lesson will walk you installing R and RStudio and the material for the course.